4723
Multi-parametric MRI for Evaluating Variations in Structure, Function, and Metabolites in Acute Kidney Injury Induced by Ischemia Reperfusion1Department of Rehabilitation Medicine, Zhujiang Hospital, Southern Medical University, Guangzhou, China, 2Guangdong Provincial Key Laboratory of Medical Image Processing, Southern Medical University, Guangzhou, China, 3Guangdong Provincial Engineering Laboratory for Medical Imaging and Diagnostic Technology, Southern Medical University, Guangzhou, China, 4School of Biomedical Engineering, Southern Medical University, Guangzhou, China, 5Medical Imaging Center, Nanfang Hospital, Southern Medical University, Guangzhou, China, 6Philips Healthcare, Shenzhen, China, 7Philips Healthcare, Guangzhou, China
Synopsis
Keywords: Small Animals, CEST & MT
Motivation: There is lack of a comprehensive MRI technique to comprehensively detect the acute kidney injury (AKI) induced by ischemia reperfusion injury (IRI).
Goal(s): We aimed to develop the mpMRI for diagnosis of AKI induced by ischemia reperfusion IRI.
Approach: The IRI-AKI model of 40-minutes ischemia in rats were established, and mpMRI is conducted at 0, 1, 3, 7, 14, and 28 days. Several MRI indexes signal and their diagnosis performance were compare, respectively.
Results: Multi-parametric MRI may shows comprehensive variations in IRI-AKI, and amine-CEST may exhibits the highest accuracy for diagnosis of IRI-AKI.
Impact: This may provide guideline for clinical application of renal mpMRI.
Introduction
IRI-AKI may occur after kidney transplant or renal ischemic injury1. There is lack an accurate and comprehensive detection technique for IRI-AKI. Here, we longitudinally evaluated IRI-AKI in rats by renal structure, function, and metabolites using mpMRI2.Method
Animal: This experiment was approved by local Institutional Animal Care and Use Committee. Unilateral renal ischemic reperfusion was induced for 45 min in rats (n = 48).Blood Testing and Histology: SCr and BUN levels were measured, and tubular damage degree and renal interstitial fibrosis were scored.
MRI: The mpMRI include T1 mapping, T2 mapping, arterial spin labeling (ASL), blood oxygen level-dependent (BOLD), quantitative magnetization transfer (qMT), and chemical exchange saturation transfer (CEST) were conducted at 0 (control), 1, 3, 7, 14, and 28 days, each group included 8 rats.
Data Analysis: Relaxation time were fitted by exponential decay function; Blood flow was fitted by equation described by Kim3; The PSR were fitting by Henkelman-Ramani’s model4; CEST signal were fitted by a seven-pool Lorentz fitting. The longitudinal mpMRI signal of manually outlined cortex, outer stripe of the outer medulla (OSOM), inner stripe of the outer medulla, and medulla plus pelvis were calculated and compared.
Statistical Analysis: Pearson correlations analysis for correlation between mpMRI signal and renal injury, unpaired t-tests for comparing the signal changes, receiver operating characteristics (ROC) analysis was used to identify most sensitive indicator of mpMRI. A p-value <0.05 was considered statistically significant.
Results
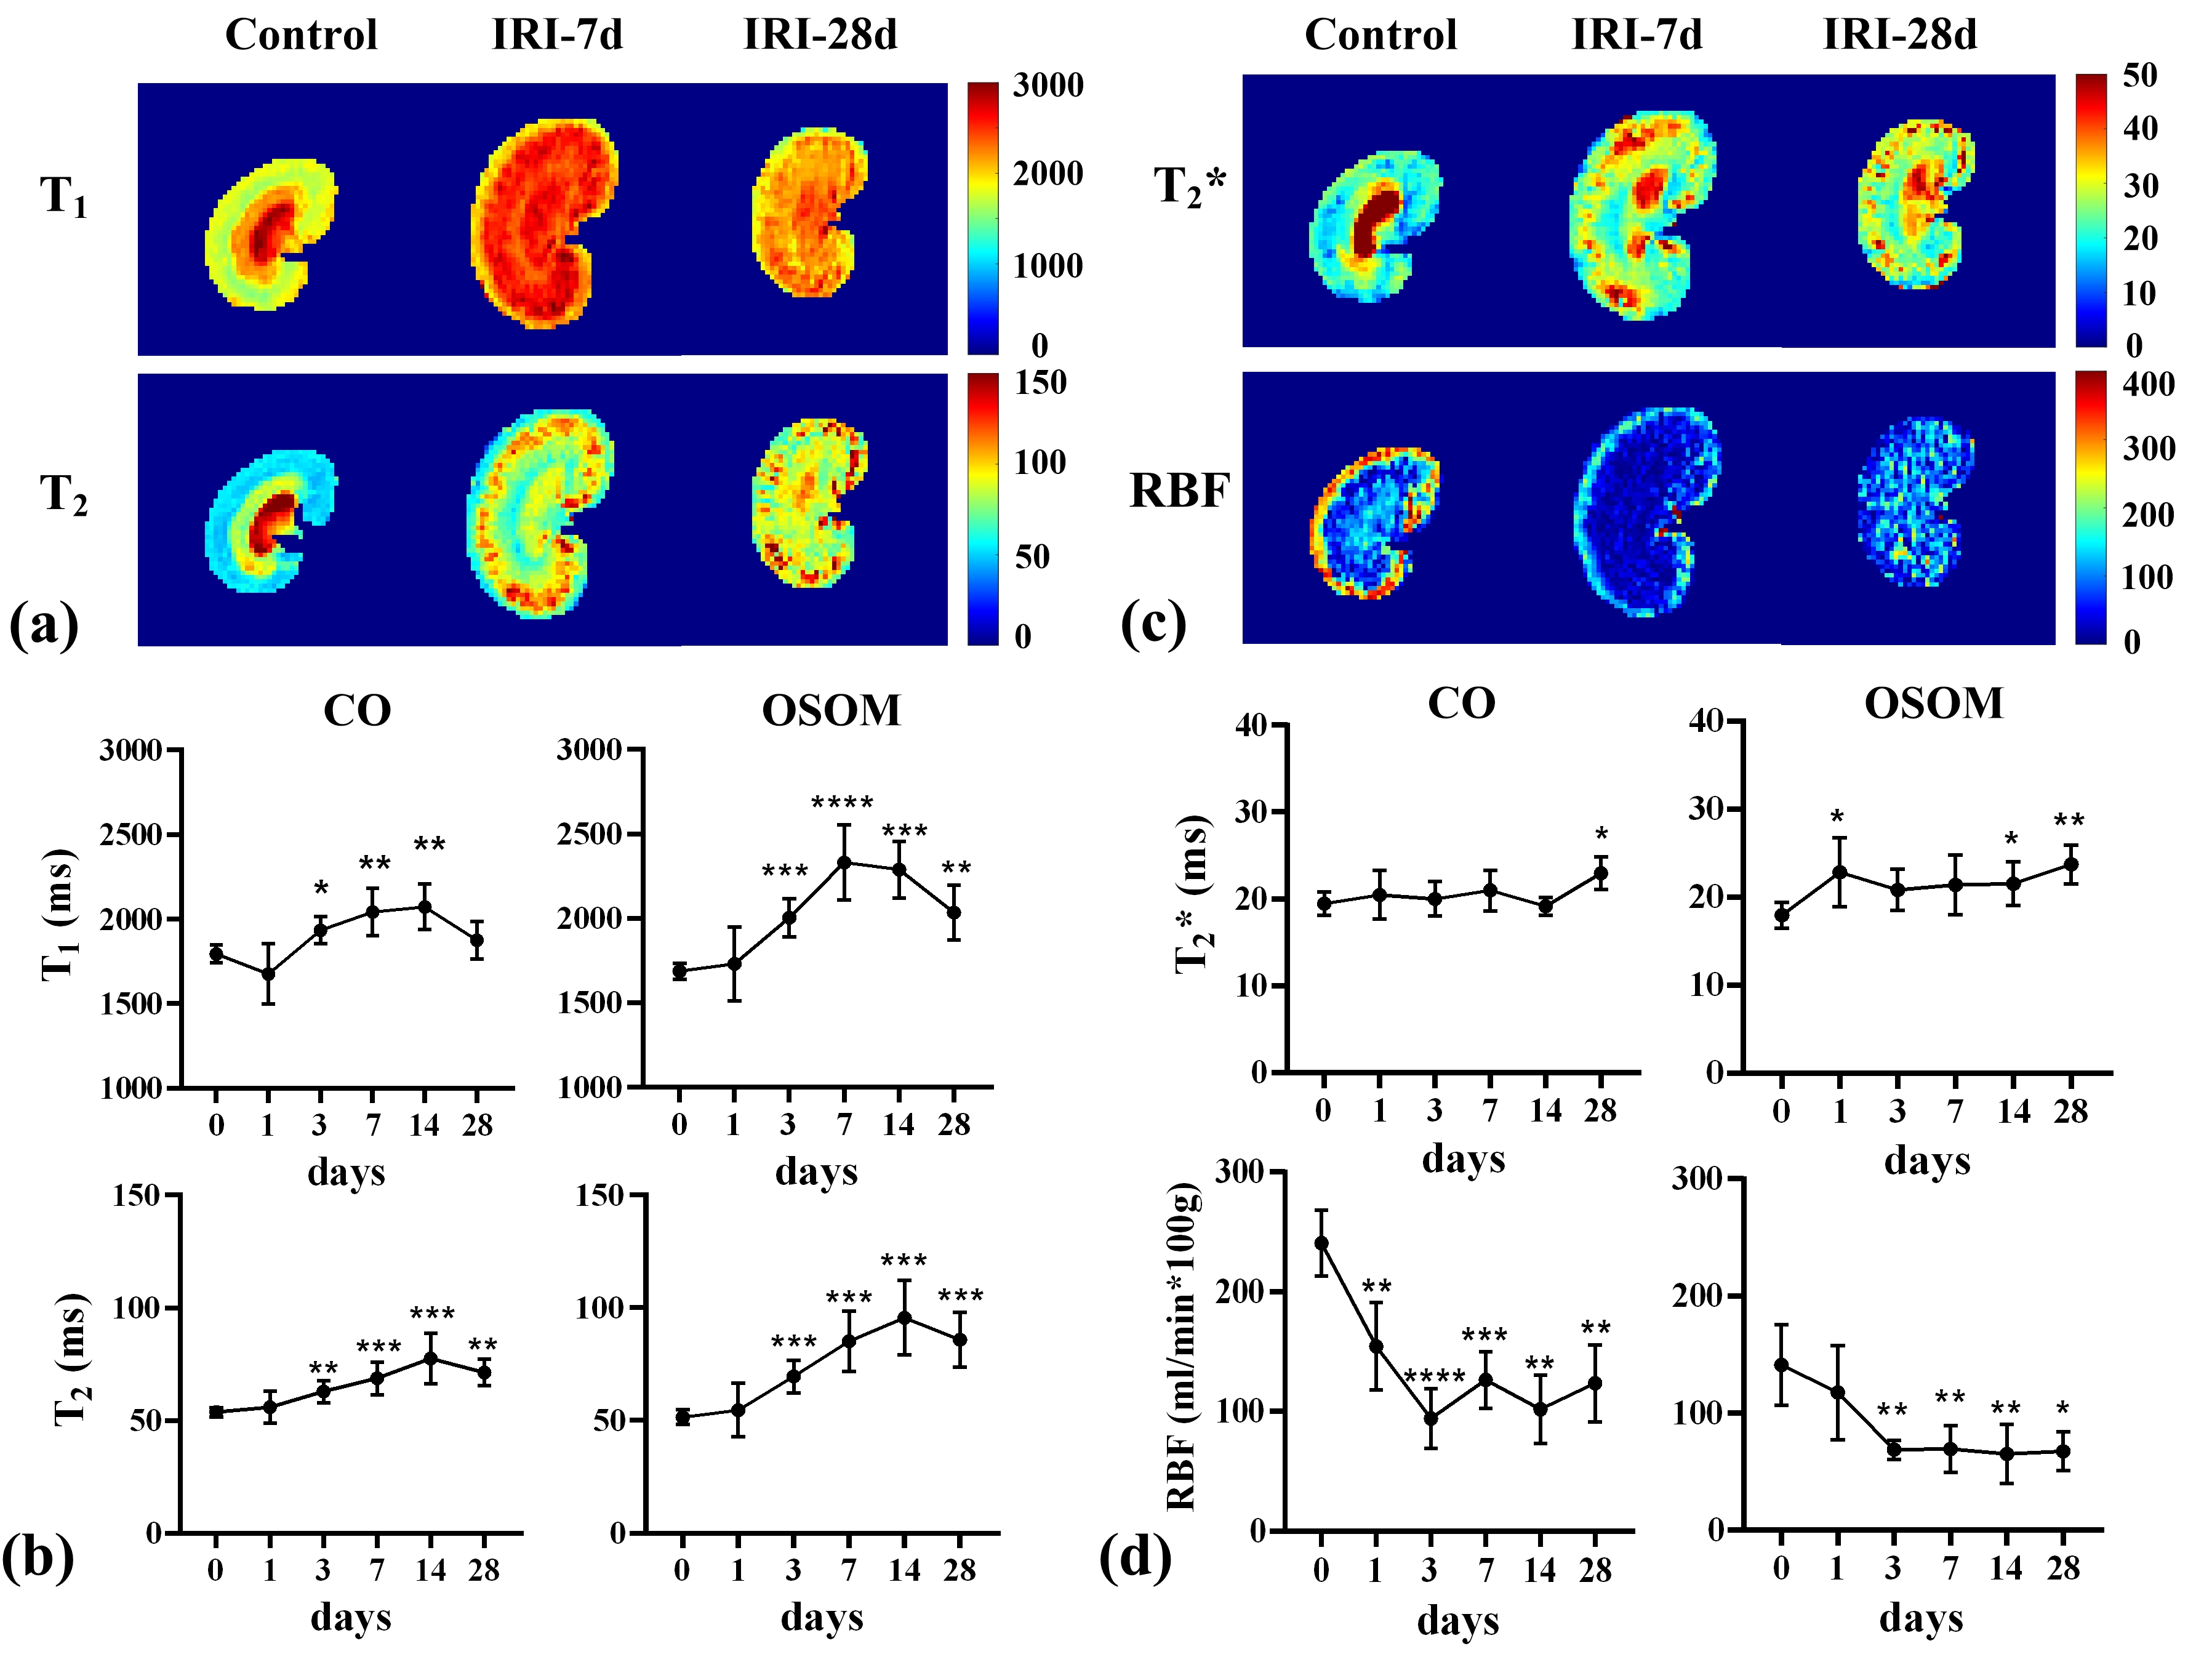
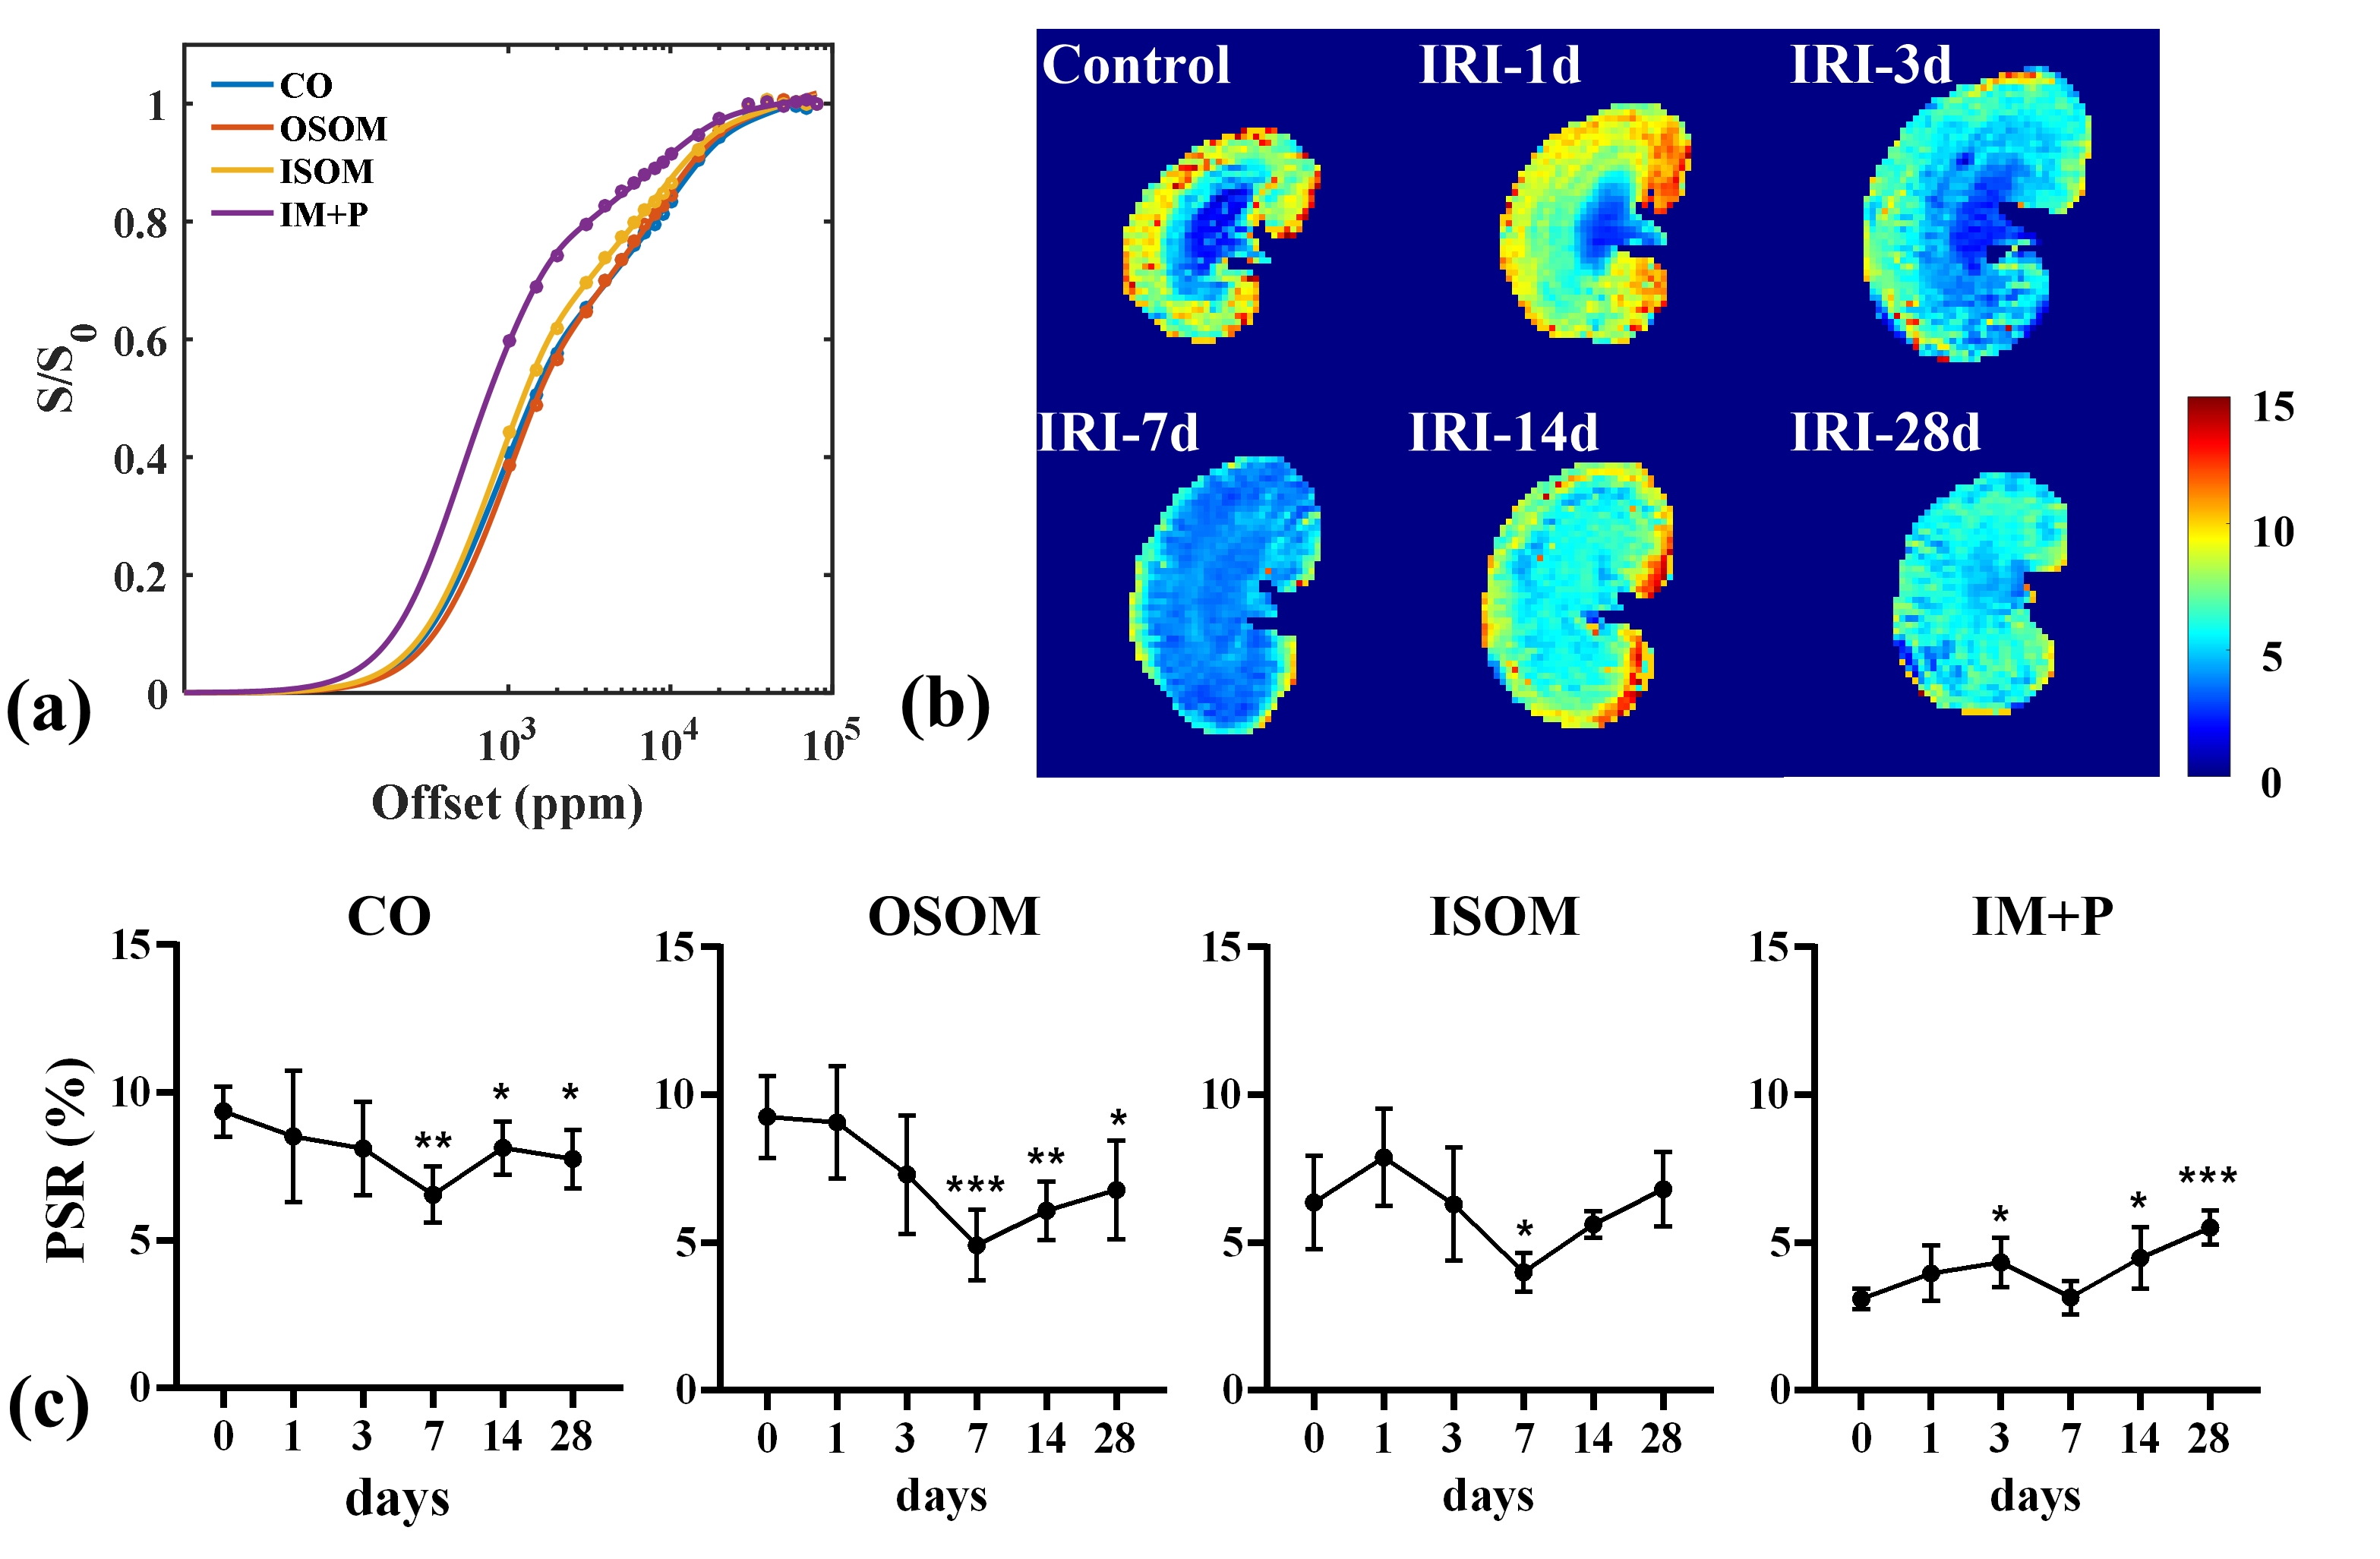
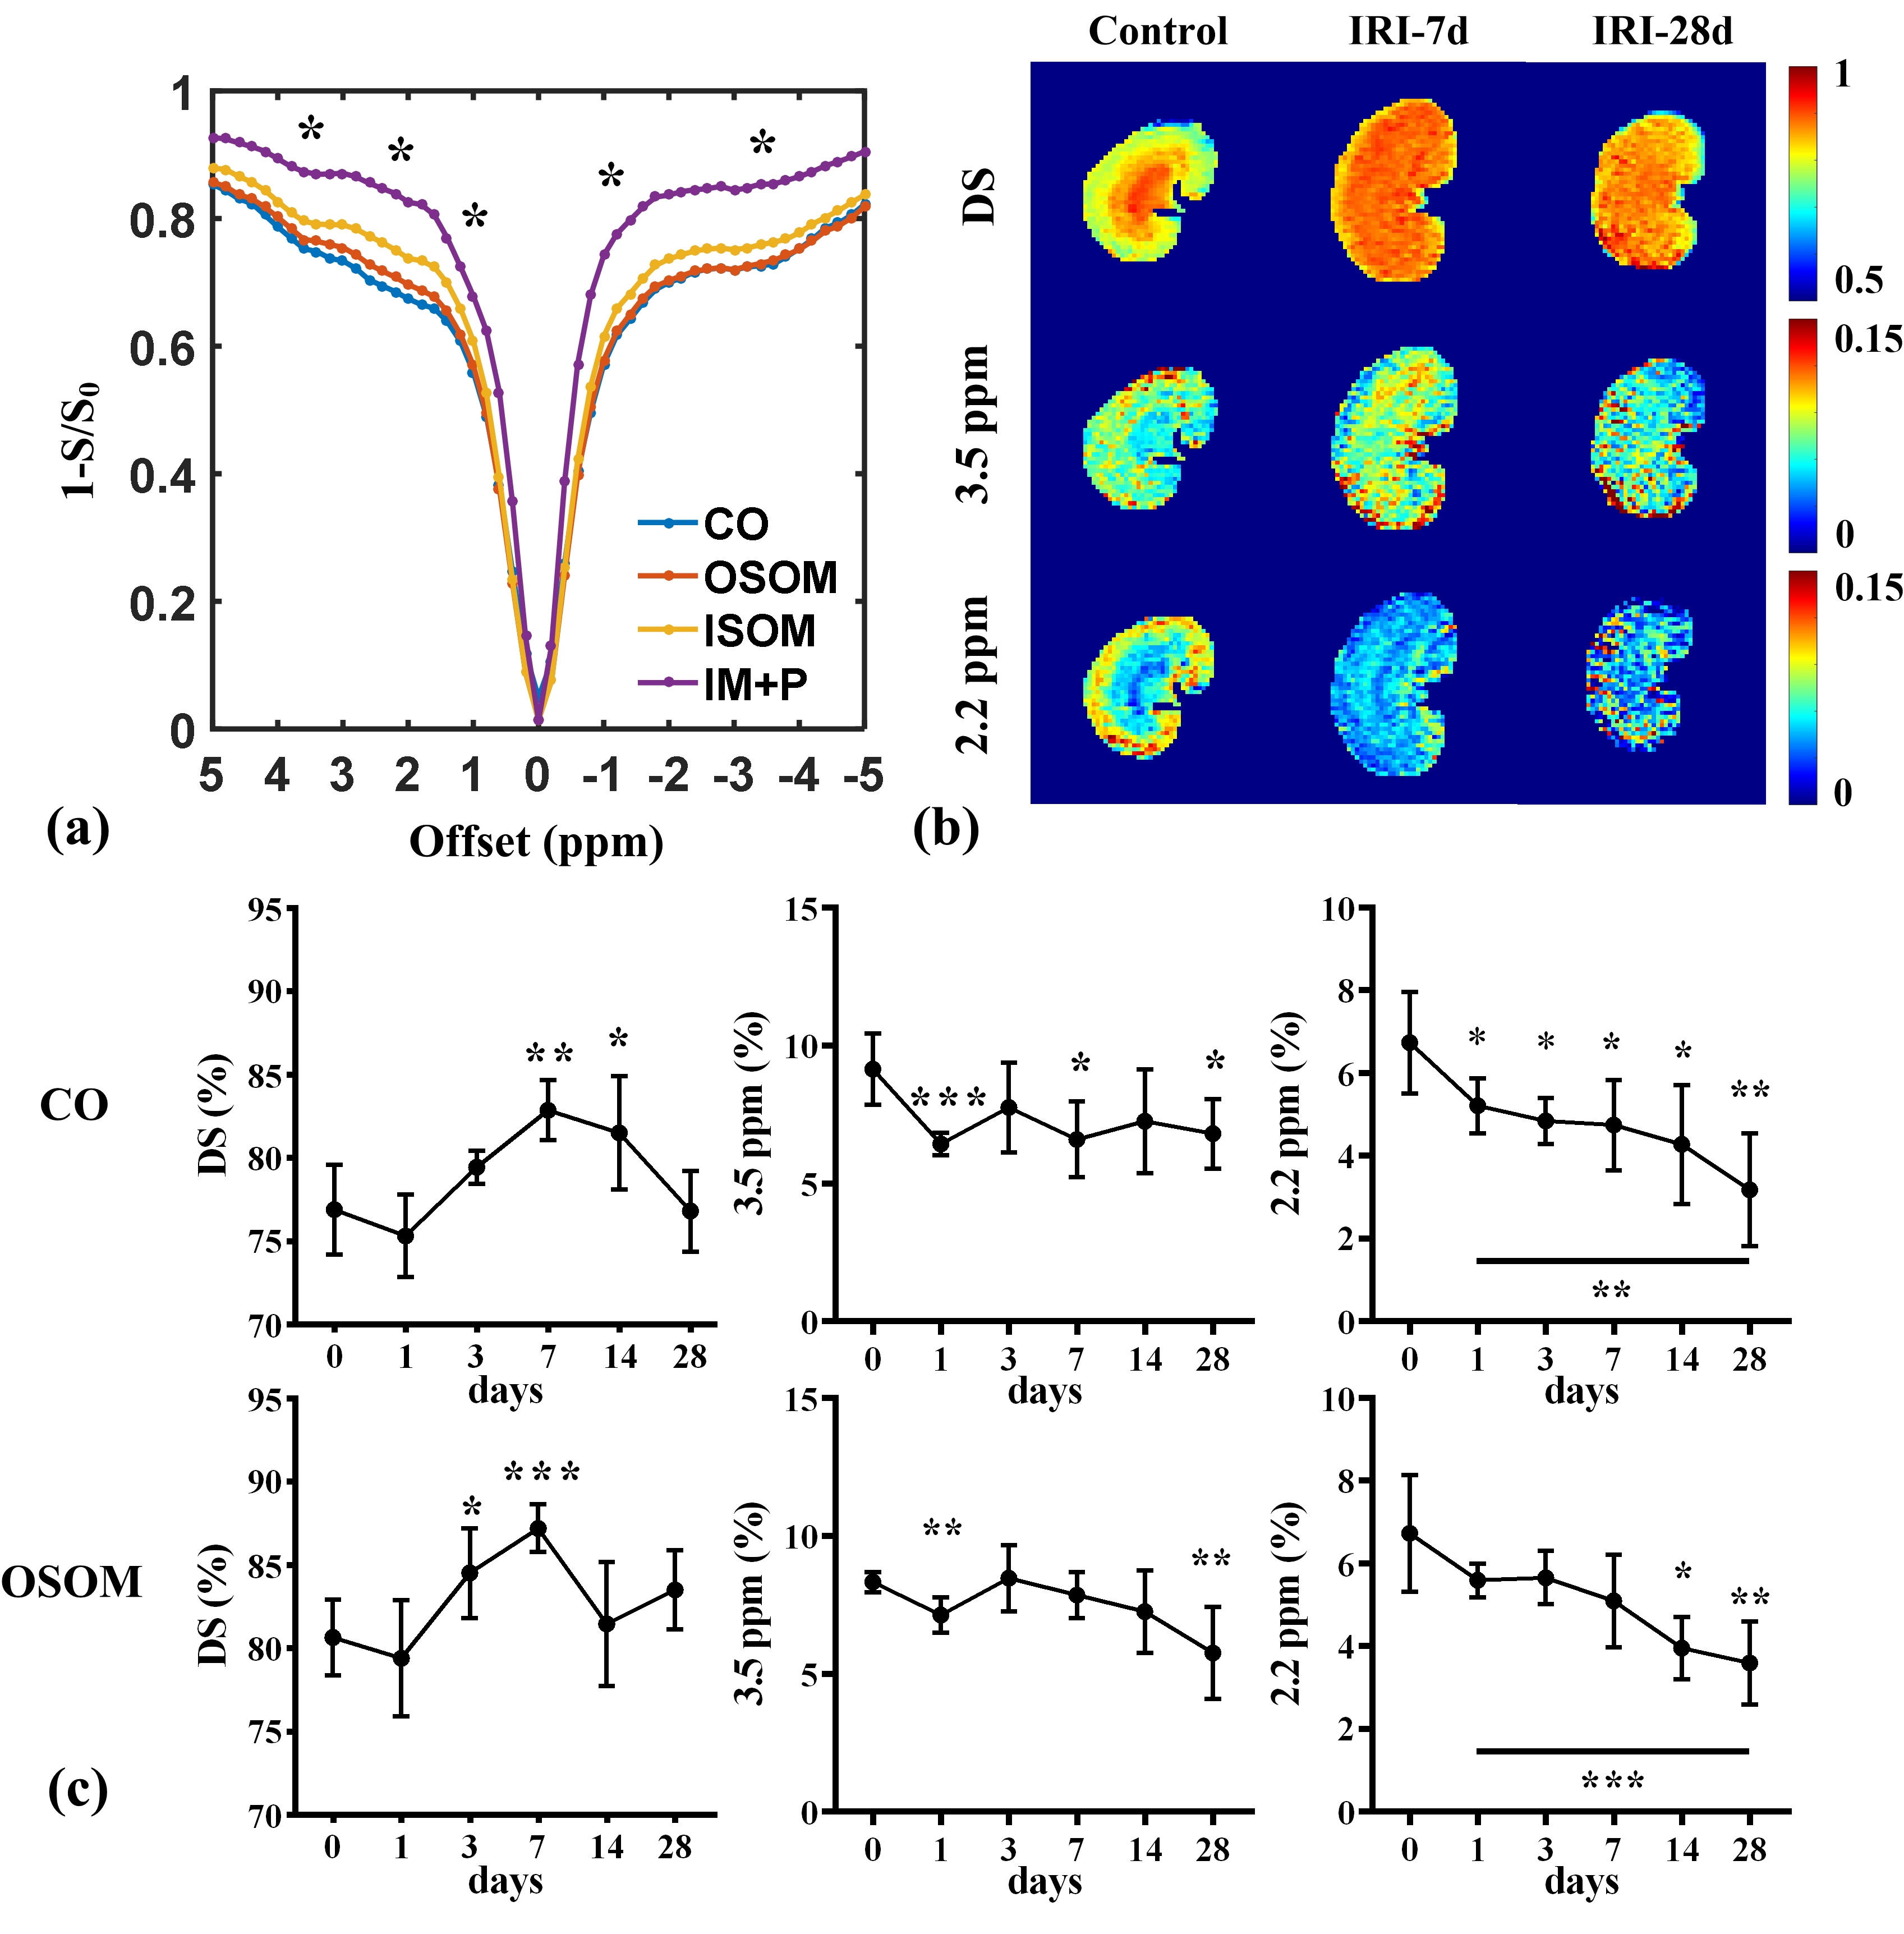
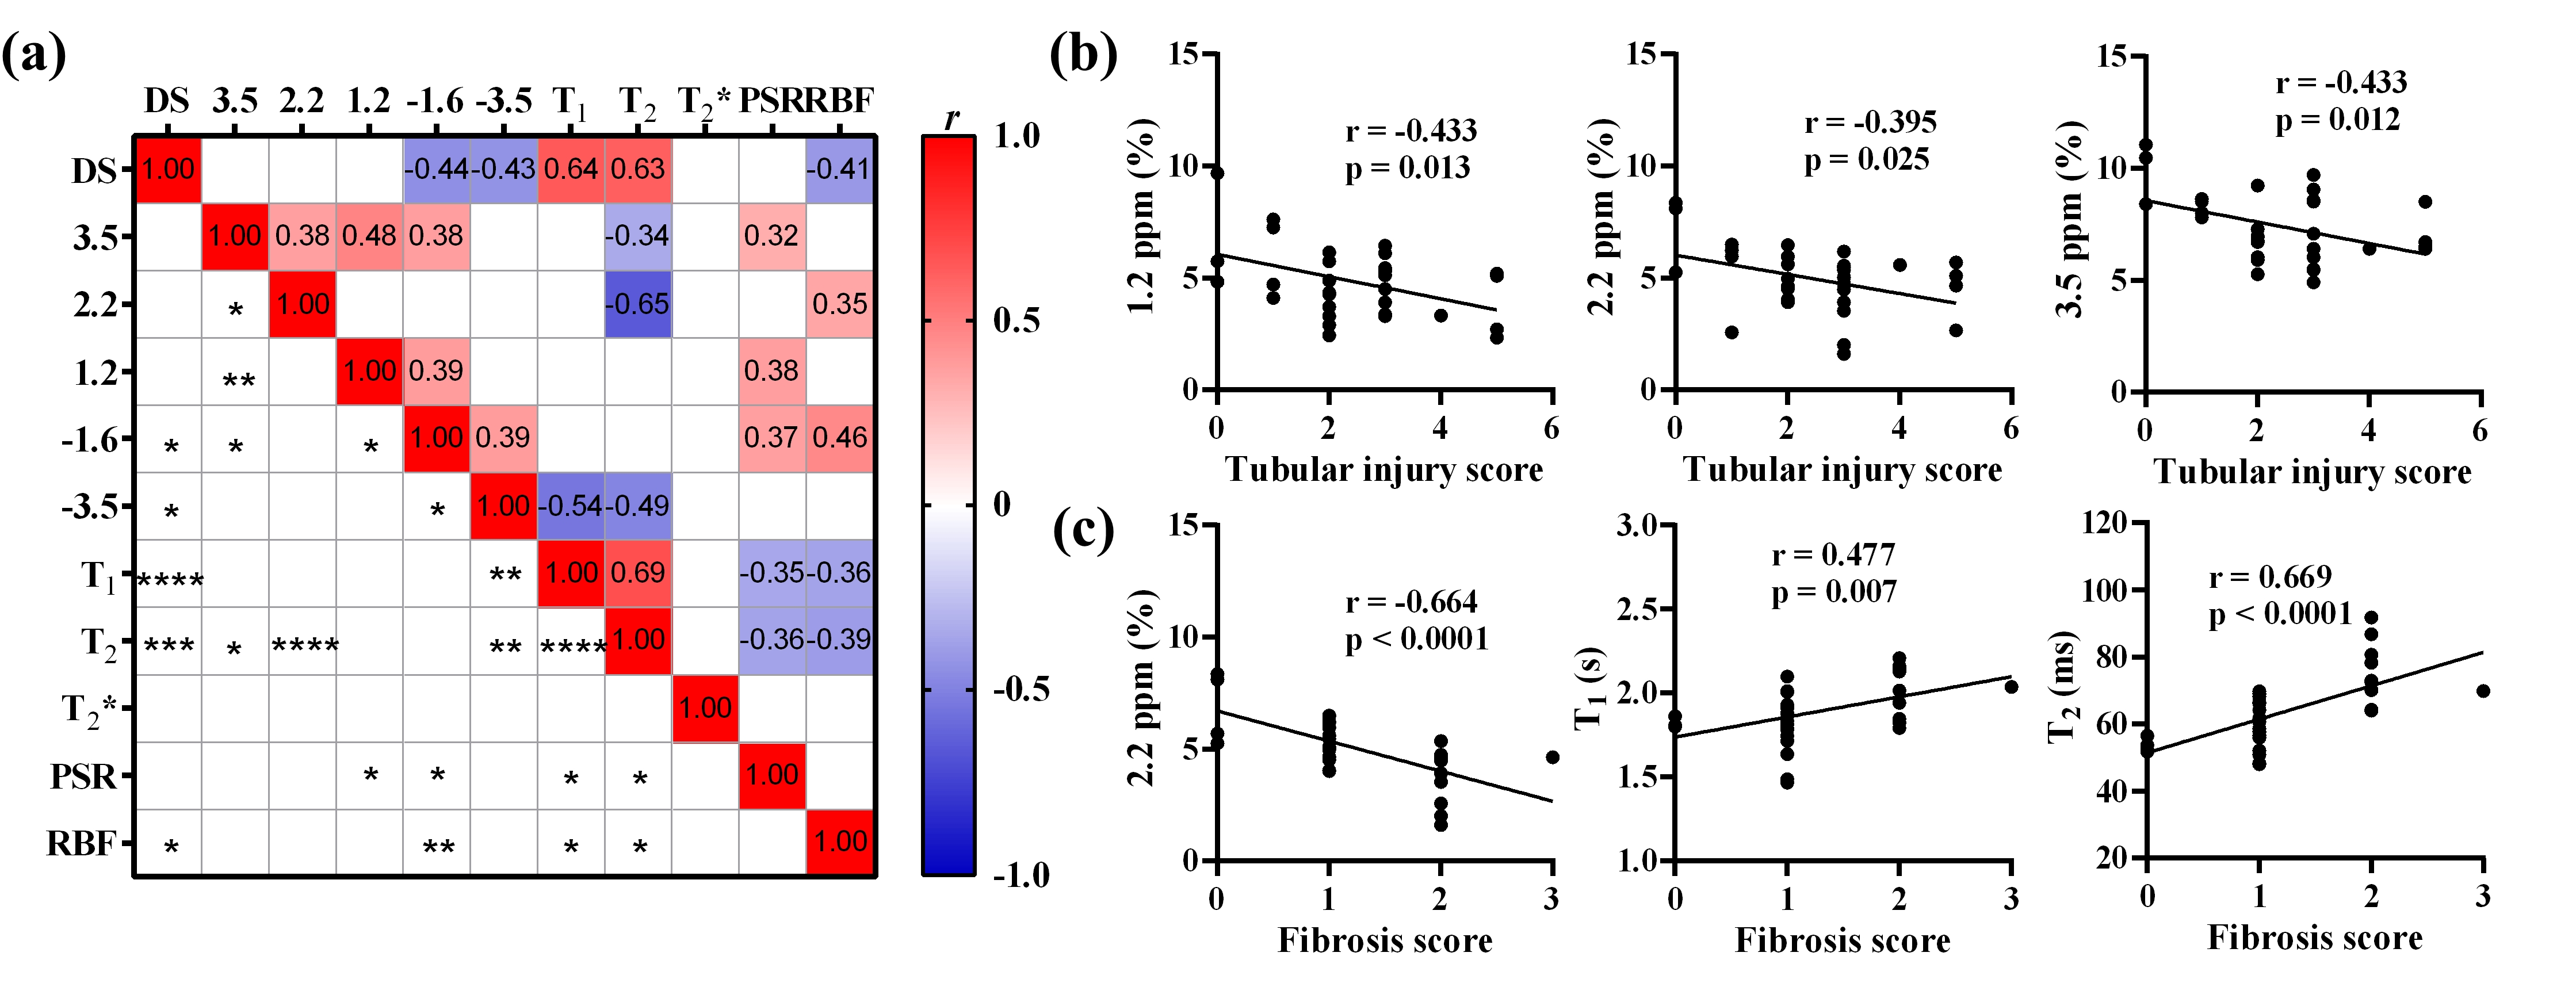
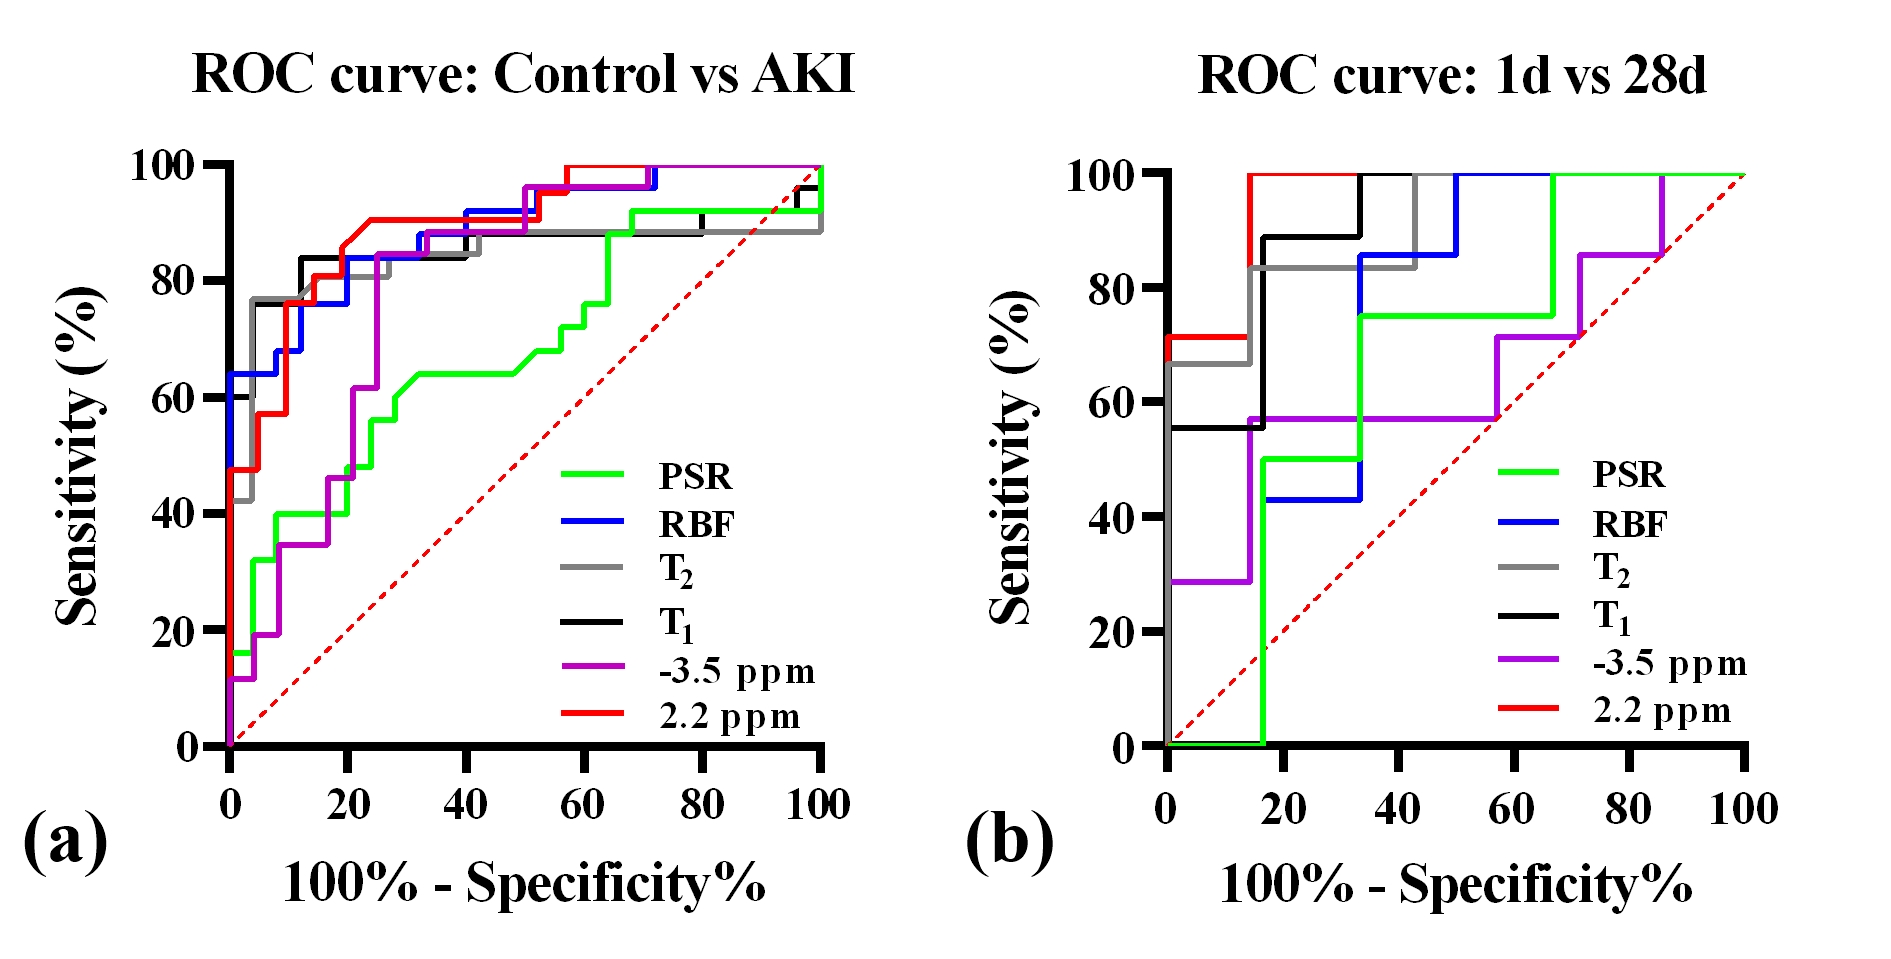
In Fig. 1a and Fig. 1b, the T1 and T2 values of the cortex and medulla in IRI kidneys increased and reached their highest values on day 14 compared with control kidneys, and the IRI kidneys also showed the most severe edema and segments blurred. In Fig. 1c and Fig. 1d, the RBF in the cortex and OSOM showed a significant decline after day 3 and then maintained the lowest signal without recovery, and the BOLD signal in CO showed no significant differences, the BOLD signal in OSOM increased with the AKI development, and peaked on day 28. In Fig. 2 and Fig. 3, the cortical PSR and the amine-CEST both decreased with IRI-AKI progression. In Fig. 4a, the amine CEST signal showed a moderate significant negative correlation with T2 (r = -0.648); There are moderate negative correlations between CEST effects at 3.5, 2.2, and 1.2 ppm with tubular injury score in Fig. 4b; Renal fibrosis showed moderate negative correlations with amine-CEST and RBF, and showed moderate positive correlations with T1 and T2 in Fig. 4c. The amine-CEST achieved the highest AUC (0.899) for the diagnosis of AKI in Fig. 5.Discussion
The kidney has an orderly physiological arrangement of nephrons, including glomeruli, tubules, and blood vessels. Renal morphology, function, and metabolism are correlated, and the evaluated indices are sensitive to renal injury caused by ischemia reperfusion. Specifically, T1 and T2 directly depend on the renal water content and concentration of macromolecules, and both MRI parameters were elevated with an increase in the degree of renal edema, which was also indicated by the morphology of the IRI kidneys. Oxygenation levels and perfusion, measured by BOLD and ASL, were directly affected by ischemia; both of which are sensitive to AKI, which may be due to vasoconstriction induced by cellular edema. Although amine-CEST signal showed the highest sensitivity for AKI diagnosis, increased tissue water content, decreased amine proton concentration caused by apoptosis, and decreased blood volume all contribute to the reduction of the amine-CEST signal during IRI-AKI. There are three limitations in this study. The first is the long acquisition time (27 min); The second is the difficulty in interpreting MR signal changes relate to the variations of metabolism; Finally, the number of rats include in each group is small (n = 8) and the correlation between ischemic severity and MR parameters has not yet been studied.Conclusion
Multi-parametric MRI may shows comprehensive variations in IRI-AKI, and amine-CEST may exhibits the highest accuracy for diagnosis of IRI-AKI.Acknowledgements
This study was supported by National Natural Science Foundation of China (U21A6005), Key-Area Research and Development Program of Guangdong Province (2018B030340001, 2018B030333001).References
1. Lameire N H, Bagga A, Cruz D, et al. Acute kidney injury: an increasing global concern[J]. Lancet, 2013, 382(9887): 170-179.
2. Buchanan C, Mahmoud H, Cox E, et al. Multiparametric MRI assessment of renal structure and function in acute kidney injury and renal recovery[J]. Clinical Kidney Journal, 2021, 14(8): 1969-1976.
3. Kim S G. Quantification of relative cerebral blood flow change by flow‐sensitive alternating inversion recovery (FAIR) technique: application to functional mapping[J]. Magnetic resonance in medicine, 1995, 34(3): 293-301.
4. Henkelman R M, Huang X, Xiang Q S, Stanisz G, Swanson S D, Bronskill M J. Quantitative interpretation of magnetization transfer. Magnetic Resonance in Medicine 1993; 29(6): 759-766.
Figures