4717
Graph Neural Networks Elucidating Mesial Temporal Lobe Epilepsy Through Simultaneously Acquired PET and DTI Data – A Pilot Study1Radiology and Imaging Science, Emory University School of Medicine, Atlanta, GA, United States, 2Biomedical Engineering, Stony Brook University, Stony Brook, NY, United States, 3School of Biomedical Engineering, Shanghai Jiao Tong University, Shanghai, China, 4Ruijin Hospital, Shanghai, China, 5Biomedical Engineering, Georgia Institute of Technology, Atalnta, GA, United States
Synopsis
Keywords: Analysis/Processing, Epilepsy, AI, MTLE
Motivation: There is an urgent need to improve diagnostic accuracy and surgical outcomes for Mesial Temporal Lobe Epilepsy (MTLE) patients, particularly those with drug-resistant forms and unclear epileptogenic zones
Goal(s): To explore the relation between structural connectivity and FDG PET uptake by using Graph Neural Network.
Approach: Graphs were constructed based on diffusion images of the patients. A graph network was trained to predict FDG PET uptake in selected regions.
Results: The graph network was able to predict FDG uptake in several regions such as thalamus, middle temporal, and entorhinal cortex. Whereas the network failed to predict uptake in some other regions.
Impact: The study advances understanding of the underlying mechanisms in MTLE by illuminating the relationship between white matter structural connectivity and regional metabolic activity, which could lead to enhanced diagnostic approaches and targeted therapies.
Introduction
Mesial Temporal Lobe Epilepsy (MTLE), the most common drug-resistant epilepsy, often involves hippocampal sclerosis (HS)1. Although anterior temporal lobectomy is a common surgical approach for MTLE patients, a significant number of them continue to experience seizures post-surgery2. This may be attributed to extensive damage in their brain networks.18F-FDG-PET is highly sensitive to metabolic changes in the epileptogenic zone (EZ)3, which typically encompasses hypometabolism extending beyond the presumed EZ and occasionally reaching remote extratemporal regions4. Meanwhile, DTI is a valuable tool for evaluating the integrity of white matter tracts5. However, the relationship between WM diffusivity changes topographically and hypometabolism observed in 18F-FDG-PET in MR-HS and MR-negative patients is unclear.
Graph is a natural way to represent diffusion tractography and graph neural network is an artificial intelligence network designed to be applied to graph. Our study aims to explore the relation between structural connectivity and FDG PET uptake by using graph network.
Methods
Data acquisitionWe recruited 55 drug-refractory unilateral MTLE patients (age > 18). One subject was excluded due to low image quality. All subjects were scanned on a 3T PET/MR scanner (Biograph mMR). The PET images were obtained around 45 minutes post a bolus injection of 18F-FDG following clinical protocol. During the PET acquisition, MR data were simultaneously acquired: MPRAGE (1.0×1.0×1.0mm3, TR/TE/TI= 1900/2.44/900 ms), and diffusion MRI (2.0×2.0mm2, thickness=2.0 mm, TR/TE=10200/90ms, 30 diffusion encoding directions with b=1000s/mm2, and 6 with b=0). In addition, other clinical records, including semiology, long-term video-EEG monitoring, and radiological diagnoses of MR-HS and MR-negative cases, were collected.
Data processing
Standardized uptake value ratios (SUVR) were calculated for 74 cortical and subcortical regions on the 18F-FDG PET images, normalized using cerebellar gray matter. Diffusion-weighted images underwent preprocessing for motion and eddy current correction, and QSDR [HC1] reconstruction was performed using DSI-studio after visual quality inspection. Deterministic tractography was performed with 1,000,000 seeds. Fractional anisotropy (FA), number of tracts between each pair of regions and mean diffusivity (MD) for each region were calculated. The volume of each region was normalized by estimated Total Intracranial Volume (eTIV).
Graph Network and evaluation
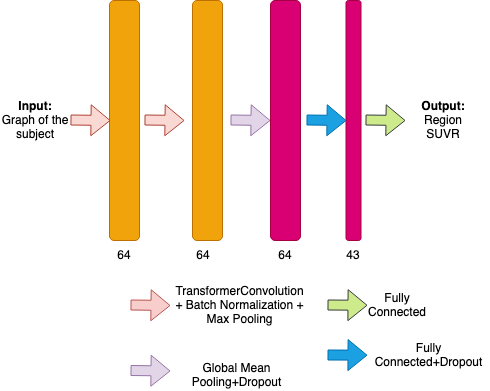
The regions are used as the graph nodes with node features including MR-HS or MR-negative, ipsilateral or contralateral, age, age at epilepsy onset, illness duration, seizure frequency, region volume, and regional MD. Edge weight for the edge between two nodes were FA values and number of tracts for the corresponding region pair. No edge is built if the count between the pair of regions is zero (hence no FA). Self-loop is added. The network is built using pytorch_geometric library and the structure is shown in Figure 1. The task of the network is to predict the SUVR of that region using individual graphs as input with MSE as the loss function. We focused on regions that are known to be associated with MTLE and seizure shown in Figure 2.
Data from 54 patients were divided into training set and testing set (44:10). All results shown below are from the testing set.
Result
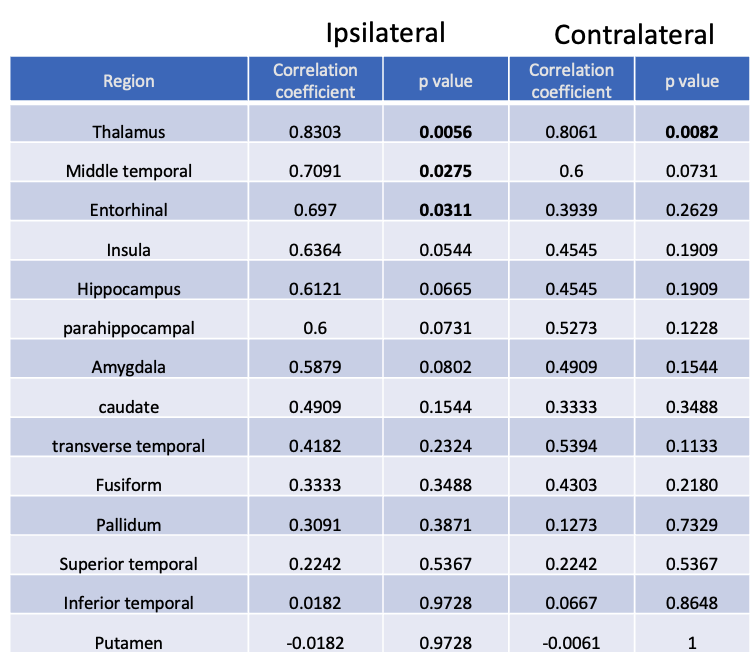
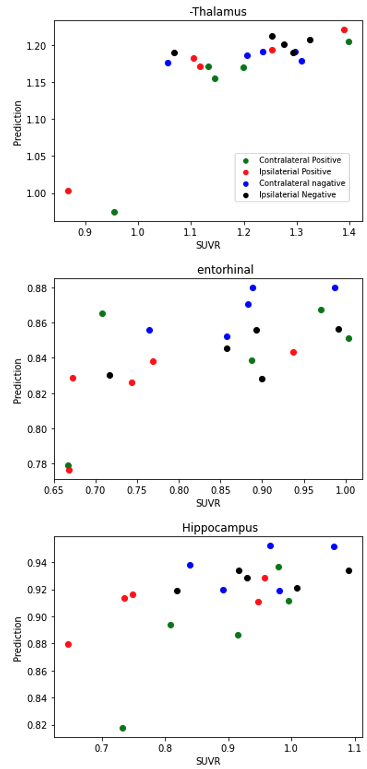
To compare the network-predicted uptake versus the ground truth, Spearman correlation analysis was performed in focus regions. The results are shown in Figure 2. The scatter plot of network-predicted SUVR and measured SUVR of several representative regions are shown in Figure 3. Several regions achieved correlation coefficients greater than 0.5, including thalamus, middle temporal, and entorhinal cortex. Particularly both sides of thalamus, ipsilateral side of the middle temporal, ipsilateral side of the entorhinal and showed statistically significant correlation (no multiple comparison correction). And insula and middle temporal cortex were found to be approaching significance.Discussion
The results indicate that a graph neural network can effectively correlate DTI-based structural connectivity with regional FDG PET uptake in MTLE in several key regions implicated in the disorder. This correlation is particularly strong in regions known to be associated with MTLE, such as the thalamus, middle temporal cortex.The fact that some regions did not achieve high correlation could suggest that the relationship between structural connectivity and metabolic activity in these areas is less straightforward or possibly influenced by other factors not accounted for in this study. This finding may prompt further investigation into the complex network interactions within these regions and their role in the epileptogenic network.
Furthermore, the ability to predict regional FDG PET uptake using DTI data could aid in the non-invasive characterization of EZ, which is crucial for surgical planning.
Future research should address the study's limitations by incorporating a larger, more diverse cohort and longitudinal data to better understand MTLE progression and treatment efficacy.
Acknowledgements
Jie Luo, Miao Zhang, Siyu Yuan, Hui Huang would like to acknowledge support from the National Natural Science Foundation of China (No. 62101321, No. 30900375), Shanghai Science and Technology Commission project (No.17411964800), Shanghai Municipal Key Clinical Specialty (No. shslczdzk03403), and 3-year planning of the Shanghai Shen-Kang Promoting Hospital’s Clinical Skills and Innovative AbilityProject (No. 16CR3110B).
Chuan Huang, Jia Ying and Tianyun Zhao declare no financial conflict of interest.
References
1. Bezukladova S, Tuisku J, Matilainen M, et al. Insights into disseminated MS brain pathology with multimodal diffusion tensor and PET imaging. Neurol Neuroimmunol Neuroinflamm. 2020;7(3):e691. doi:10.1212/NXI.0000000000000691
2. Wiebe S. Outcome patterns in epilepsy surgery—the long-term view. Nat Rev Neurol. 2012;8(3):123-124. doi:10.1038/nrneurol.2012.9
3. Kim YK, Lee DS, Lee SK, et al. Differential Features of Metabolic Abnormalities Between Medial and Lateral Temporal Lobe Epilepsy: Quantitative Analysis of 18F-FDG PET Using SPM. Journal of Nuclear Medicine. 2003;44(7):1006-1012.
4. Laurent A, Artiges E, Mellerio C, et al. Metabolic correlates of cognitive impairment in mesial temporal lobe epilepsy. Epilepsy & Behavior. 2020;105:106948. doi:10.1016/j.yebeh.2020.106948
5. Basser PJ, Pierpaoli C. Microstructural and physiological features of tissues elucidated by quantitative-diffusion-tensor MRI. Journal of Magnetic Resonance. 2011;213(2):560-570. doi:10.1016/j.jmr.2011.09.022
Figures