4715
Prediction patients with alcohol dependence via graph classification on Brain Network Derived from Functional Magnetic Resonance Imaging1Lee Gil Ya Cancer & Diabetes Institute, Gachon University, Incheon, Korea, Republic of, 2Department of Health Sciences and Technology, GAIHST, Gachon University, Incheon, Korea, Republic of
Synopsis
Keywords: Diagnosis/Prediction, fMRI (resting state), Alcohol dependence, Graph classification, graph embedding technique
Motivation: The study is motivated by the need for innovative approaches to alcoholism classification, leveraging neuro-functional network analysis from fMRI data to improve diagnostic accuracy and gain insights into alcoholism's complex nature.
Goal(s): The primary goal is to achieve accurate alcoholism classification using functional connectivity patterns and machine learning.
Approach: The study employed fMRI data from 15 healthy controls and 15 patients with alcohol dependence, utilizing advanced graph analysis techniques and machine learning algorithms.
Results: The approach demonstrated a 73% classification accuracy, highlighting the potential of functional connectivity patterns as diagnostic markers and the value of machine learning in quantifying network differences.
Impact: This research contributes to more precise alcoholism diagnosis and offers opportunities for biomarker discovery. It may facilitate earlier intervention and more effective treatments, benefiting both clinicians and patients. The impact includes advancing addiction research and improving patient care.
Introduction
This study introduces a novel approach for the classification of alcoholism, leveraging brain network graph matrices derived from functional magnetic resonance imaging (fMRI) data. In contrast to traditional clinical diagnoses, which rely on clinical grounds, this research aims to identify distinctive neuro-functional network alterations associated with chronic alcohol use. By quantifying network-level brain features, we provide a systematic framework for the diagnosis of alcoholism and would be gain fresh insights into its pathophysiology.Methods
Fifteen healthy controls and 15 ADP diagnosed by a psychiatrist based on the Diagnostic and Statistical Manual of Mental Disorders 5 (DSM-5)1 (Table 1) underwent resting-state fMRI scanning. The functional and structural data were collected by a 3 Tesla MRI system (Philips Achieva scanner, Philips Healthcare, Best, the Netherlands) with an 8-channel head coil. Graph analysis was conducted through the application of the CONN-fMRI FC toolbox (version 21a) in conjunction with SPM12 software. Graph matrices were constructed with 164 nodes as Regions of Interest (ROI), and a graph adjacency matrix was derived by thresholding the correlated ROI-to-ROI correlations.2 The extraction of low-dimensional features from the brain networks was executed via the "graph2vec" graph embedding technique.3 Subsequently, a random forest classifier was employed to categorize brain networks based on their low-dimensional features, as illustrated in Figure 1. Classification results were assessed against the ground-truth to ascertain classification accuracy, while prediction accuracy was computed using leave-one-out cross-validation (LOOCV).Results
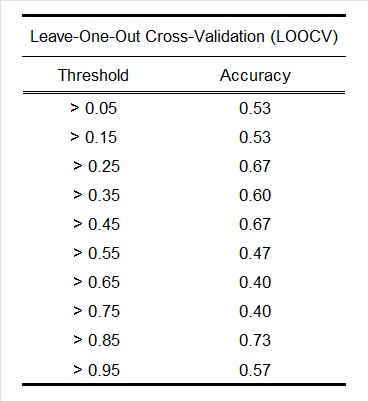
The averaged correlation coefficient matrices depicting functional connections for the control group (Fig. 2A) and the ADP group (Fig. 2B). Additionally, binary adjacency matrices are presented in Figure 3, delineating the values of matrices based on specific threshold criteria. Employing the graph2vec methodology, our investigation attains a classification accuracy of 73% while operating under a threshold level of 0.85, as evidenced in Table 2.Discussion
This study introduces an innovative approach to classify alcoholism, focusing on the examination of neuro-functional network alterations derived from fMRI data. The functional connectivity patterns, as illustrated in Figure 2, exhibit potential as diagnostic markers. Notably, our proposed method demonstrates superior performance, achieving a classification accuracy of 73%, compared to a previous study that reported an accuracy of 65%.4 Therefore, it is reasonable to posit that the observed lower accuracy in distinguishing the alcohol dependence group from the control group could potentially be ameliorated through the application of advanced graph embedding techniques5,6 or the utilization of graph deep learning methodologies7,8 with a more extensive dataset.Conclusion
This approach marks a significant advancement towards a more systematic and insightful framework for addressing the complex challenge of alcoholism. Future research endeavors and model refinements hold the promise of improving diagnostic accuracy and enhancing clinical applicability in the times ahead.Acknowledgements
This research was supported by the Gachon University Research Fund of 2020 (GCU-2020-03020001) and Basic Science Research Capacity Enhancement Project through the Republic of Korea Basic Science Institute (National Research Facilities and Equipment Center), grant funded by the Ministry of Education (grant No. 2021R1A6C101A432).References
1. Messent P. DSM-5. Clin Child Psychol Psychiatry. 2013;18(4):479-482.
2. Achard S, Bullmore E. Efficiency and cost of economical brain functional networks. PLoS Comput Biol. 2007;3(2):e17.
3. X. Zhu, X. Du, M. Kerich, F.W. Lohoff, R. Momenan, Random Forest based classification of alcohol dependence patients and healthy controls using resting state MRI. Neuroscience Letters 2018;676:27-33. 4. A. Narayanan, M. Chandramohan, R. Venkatesan, L. Chen, Y. Liu, S. Jaiswal. graph2vec: Learning Distributed Representations of Graphs. arXiv:1707.05005v1 (2017).
5. Cui Z, Li Z, Wu S, Zhang X, Liu Q, Wang L, Ai M. DyGCN: Efficient Dynamic Graph Embedding With Graph Convolutional Network. IEEE Trans Neural Netw Learn Syst. 2022;PP.
6. Mohamed SK, Nounu A, Nováček V. Biological applications of knowledge graph embedding models. Brief Bioinform. 2021;22(2):1679-1693.
7. Hang, Muhan, Graph Deep Learning: Methods and Applications (2019). McKelvey School of Engineering Theses & Dissertations. 504.
8. Wu Z, Trevino AE, Wu E, Swanson K, Kim HJ, D'Angio HB, Preska R, Charville GW, Dalerba PD, Egloff AM, Uppaluri R, Duvvuri U, Mayer AT, Zou J. Graph deep learning for the characterization of tumour microenvironments from spatial protein profiles in tissue specimens. Nat Biomed Eng. 2022 Dec;6(12):1435-1448.
Figures