4712
An Automatic Striatum Segmentation Model to Estimate MR Maps for Dopamine Transporter SPECT using Deep Learning1Lauterbur Research Center for Biomedical Imaging, Shenzhen Institute of Advanced Technology, Chinese Academy of Sciences, Shenzhen, China, 2Biomedical Imaging Laboratory (BIG), Department of Electrical and Computer Engineering, Faculty of Science and Technology, University of Macau, Macau SAR, China, 3PET-CT Center, Fujian Medical University Union Hospital, Fuzhou, China, 4Center for Cognitive and Brain Sciences, Institute of Collaborative Innovation, University of Macau, Macau SAR, China
Synopsis
Keywords: AI/ML Software, Parkinson's Disease, Cross-modality, Deep learning, SPECT, Striatum, Segmentation
Motivation: Striatum segmentation on SPECT is necessary to quantify uptake for Parkinson's disease (PD), but is challenging due to the inferior resolution. MRI is the preferred reference for segmentation due to its excellent soft tissue contrast.
Goal(s): This work proposes cross-modality automatic striatum segmentation, estimating MR striatal maps from clinical SPECT using deep learning (DL).
Approach: nnU-Net-based method are implemented and SPECT images are paired with MR-based striatal maps as supervised learning (training:validation:testing = 136:24:40)
Results: The proposed method can segment 4 MR-like individual compartments on clinical SPECT, which is also superior to several traditional and DL methods, both in physical and clinical metrics.
Impact: The proposed DL-based cross-modality striatum segmentation method is feasible for clinical DaT SPECT in PD, and 4 MR-like individual compartments can be obtained to quantify striatal uptake, which is beneficial to the accurate diagnosis and clinical management of PD.
Introduction
Dopamine transporter (DaT) SPECT imaging is useful for the precise diagnosis and clinical management of Parkinson's disease (PD) [1]. Striatum segmentation on DaT SPECT is necessary for uptake analysis of the striatum. However, segmenting striatal structures on SPECT is challenging due to the inferior resolution of images obtained from current general-purpose scanners. On the other hand, MRI provides high spatial resolution and excellent soft tissue contrast for striatum segmentation. However, manual segmentation of MR images is time-consuming and labor-intensive. In recent years, deep learning (DL)-based segmentation methods have been extensively developed for various medical images, and have been preliminarily applied on simulated DaT SPECT [2]. Among the existing DL methods, nnU-Net is a self-configuring method that shows strong generalization performance dedicated for biomedical image segmentation[3]. In this study, we propose a DL-based striatum segmentation method using 3D nnU-Net to estimate MR striatum maps from real clinical DaT SPECT images.Materials and methods
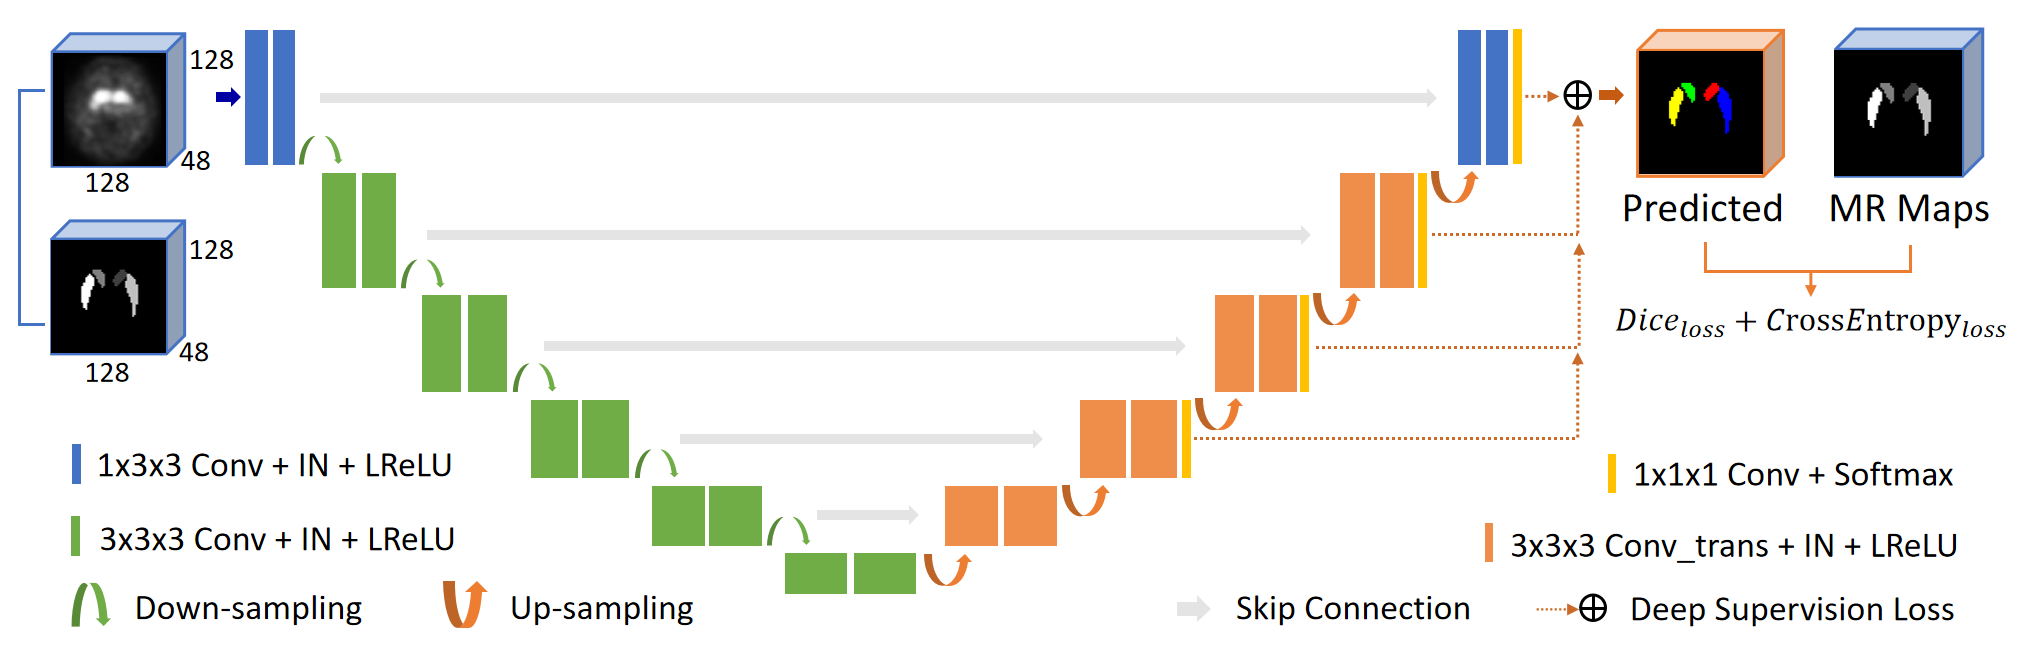
Patient Dataset: 123I-Ioflupane DaT SPECT and T1-weighted MR images from 200 anonymized subjects (152 PD, 48 healthy controls, HC) were analyzed from the Parkinson's Progression Markers Initiative (PPMI) database (http://www.ppmi-info.org, [4]). The patient data were divided for training, validation and testing (136: 24: 40), while keeping a similar proportion (~3:1) of PD and HC in each group. DaT SPECT and MR images are registered, and 4 individual striatal compartments, i.e., the left caudate (LC), right caudate (RC), left putamen (LP) and right putamen (RP), are manually segmented from MR images by a nuclear medicine physician as the gold standard maps. All image matrix sizes are 128×128×48, and the voxel size is 1×1×1 mm3.Method Implements: The basic architecture of 3D nnU-Net is the same as that of standard 3D U-Net (Fig. 1). nnU-Net can configure appropriate network parameters according to a specific task to achieve the optimal segmentation model, e.g., data preprocessing like intensity normalization and image resampling, and hyperparameters like number of layers and feature size. Dice and cross-entropy loss functions and various data augmentations like rotations, scaling and Gaussian blur, are used during training. SPECT brain images are input to the model, paired with 4 individual MR-based striatal maps as supervised learning. Furthermore, a standard 3D U-Net is also implemented for comparison. We implement the networks using PyTorch, which runs on an NVIDIA RTX A6000 GPU. The Adam optimizer is used to optimize the segmentation model with an initial learning rate of 0.01, and the model is run up to 1000 epochs. The training times for nnU-Net and U-Net are 16.5 and 8 hours, respectively. The proposed method is also compared to the commonly used SPECT thresholding-based segmentation (THR-Seg) on 40 test datasets. The threshold is set to be 67% of the maximum intensity of the SPECT images for each subject [5].
Data analysis: Physical metrics, i.e., Dice [6], Hausdorff distance (HD) 95% [7] and relative volume difference (RVD) [8], were employed to evaluate the segmentation performance between segmented striatal maps of different algorithms and MR labels. For the clinical evaluation, the striatal binding ratio (SBR) was used to quantify the binding of 123I-Ioflupane in the striatum [9]. The striatal asymmetry index (ASI) was used to assess the asymmetry of uptake between the left and right striatum [10].
Results
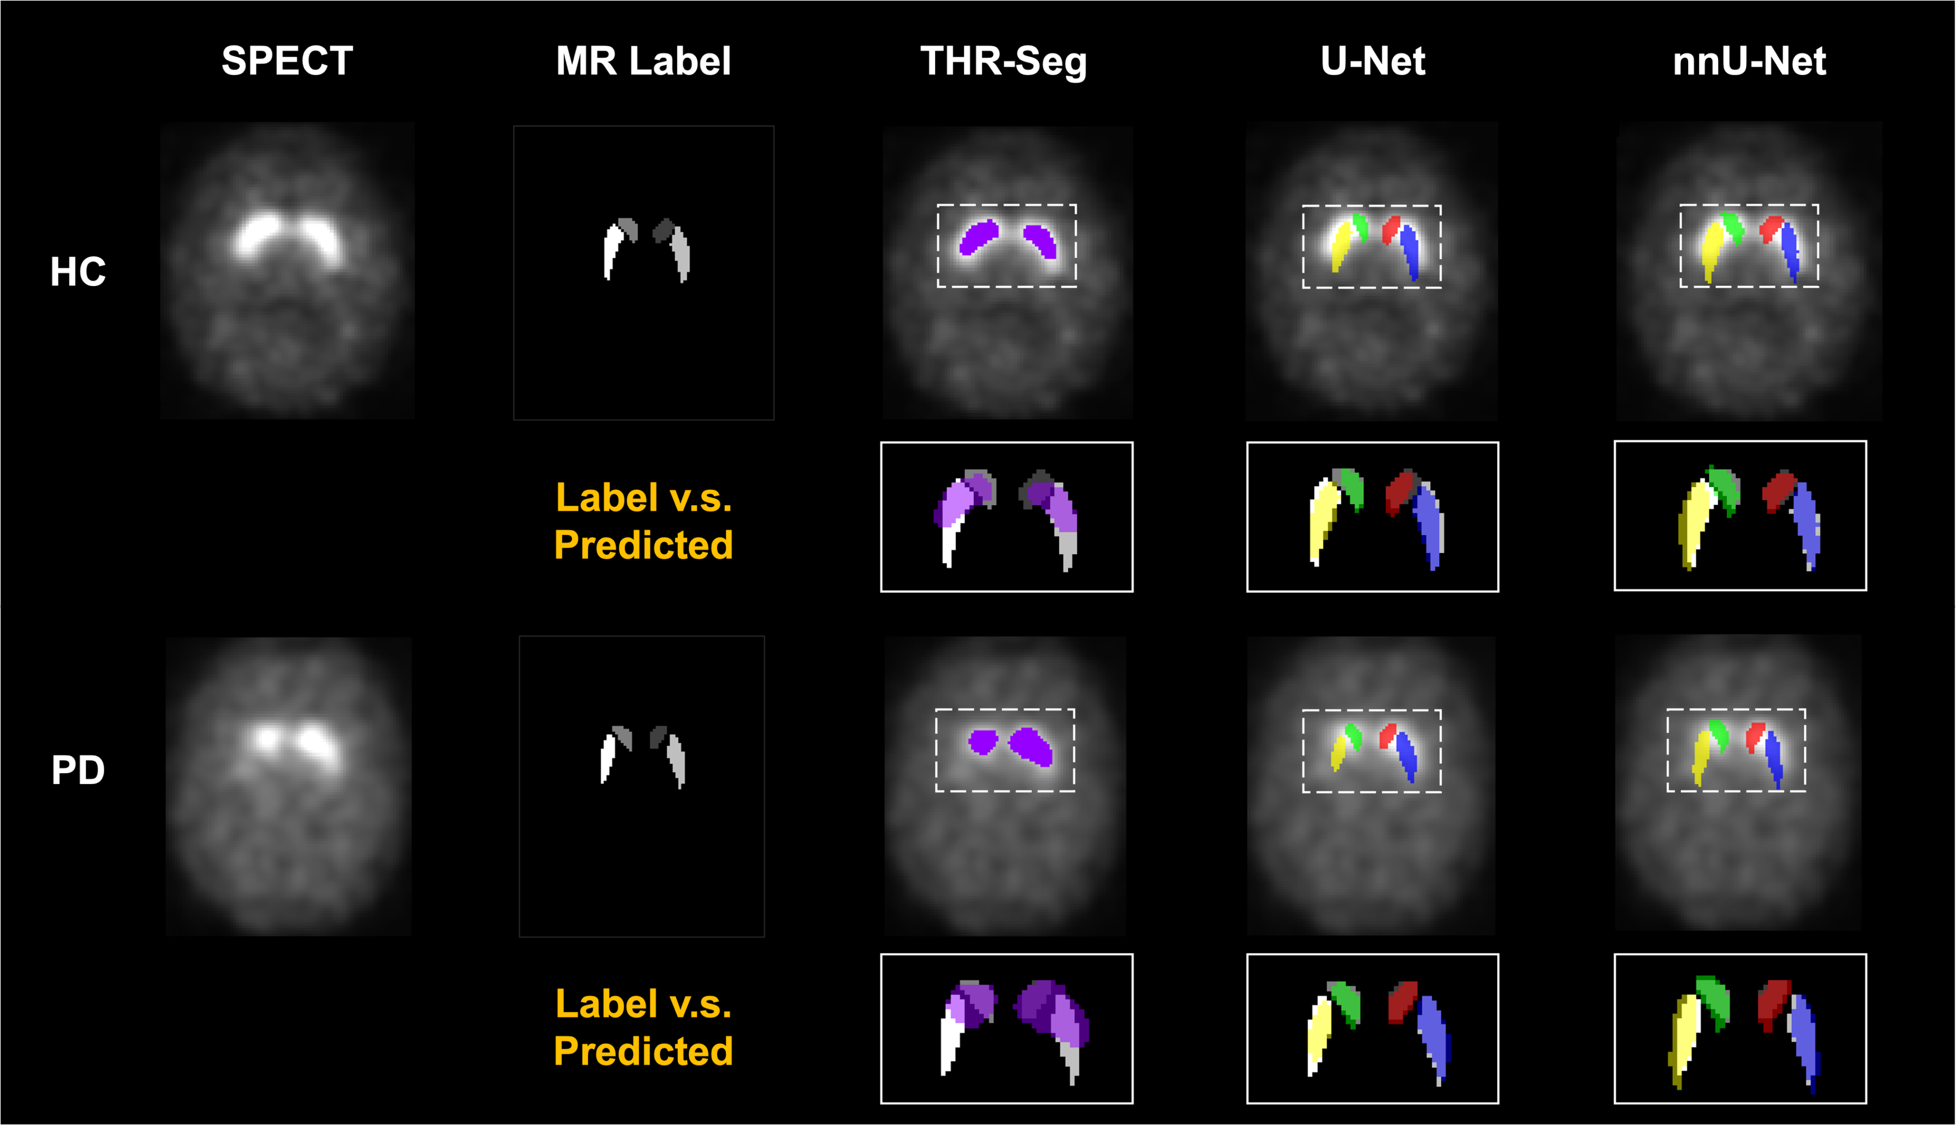
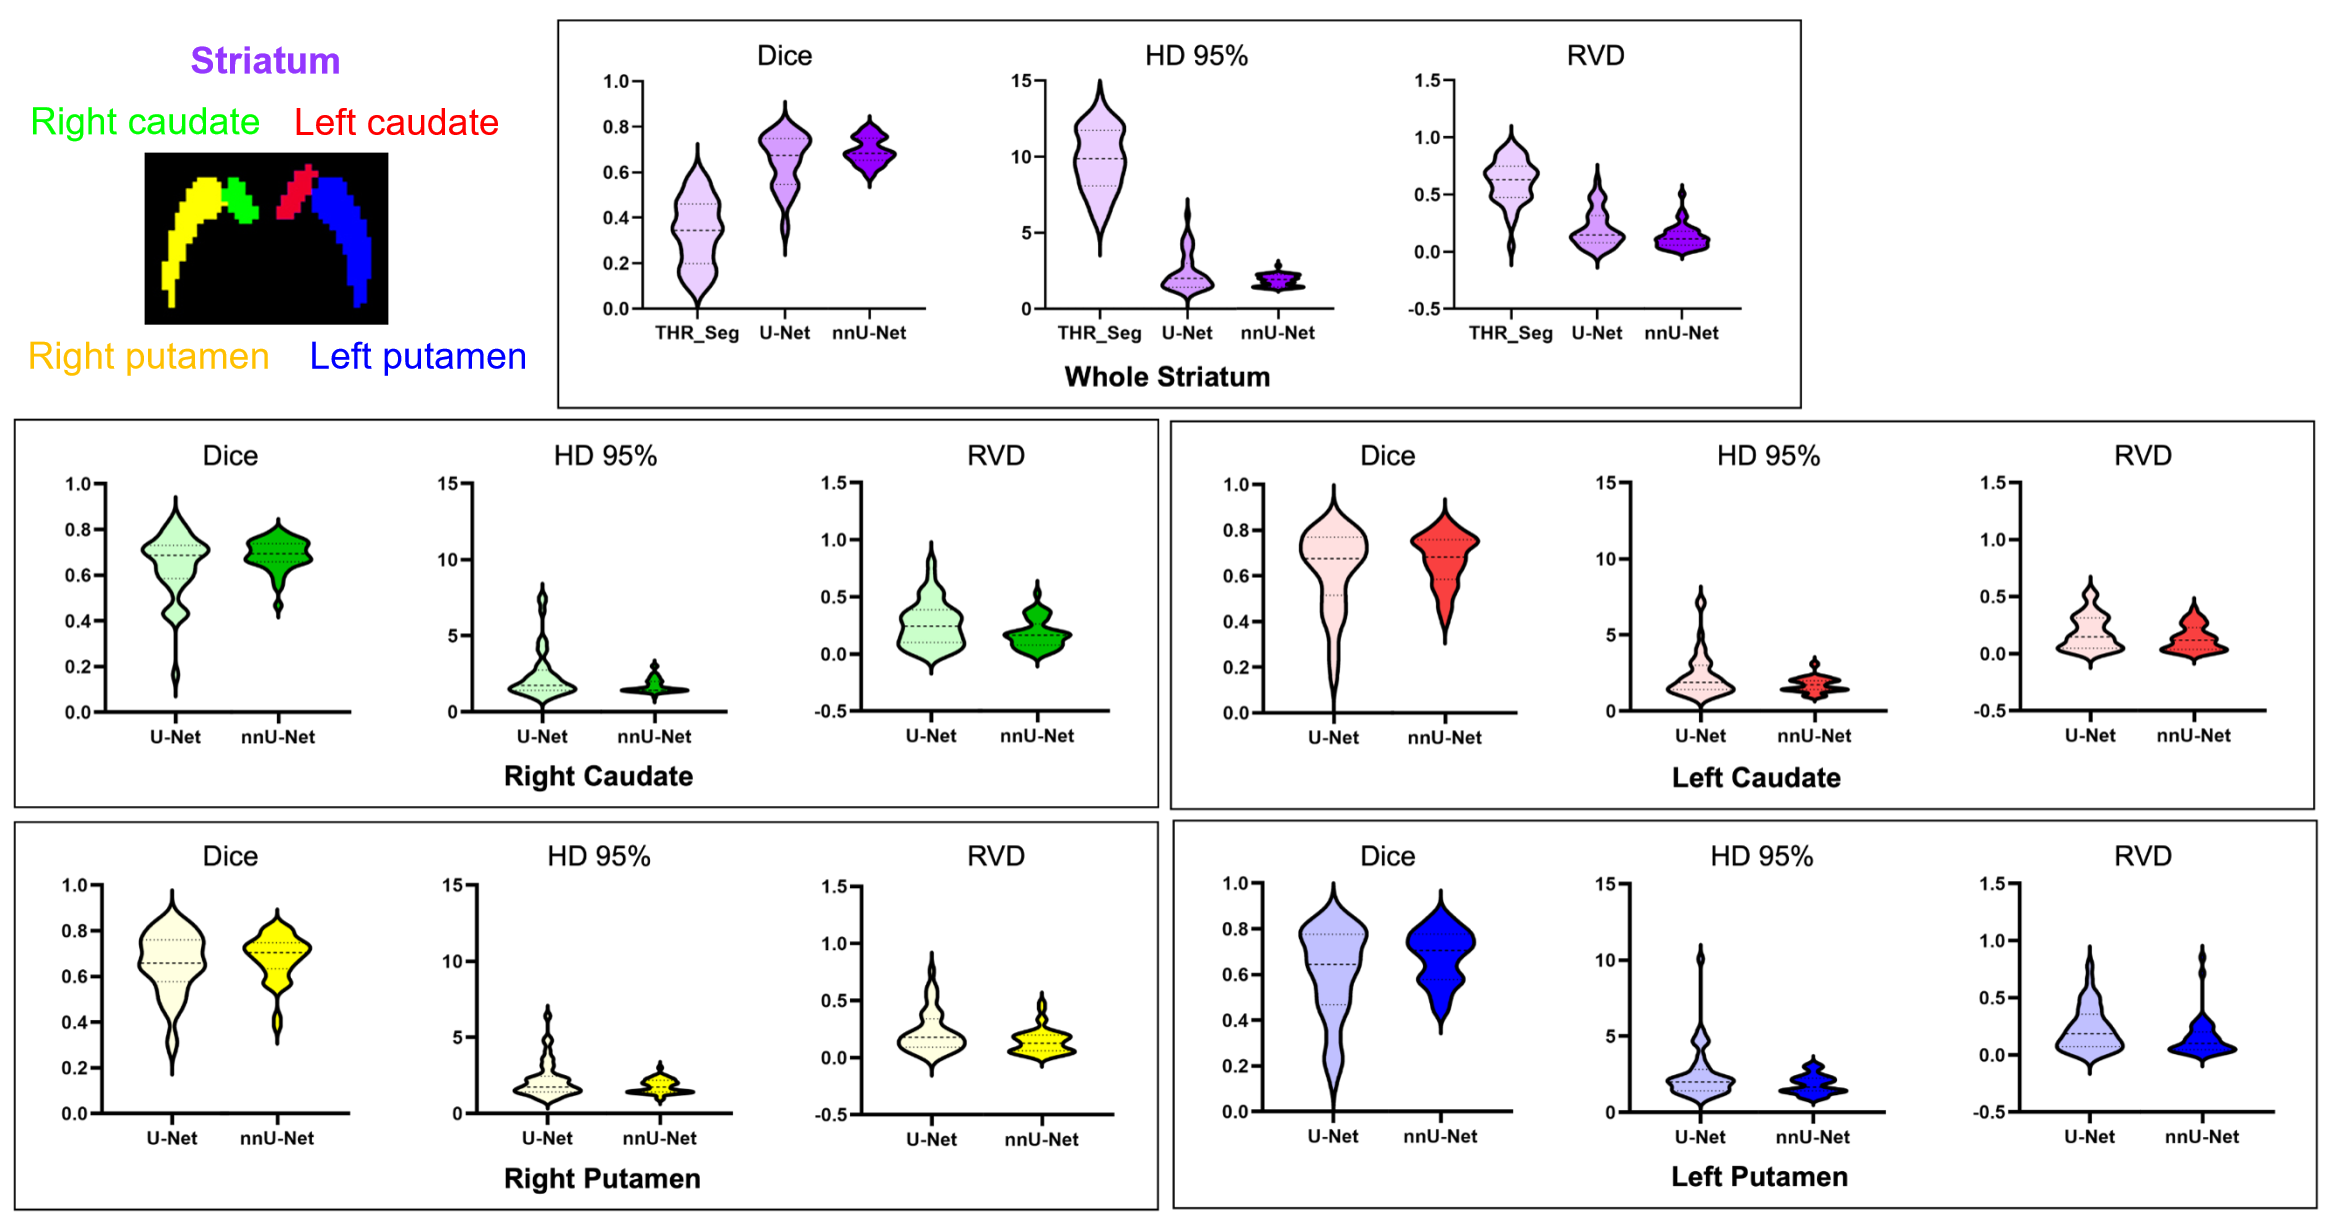
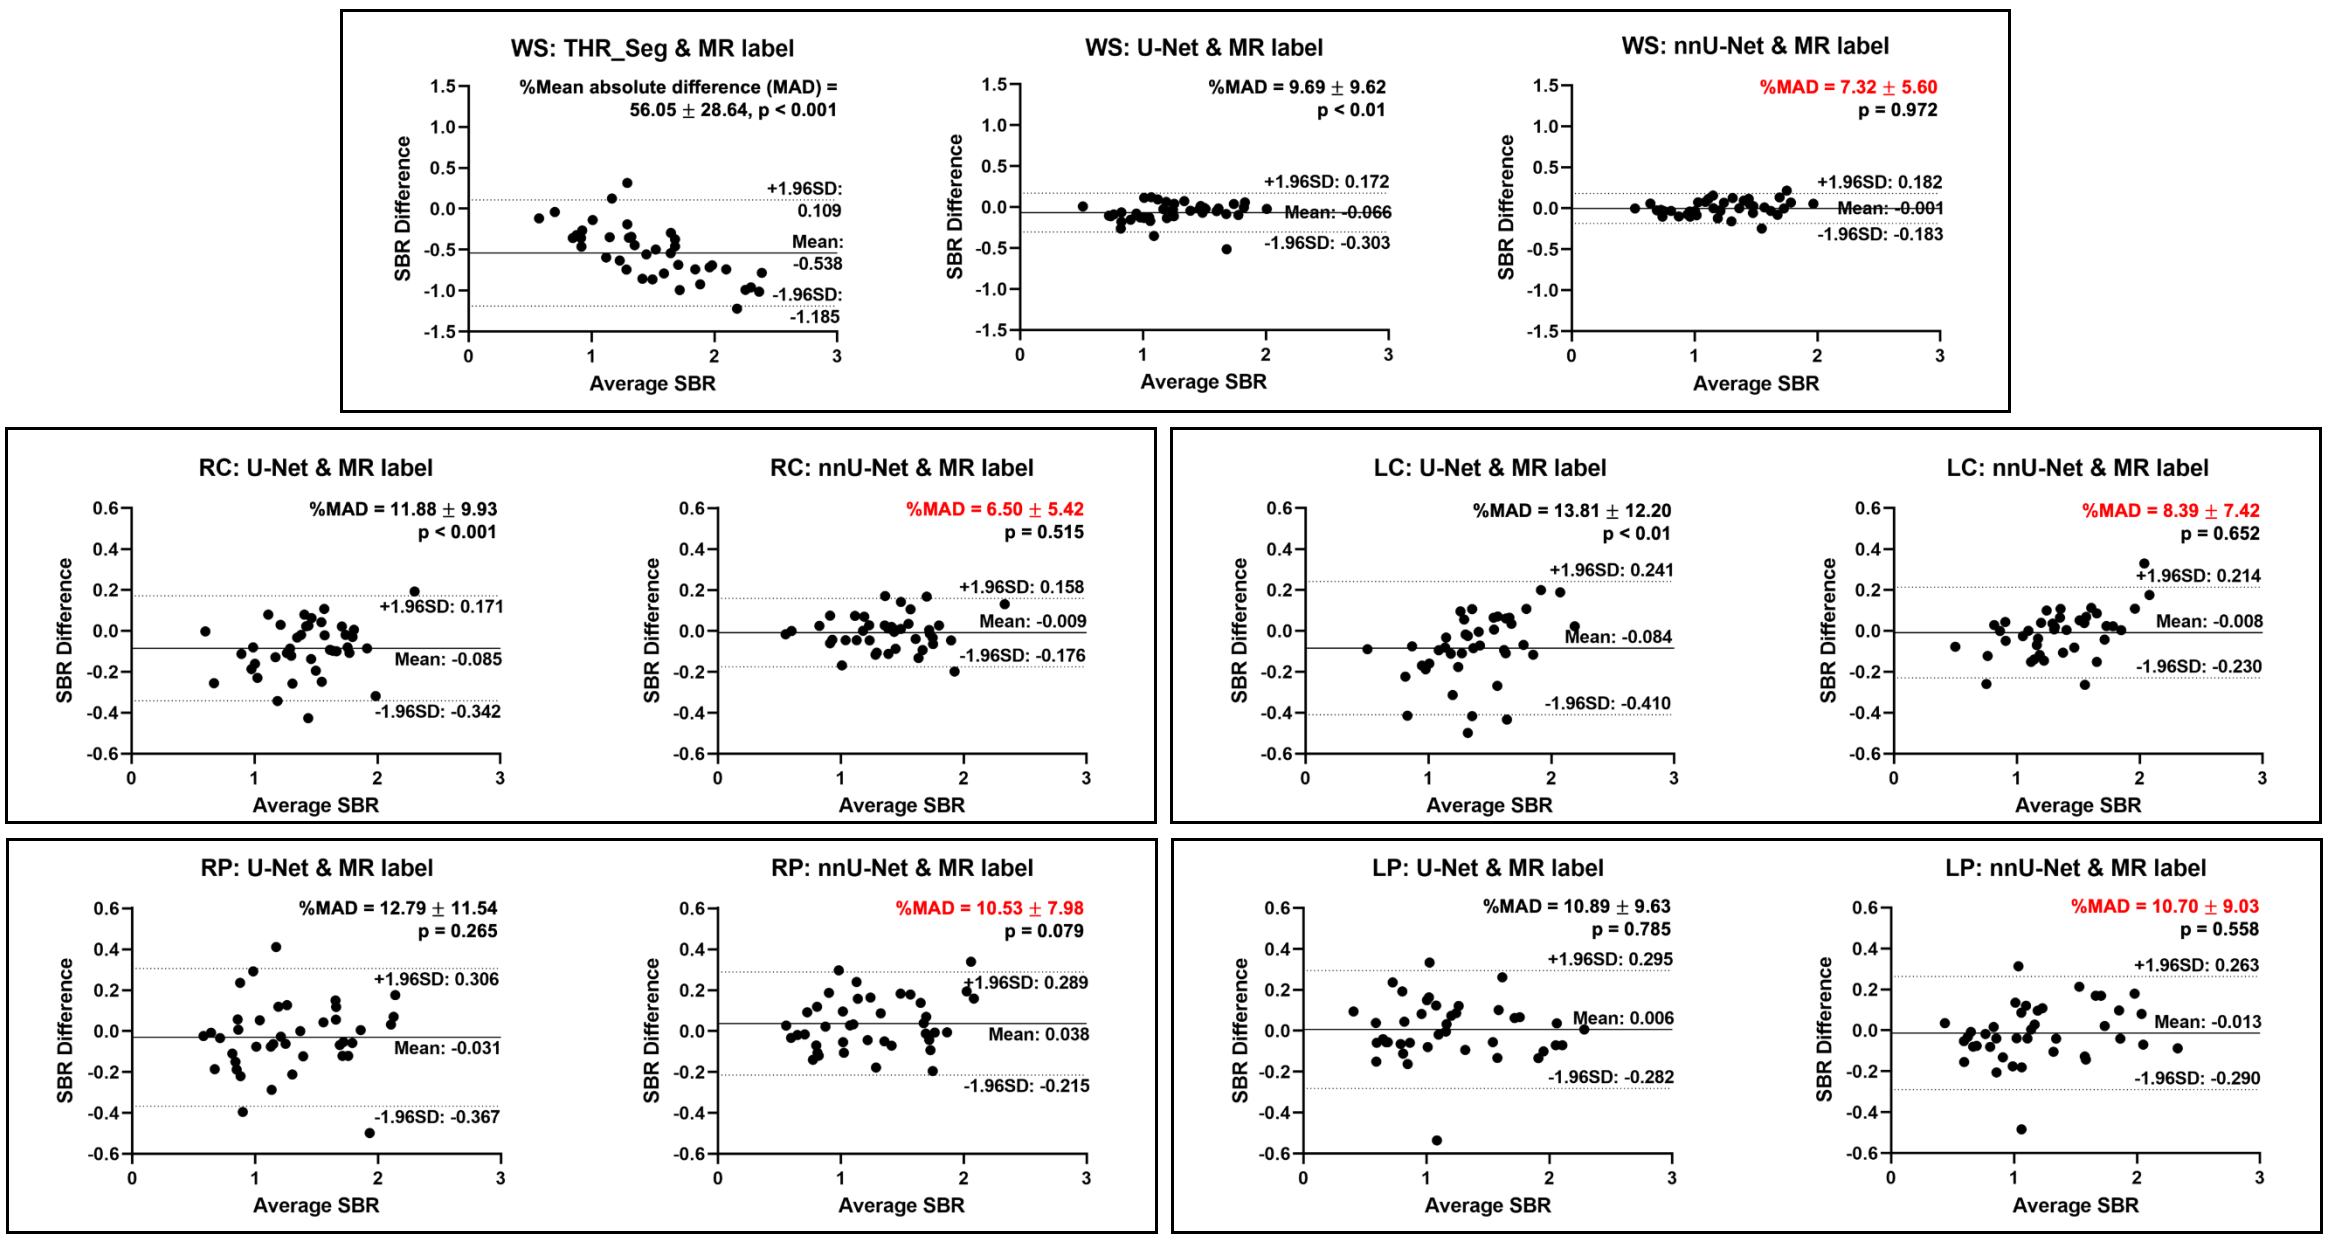
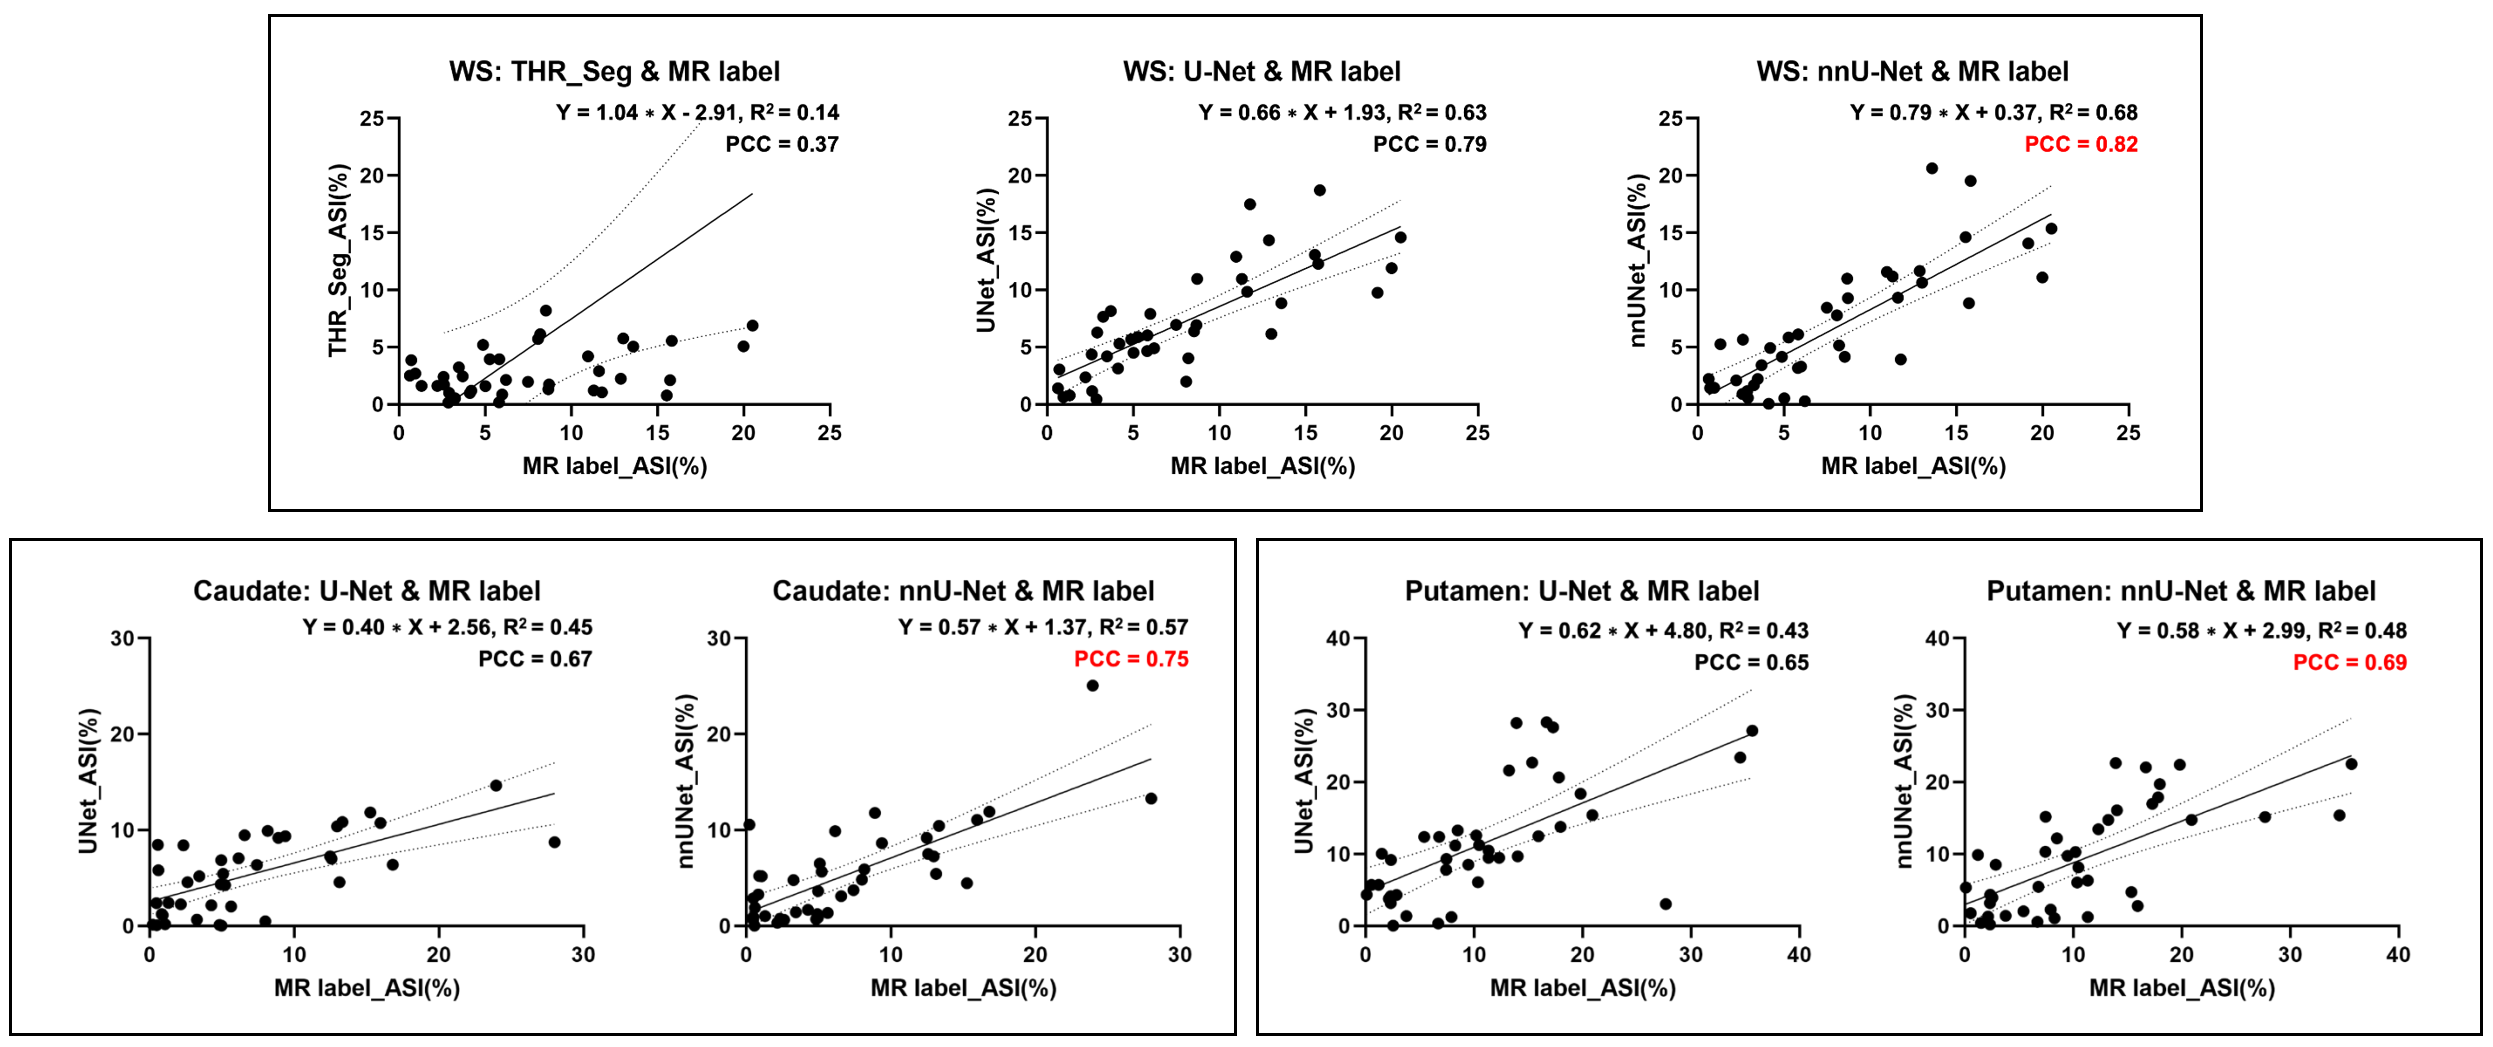
Sample segmentation results from 1 HC and 1 PD subject are shown in Fig. 2. The caudate and putamen cannot be separated in THR-Seg, while all 4 compartments can be well separated in DL-based methods. Fig. 3 shows violin plots of Dice, HD 95% and RVD results on 40 tested subjects. nnU-Net achieves better Dice (~0.7), HD 95% (~1.8) and RVD (~0.1) for all individual striatal compartments and the whole striatum than others, while indices for individual striatal compartments cannot be obtained by THR-Seg. Fig. 4 and Fig. 5 analyze the consistency of SBR and the correlation of ASI between MR labels and maps segmented by different methods using Bland‒Altman plots and scatter plots. For the whole striatum, the proposed method yields stronger SBR consistency (mean difference, 0.001) and ASI correlation (Pearson correlation coefficient, 0.82) than THR-Seg and U-Net. For the individual compartments, nnU-Net also achieves better consistency and correlation than the others.Discussion and conclusion
Our proposed automatic striatum segmentation method can segment 4 MR-like individual compartments on clinical DaT SPECT for PD based on evaluation on PPMI multicenter data. The proposed nnU-Net-based method is superior to the standard U-Net and SPECT-based THR-Seg methods, both in physical (Dice, HD 95% and RVD) and clinical metrics (SBR and ASI). The proposed DL method is promising for clinical DaT SPECT segmentation.Acknowledgements
This work was supported by a Collaborative Research Grant (MYRG-CRG2022-00011-ICMS) from the University of Macau, the National Natural Science Foundation of China (82372038), the Shenzhen Excellent Technological Innovation Talent Training Project of China (RCJC20200714114436080), the Shenzhen Science and Technology Program of China (JCYJ20220818101804009) and the Key Laboratory for Magnetic Resonance and Multimodality Imaging of Guangdong Province (2023B1212060052).References
[1] K. Tsang and R. Walker, "Dopamine transporter single photon emission computed tomography (DaT-SPECT) use in the diagnosis and clinical management of parkinsonism: an 8-year retrospective study," Journal of Neurology, pp. 1-9, 2023.
[2] Z. Liu et al., "A tissue‐fraction estimation‐based segmentation method for quantitative dopamine transporter SPECT," Medical physics, vol. 49, no. 8, pp. 5121-5137, 2022.
[3] F. Isensee, P. F. Jaeger, S. A. Kohl, J. Petersen, and K. H. Maier-Hein, "nnU-Net: a self-configuring method for deep learning-based biomedical image segmentation," Nature methods, vol. 18, no. 2, pp. 203-211, 2021.
[4] K. Marek et al., "The Parkinson progression marker initiative (PPMI)," Progress in neurobiology, vol. 95, no. 4, pp. 629-635, 2011.
[5] R. Prashanth, S. D. Roy, P. K. Mandal, and S. Ghosh, "High-accuracy classification of parkinson's disease through shape analysis and surface fitting in 123I-Ioflupane SPECT imaging," IEEE journal of biomedical and health informatics, vol. 21, no. 3, pp. 794-802, 2016.
[6] A. A. Taha and A. Hanbury, "Metrics for evaluating 3D medical image segmentation: analysis, selection, and tool," BMC medical imaging, vol. 15, no. 1, pp. 1-28, 2015.
[7] D. P. Huttenlocher, G. A. Klanderman, and W. J. Rucklidge, "Comparing images using the Hausdorff distance," IEEE Transactions on pattern analysis and machine intelligence, vol. 15, no. 9, pp. 850-863, 1993.
[8] Y. Xu et al., "PA‐ResSeg: A phase attention residual network for liver tumor segmentation from multiphase CT images," Medical Physics, vol. 48, no. 7, pp. 3752-3766, 2021.
[9] F. Lanfranchi et al., "Different z-score cut-offs for striatal binding ratio (SBR) of DaT SPECT are needed to support the diagnosis of Parkinson’s Disease (PD) and dementia with Lewy bodies (DLB)," European Journal of Nuclear Medicine and Molecular Imaging, vol. 50, no. 4, pp. 1090-1102, 2023.
[10] C.-Y. Chien, S.-W. Hsu, T.-L. Lee, P.-S. Sung, and C.-C. Lin, "Using artificial neural network to discriminate Parkinson’s disease from other Parkinsonisms by focusing on putamen of dopamine transporter SPECT images," Biomedicines, vol. 9, no. 1, p. 12, 2020.
Figures