4711
CNN-based Automated Pipeline for Accurate Computation of Magnetic Resonance Parkinsonism’s Index Measurements1Siemens Healthineers India, Bengaluru, India, Bengaluru, India, 2International Institute of Information Technology Bangalore, Bengaluru, India, 3Advanced Clinical Imaging Technology, Siemens Healthineers International AG, Lausanne, Switzerland, 4LTS5, École Polytechnique Fédérale de Lausanne, Lausanne, Switzerland, 5Department of Diagnostic and Interventional Radiology, Lausanne University Hospital and University of Lausanne, Lausanne, Switzerland, 6Leenaards Memory Centre, Lausanne University Hospital and University of Lausanne, Lausanne, Switzerland, 7Singapore General Hospital, Singapore, Singapore, 8Duke-NUS Medical School, Singapore, Singapore, 9National Institute of Mental Health and Neurosciences, Bengaluru, India, 10Division of Radiology, Geneva University Hospitals, Geneva, Switzerland
Synopsis
Keywords: Diagnosis/Prediction, Neurodegeneration, MRPI, Progressive supranuclear palsy, Parkinsonism Index, CAD
Motivation: Magnetic resonance parkinsonism index (MRPI) has shown promising results in differentiating progressive supranuclear palsy from idiopathic Parkinson’s disease and the Parkinson variant of multiple system atrophy (MSA-P).
Goal(s): In this work, we propose a fully automated pipeline to calculate MRPI using a convolutional neural network (CNN). This can be a time-saving tool in making diagnoses in clinically ambiguous cases.
Approach: Our method utilizes registration and deep learning-based segmentation techniques to extract relevant measurements from T1 weighted MRI images (T1w).
Results: Experimental results demonstrated the robustness of our approach and its generalizability across different clinical settings.
Impact: Automating the measurement of MRPI components with a deep learning based algorithm can help providing objective and reproducible measures. It may be beneficial for differential diagnosis of patients with Parkinsonian syndromes with significant savings in reporting time.
Introduction
Parkinson’s disease (PD) is a chronic degenerative disorder that affects dopaminergic neurons in the central nervous system. The magnetic resonance parkinsonism index (MRPI [1] and its recent revision MRPI 2.0 [2]) is a promising biomarker for differentiating progressive supranuclear palsy (PSP) and MSA-P from idiopathic PD [1,2] or from corticobasal degeneration (CBD) [3]. Calculation of MRPI traditionally relies on manual assessment by radiologists, which is time-consuming and influenced by inter/intra-rater variability [4]. Many automated methods were proposed using conventional [2,5,6,7] and deep learning (DL) algorithms [8]. In fact, accurate delineation of the involved brain regions is complex, and small inaccuracies can result in drastic changes in calculated MRPI. To mitigate these drawbacks, we propose an alternative DL pipeline for automating MRPI-related measures, further referred to “Quantitative Brain Assessment Toolkit (QBAT, v2.1.0)” research application. (Siemens Healthineers, Erlangen, Germany)Material and Methods
2.1 Training PopulationA total of N=290 T1w 3D 3T MRI scans were collected for training the algorithm. Out of these, 203/290 (115 females, mean age 73.3±8.0) were collected from the ADNI database [9]. These consisted of 23 Alzheimer’s disease patients, 86 multiple cognitive impairment patients, and 94 healthy controls (HC). The remaining 87/290 (46 females, mean age 66.02±13.92) were consecutive patients undergoing clinical MRI for workup of cognitive decline (January-December 2019) at a memory clinic using protocols following ADNI recommendations closely.
2.2 Preprocessing
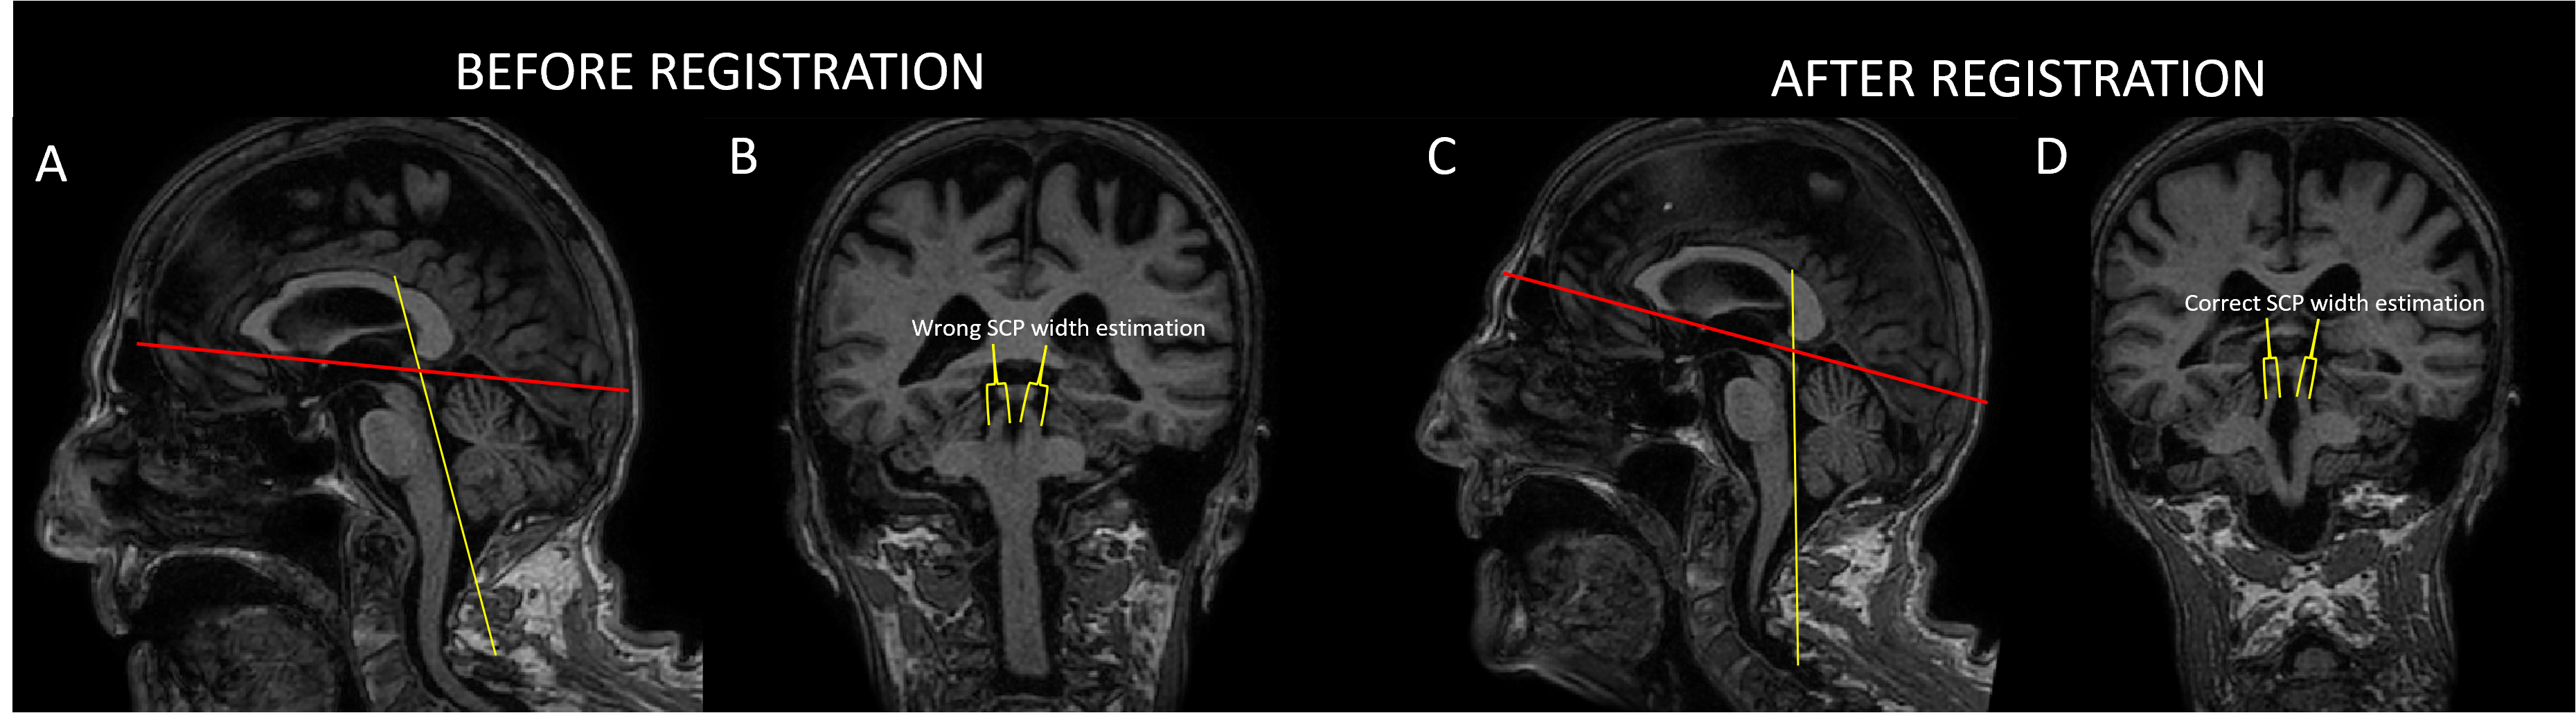
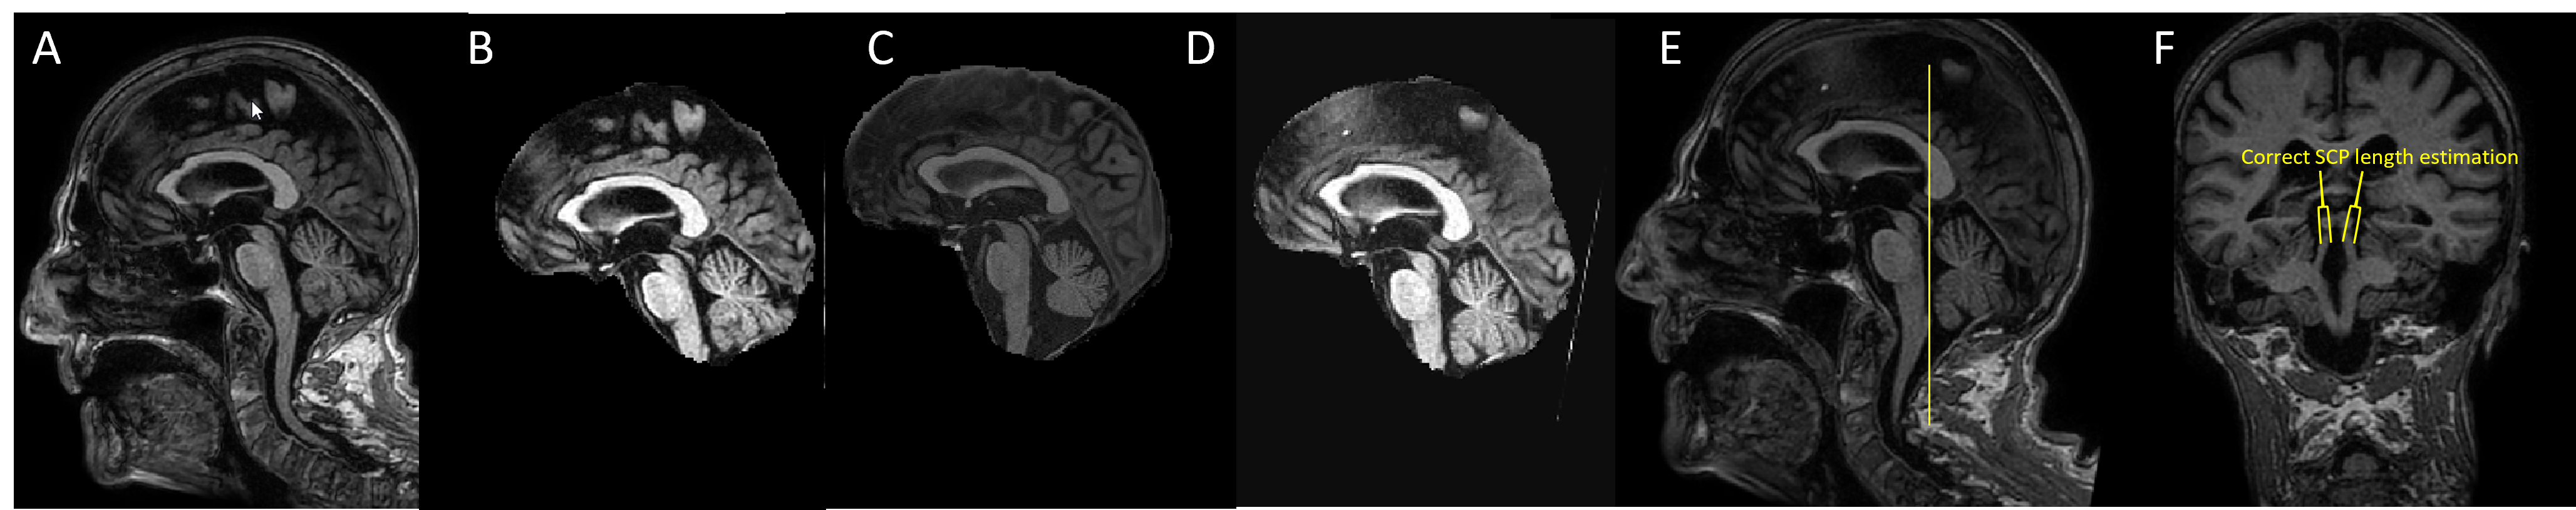
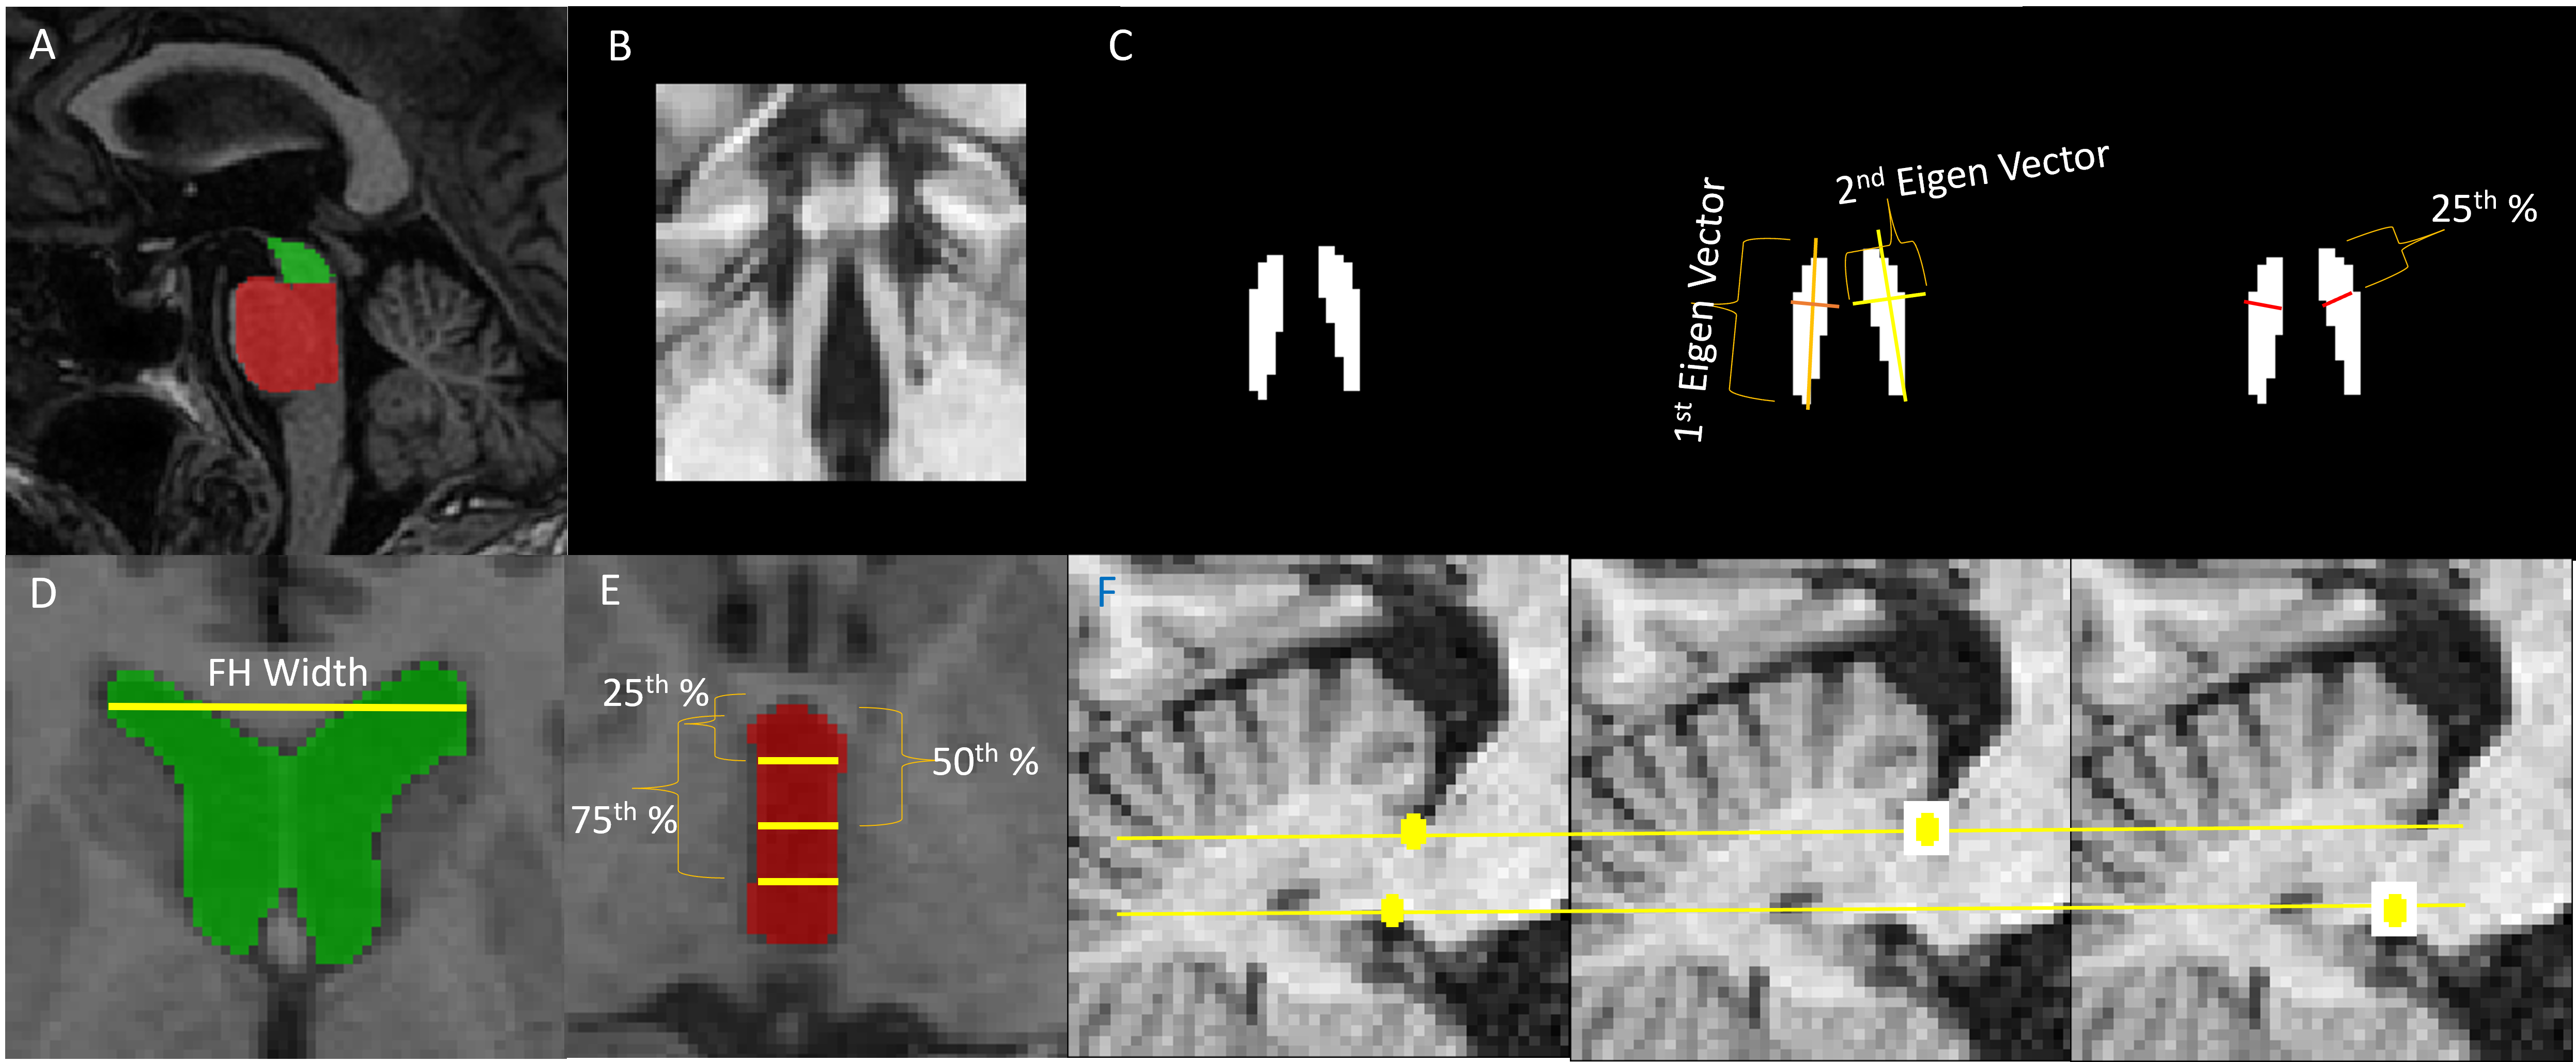
To obtain precise MRPI measurements, it is essential to align the axial orientation of the input T1w images to the anterior-commissure posterior-commissure plane (AC-PC plane), as demonstrated in Figure 1. To achieve this, we first skull-stripped the T1w volume with an in-house research application [10] and then registered [11] the skull-stripped volume to a single-subject template as shown in Figure 2. This template contains MPRI landmarks and surfaces (subsequently called components) labeled by expert radiologists in a consensual fashion [1,2]. The components are i) mean bilateral middle/superior cerebellar peduncle (MCP/SCP) diameters, ii) mid-sagittal pons and midbrain surface areas, iii) third ventricle, and iv) frontal horn widths. We took these segmented structures as starting point to localize/extract 3D patches of varying sizes (48x48x12 to 96x144x12 voxels) around corresponding regions.
2.3 Model Architecture/Training/Inference
To segment MRPI-related components from these patches, we used individual 3D-CNNs. We adopted the 3D-attention-UNet [12] from Monai [13] to segment each region. Figure 3 illustrates the segmentation and computation of each component. Data augmentations included flip/rotation/scaling/intensity scale/intensity shift/bias correction/Gaussian smooth, and Gaussian noise. Each patch was z-score normalized. For training, we used Xavier initialization [14] and the combo loss [15]. All were trained for 200 epochs with batch size=16. During inference, we fed the 3D patches to the trained CNNs.
2.4 Validation
To validate our pipeline, we ran three experiments:
1. Comparison manual/automated: for N=30 patients undergoing 3T-MRI for workup of clinical decline at 3 different sites following ADNI T1-weighted protocol guidelines, a senior MR scientist manually drew MRPI components. Using a MeVisLab-based annotation tool, this took 9 mins/subject, on average. Then, we compared automated and manual components with a Wilcoxon signed-rank test [16].
2. Comparison manual/automated: for N=30 separate patients with vascular cognitive impairment (from same memory clinic of training dataset), a medical student drew manual MRPI components. This took 17 mins/subject. Then, we repeated the Wilcoxon test.
3. Variability across hospitals: our pipeline was tested on N=85 separate patients from three hospitals in India (hospital A: N=17 HC; hospital B: N=24 HC, hospital C: N=25 HC and N=19 PSP). Variations across hospitals were assessed with Wilcoxon tests.
Results
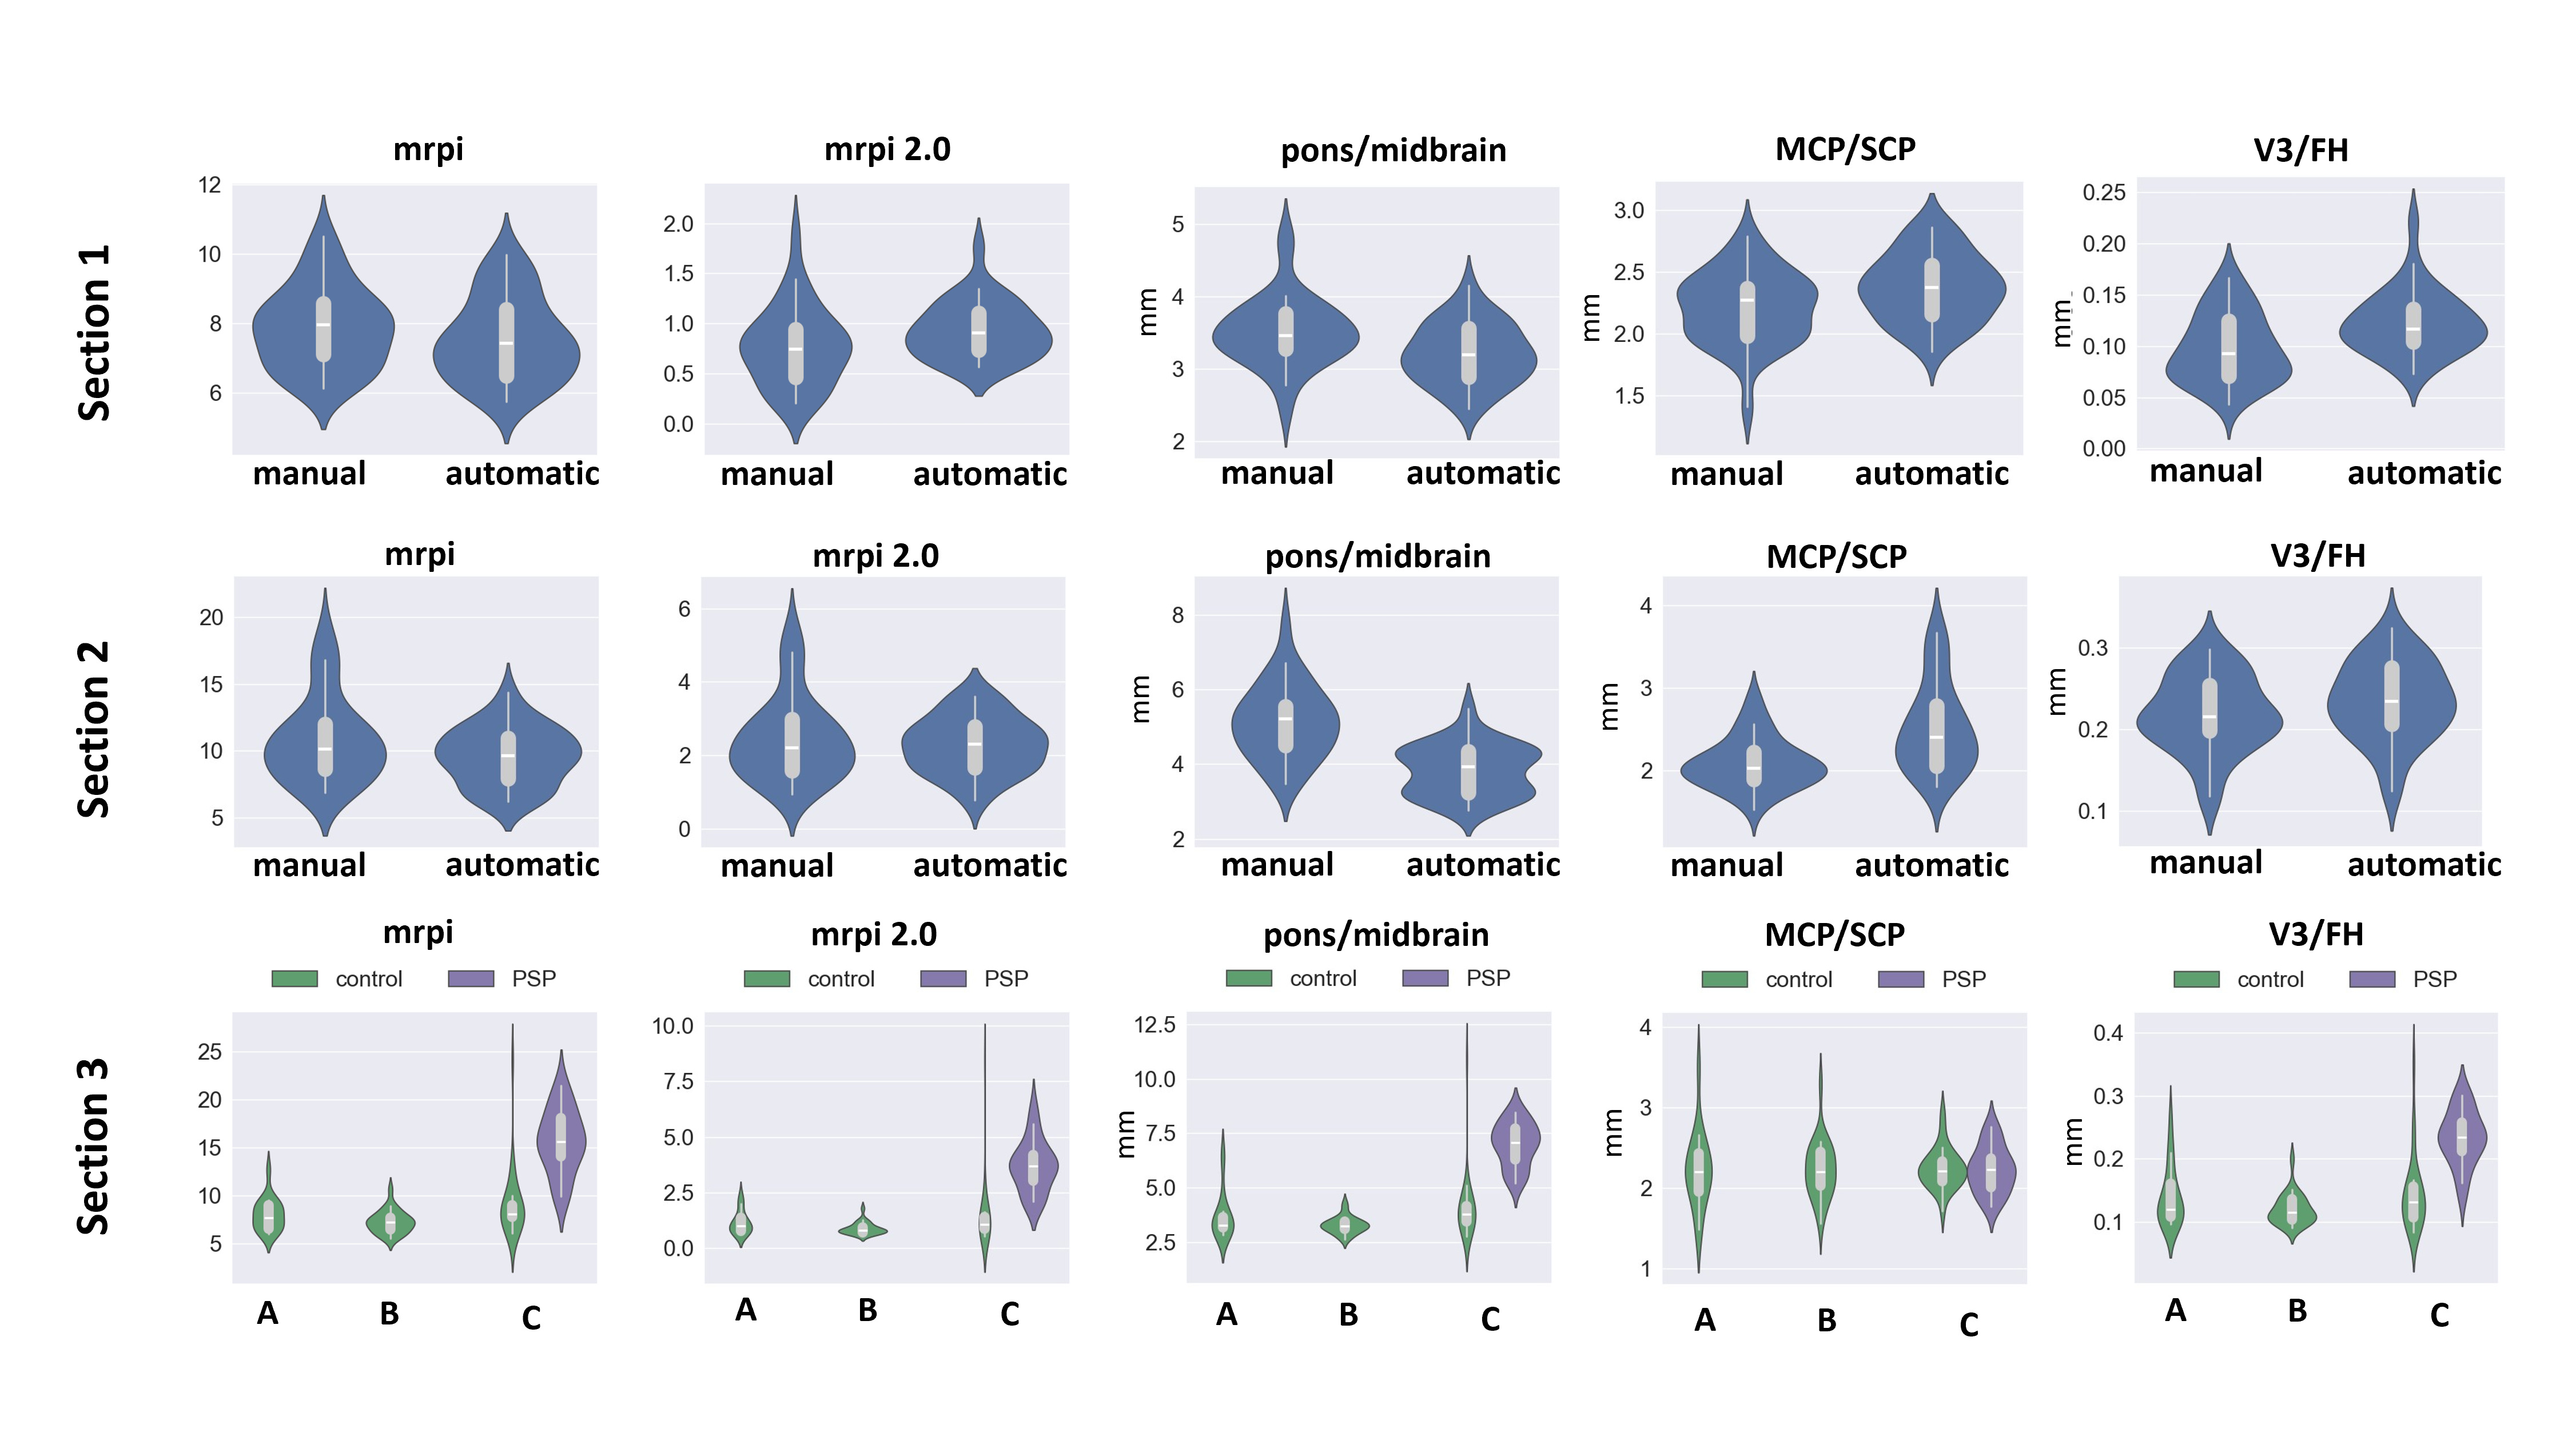
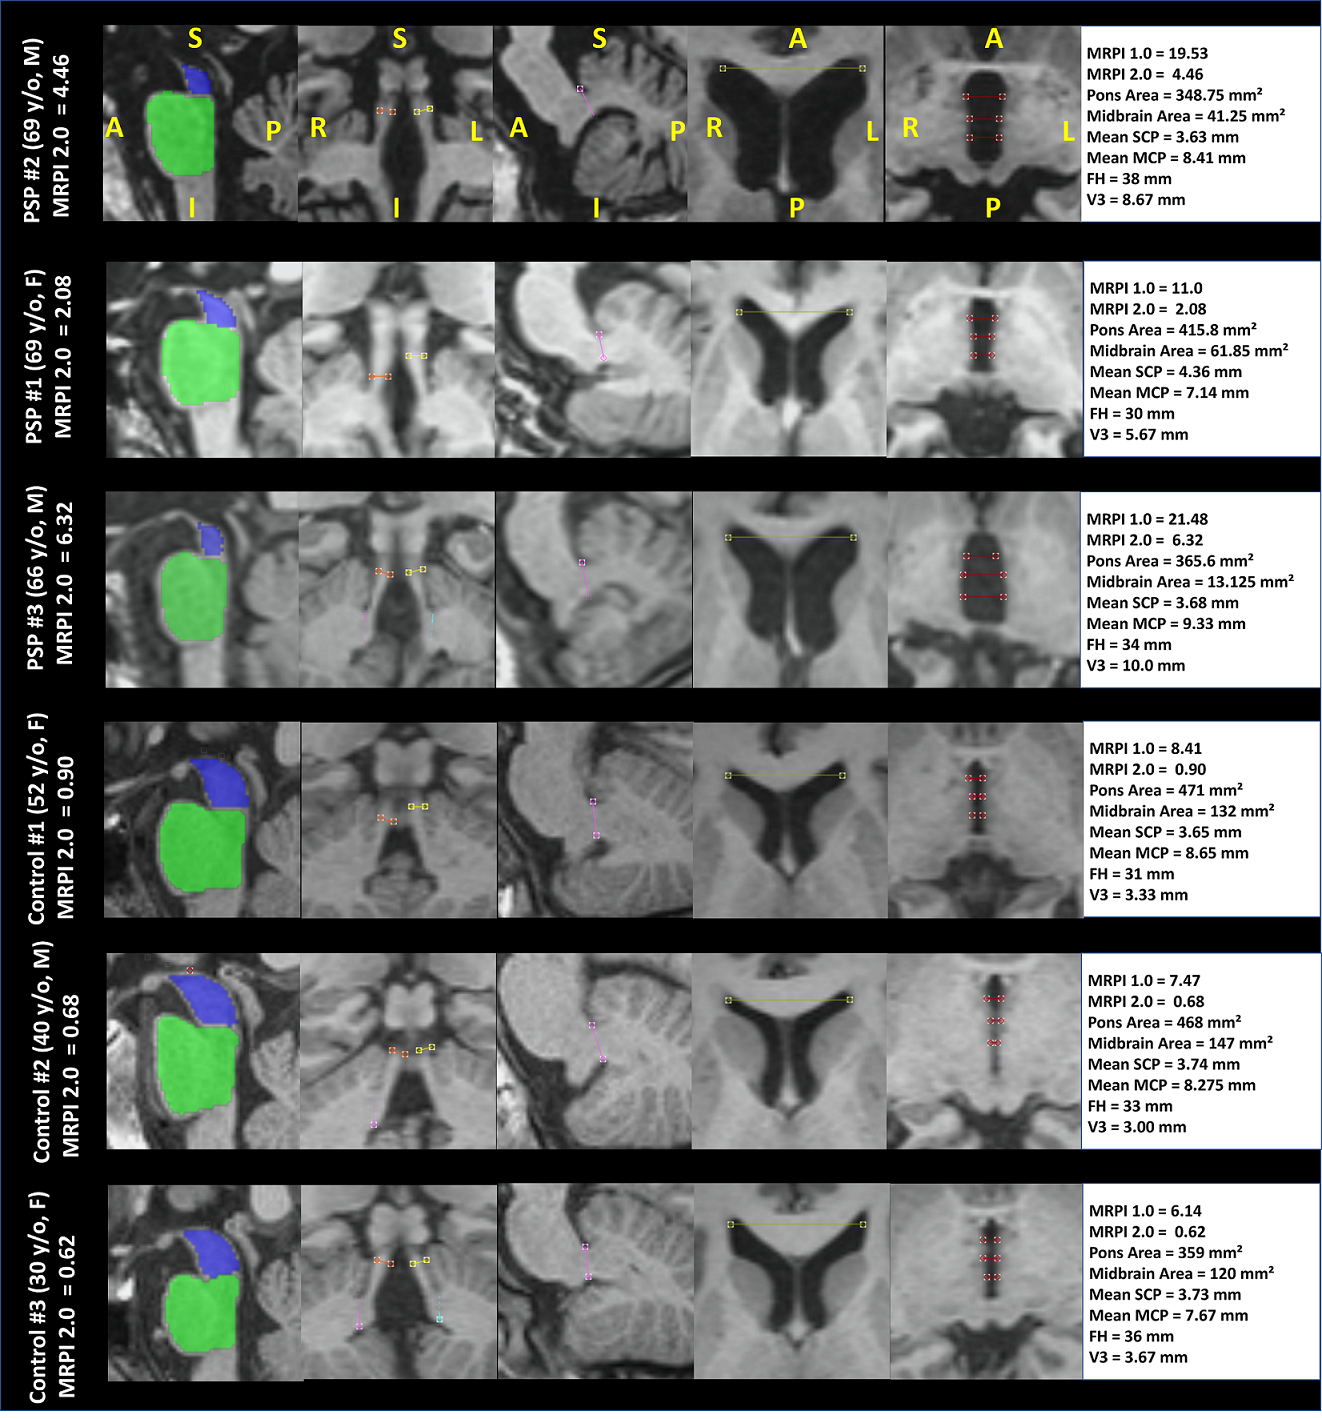
When comparing manual/automated components (experiments 1 and 2), we found 4/5 components to be significantly similar ($$$p>0.05$$$), while pons-to-midbrain ratio showed significant difference ($$$p<0.01$$$ experiment 1, $$$p<0.01$$$ experiment 2). Figure 4 ( Section 1 and 2), illustrates the distributions for the two methods (manual vs. automated) for some MRPI components while Figure 4 (Section 3) shows the automated components for the multicentric datasets (N=85). Median values for all healthy controls (Hospitals A, B, C) are within the expected ranges reported in [2]. The MRPI 2.0 for the PSP patients of hospital C was significantly higher with respect to controls ($$$p<0.01$$$), as expected. Figure 5 illustrates the MRPI components of our pipeline for 3 PSP and 3 HC of hospital C. QBAT took ~58s per case (intel i7 processor).Discussion and Conclusion
We present an automated CNN-based pipeline for the computation of MRPI-related components. Our method is comparable to manual annotations, able to generalize across hospitals, and shows promise to discriminate PSP from HC. Future work should include validations with larger cohorts, ideally comprising other Parkinsonian syndromes.Acknowledgements
No acknowledgement found.References
[1] Quattrone, Aldo, et al. "MR imaging index for differentiation of progressive supranuclear palsy from Parkinson disease and the Parkinson variant of multiple system atrophy." Radiology 246.1 (2008): 214-221.
[2] Quattrone, Aldo, et al. "A new MR imaging index for differentiation of progressive supranuclear palsy-parkinsonism from Parkinson's disease." Parkinsonism & related disorders 54 (2018): 3-8.
[3] Illán-Gala, Ignacio, et al. "Diagnostic accuracy of magnetic resonance imaging measures of brain atrophy across the spectrum of progressive supranuclear palsy and corticobasal degeneration." JAMA network open 5.4 (2022): e229588-e229588.
[4] Shih, Yao-Chia, et al. "Automated Magnetic Resonance Parkinsonism Index: Test-Retest Reliability and 10 Year Changes in Aging and Parkinson’s Disease."
[5] Scheffler, Max, et al. "A method for fast automated assessment of the magnetic resonance parkinsonism index." Neuroradiology 62.6 (2020): 747-751.
[6] Nigro, Salvatore, et al. "Magnetic Resonance Parkinsonism Index: diagnostic accuracy of a fully automated algorithm in comparison with the manual measurement in a large Italian multicentre study in patients with progressive supranuclear palsy." European radiology 27 (2017): 2665-2675.
[7] Sjöström, Henrik, et al. "Automated brainstem volumetry can aid in the diagnostics of parkinsonian disorders." Parkinsonism & Related Disorders 79 (2020): 18-25.
[8] Sun, Fuhai, et al. "Accurate measurement of magnetic resonance parkinsonism index by a fully automatic and deep learning quantification pipeline." European Radiology (2023): 1-10.
[9] Wyman, Bradley T., et al. "Standardization of analysis sets for reporting results from ADNI MRI data." Alzheimer's & Dementia 9.3 (2013): 332-337.
[10] Venkategowda, Punith B., et al. "Retrofitting a brain segmentation algorithm with deep learning techniques: validation and experiments." Proceedings of the International Society of Magnetic Resonance Imaging 3566 (2020).
[11] Klein, Stefan, et al. "Elastix: a toolbox for intensity-based medical image registration." IEEE transactions on medical imaging 29.1 (2009): 196-205.
[12] Oktay, Ozan, et al. "Attention u-net: Learning where to look for the pancreas." arXiv preprint arXiv:1804.03999 (2018).
[13] Cardoso, M. Jorge, et al. "Monai: An open-source framework for deep learning in healthcare." arXiv preprint arXiv:2211.02701 (2022).
[14] Glorot, Xavier, and Yoshua Bengio. "Understanding the difficulty of training deep feedforward neural networks." Proceedings of the thirteenth international conference on artificial intelligence and statistics. JMLR Workshop and Conference Proceedings, 2010.
[15] Taghanaki, Saeid Asgari, et al. "Combo loss: Handling input and output imbalance in multi-organ segmentation." Computerized Medical Imaging and Graphics 75 (2019): 24-33.
[16] Wilcoxon, Frank. "Individual comparisons by ranking methods." Breakthroughs in Statistics: Methodology and Distribution. New York, NY: Springer New York, 1992. 196-202.
Figures