4710
Automated Deep Learning-Based Magnetic Resonance Parkinsonism Index 2.0 in Early Parkinson’s Disease: A Longitudinal Study1National Neuroscience Institute, Singapore, Singapore, 2Duke-NUS Medical School, Singapore, Singapore, 3Singapore General Hospital, Singapore, Singapore, 4Siemens Healthineers India, Bangalore, India, 5International Institute of Information Technology, Bangalore, India, 6Siemens Healthineers International AG, Lausanne, Switzerland, 7École Polytechnique Fédérale de Lausanne, Lausanne, Switzerland, 8Lausanne University Hospital, Lausanne, Switzerland, 9Siemens Healthineers Singapore, Singapore, Singapore
Synopsis
Keywords: Analysis/Processing, Machine Learning/Artificial Intelligence
Motivation: There is a pressing need for accurate and reliable methods to track disease progression in patients presenting with early Parkinsonism.
Goal(s): We aim to assess the utility of a fully automated deep learning-based method developed to estimate both MRPI 1.0 and 2.0 measures in a large, longitudinal, three time-point case-control cohort of patients presenting with early Parkinsonism.
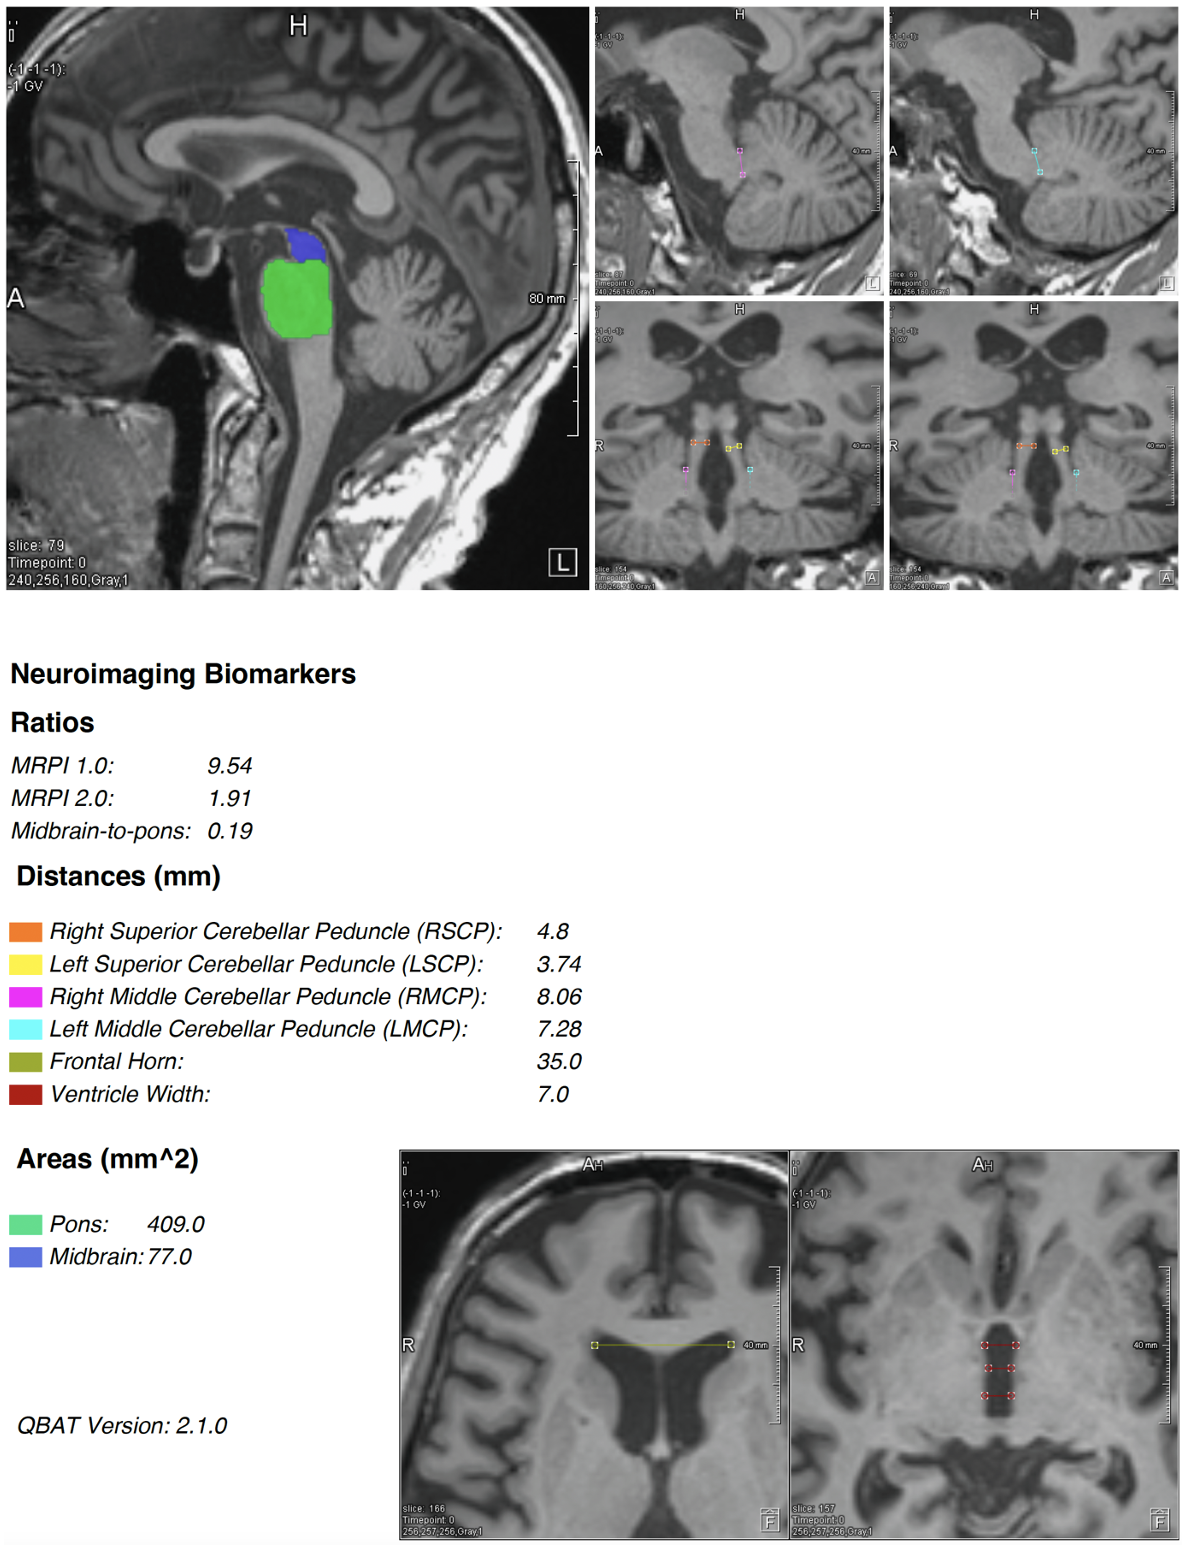
Approach: MRPI 1.0 and 2.0 measures were computed from 3D T1-weighted images using the Quantitative Brain Assessment Toolkit (QBAT, v2.1.0) research application.
Results: MRPI 2.0 showed improved group differentiation and disease classification when compared to MRPI 1.0 in patients presenting with early Parkinsonism.
Impact: Automated, deep learning-based MRPI 2.0 assessment may be used as quick tool to facilitate radiological screening, complementary to other quantitative MRI techniques such as quantitative susceptibility mapping and diffusion MRI, to track progression in Parkinson’s disease.
INTRODUCTION
Magnetic resonance parkinsonism index [MRPI 1.0 = (pons/midbrain area)×(middle cerebellar peduncle/superior cerebellar peduncle width)] is an imaging marker that can discriminate atypical parkinsonian disorders, such as progressive supranuclear palsy (PSP), from idiopathic Parkinson’s disease (PD)1. More recently, MRPI 2.0 [= MRPI 1.0 x (third ventricle/frontal horn width)] was developed and validated to improve stability compared to MRPI 1.02. By incorporating the third ventricular and lateral ventricles’ frontal horns width, the index is purportedly better discriminating early stages of variants of progressive supranuclear palsy (PSP) from idiopathic PD, which is clinically challenging. Poor intra-/inter-rater reproducibility as well as time cost and complexity of such measurements mandate their automation3.Here, we assessed the effectiveness of an entirely automated deep learning-based (DL) approach to compute MRPI 2.0 and 1.0 measurements in a three-time-point case-control study involving individuals in the early stages of PD.
METHODS
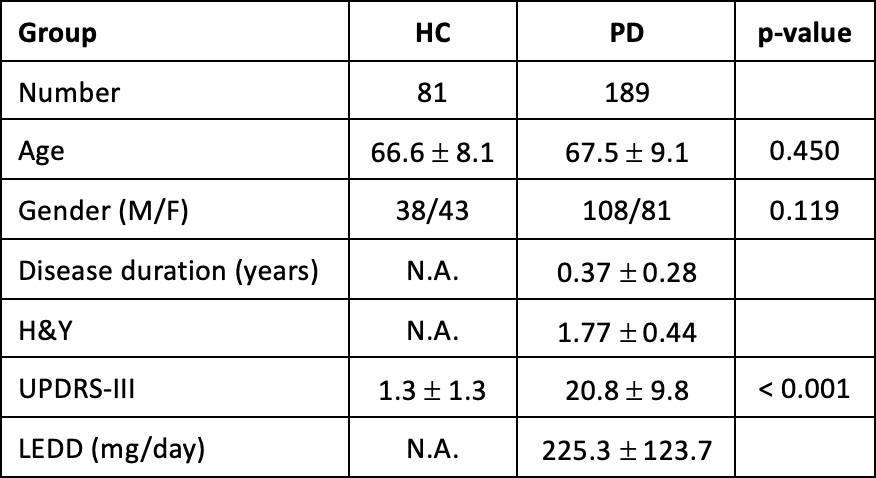
This study was approved by the institutional ethics committee. Written consent was obtained from all participants. Patients were recruited if they fulfilled the criteria for PD diagnosis as defined by the Advisory Council of the United States National Institute of Neurological Disorders and Stroke4. The PD diagnoses were made less than 1 year before recruitment, with the onset of cardinal motor symptoms occurring less than 2 years before diagnosis5. All patients had at least 2 years’ follow-up and were excluded if they later changed to a non-PD diagnosis. All participants underwent clinical motor evaluation using the MDS-UPDRS part III and Hoehn and Yahr (H&Y) staging. Age-matched healthy controls (HC) without neurological conditions were recruited from the community.Brain MRI was performed on a 3 Tesla scanner (MAGNETOM Skyra, Siemens Healthineers, Erlangen, Germany) with a 32-channel head coil, including a 3D T1 MPRAGE sequence (TR/TE/TI = 1900/2.44/900 ms, matrix=256x256, resolution=1mm iso).
MRPI 1.0 and 2.0 measures were computed from these T1-weighted images using the Quantitative Brain Assessment Toolkit (QBAT, v2.1.0; Figure 1) research application6 (Siemens Healthineers, Erlangen, Germany) in a cohort of 270 subjects (189 patients presenting with early parkinsonism/81 HCs).
221 subjects (149 patients/72 HCs) returned for a second MRI scan (TP2) 2 years from baseline while 52 subjects (34 patients/18 HCs) returned for a third scan (TP3) 4 years from baseline. Three patients with a final clinical diagnosis of PSP on follow-up clinical assessments were excluded from repeated MRI. Cross-sectional group comparisons of MRPI indices and their effect size were estimated by Student’s t-test and Hedges’ g. Longitudinal analyses of subjects who completed all time point scans were performed with repeated-measures ANOVA.
RESULTS
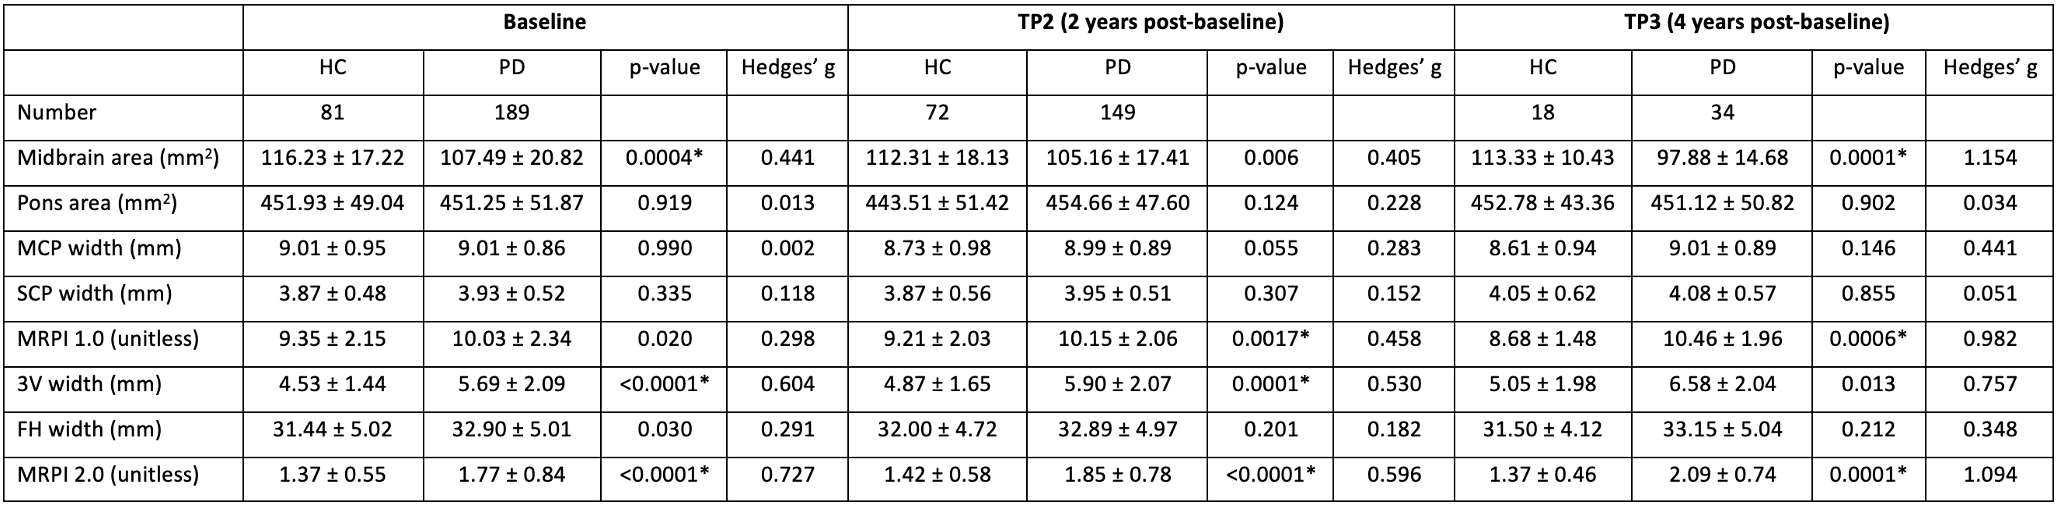
Study demographics are detailed in Figure 2. The group differences between PD and control groups at each time point are shown in Figure 3. There were significant MRPI 1.0 differences between groups, with larger effect size at TP2 and TP3 (baseline: HC=9.35±2.15, PD=10.03±2.34, p=0.020, Hedges’ g=0.298; TP2: HC=9.21±2.03, PD=10.15±2.06, p=0.0017, g=0.458; TP3: HC=8.68±1.48, PD=10.46±1.96, p=0.0006, g=0.982).MRPI 2.0 results showed higher discrimination than MRPI 1.0 between groups across all timepoints (baseline: HC=1.37±0.55, PD=1.77±0.84, p<0.0001, g=0.727; TP2: HC=1.42±0.58, PD=1.85±0.78, p<0.0001, g=0.596, TP3: HC=1.37±0.46, PD=2.09±0.74, p=0.0001, g=1.094).
Midbrain area and third ventricle width were the individual components which had the largest effect size (Figure 3).
The PSP patients showed higher MRPI scores than PD patients at baseline before they were excluded from repeat MRI based on follow-up clinical assessments (MRPI 1.0: 11.79±2.97, MRPI 2.0: 2.35±0.15).
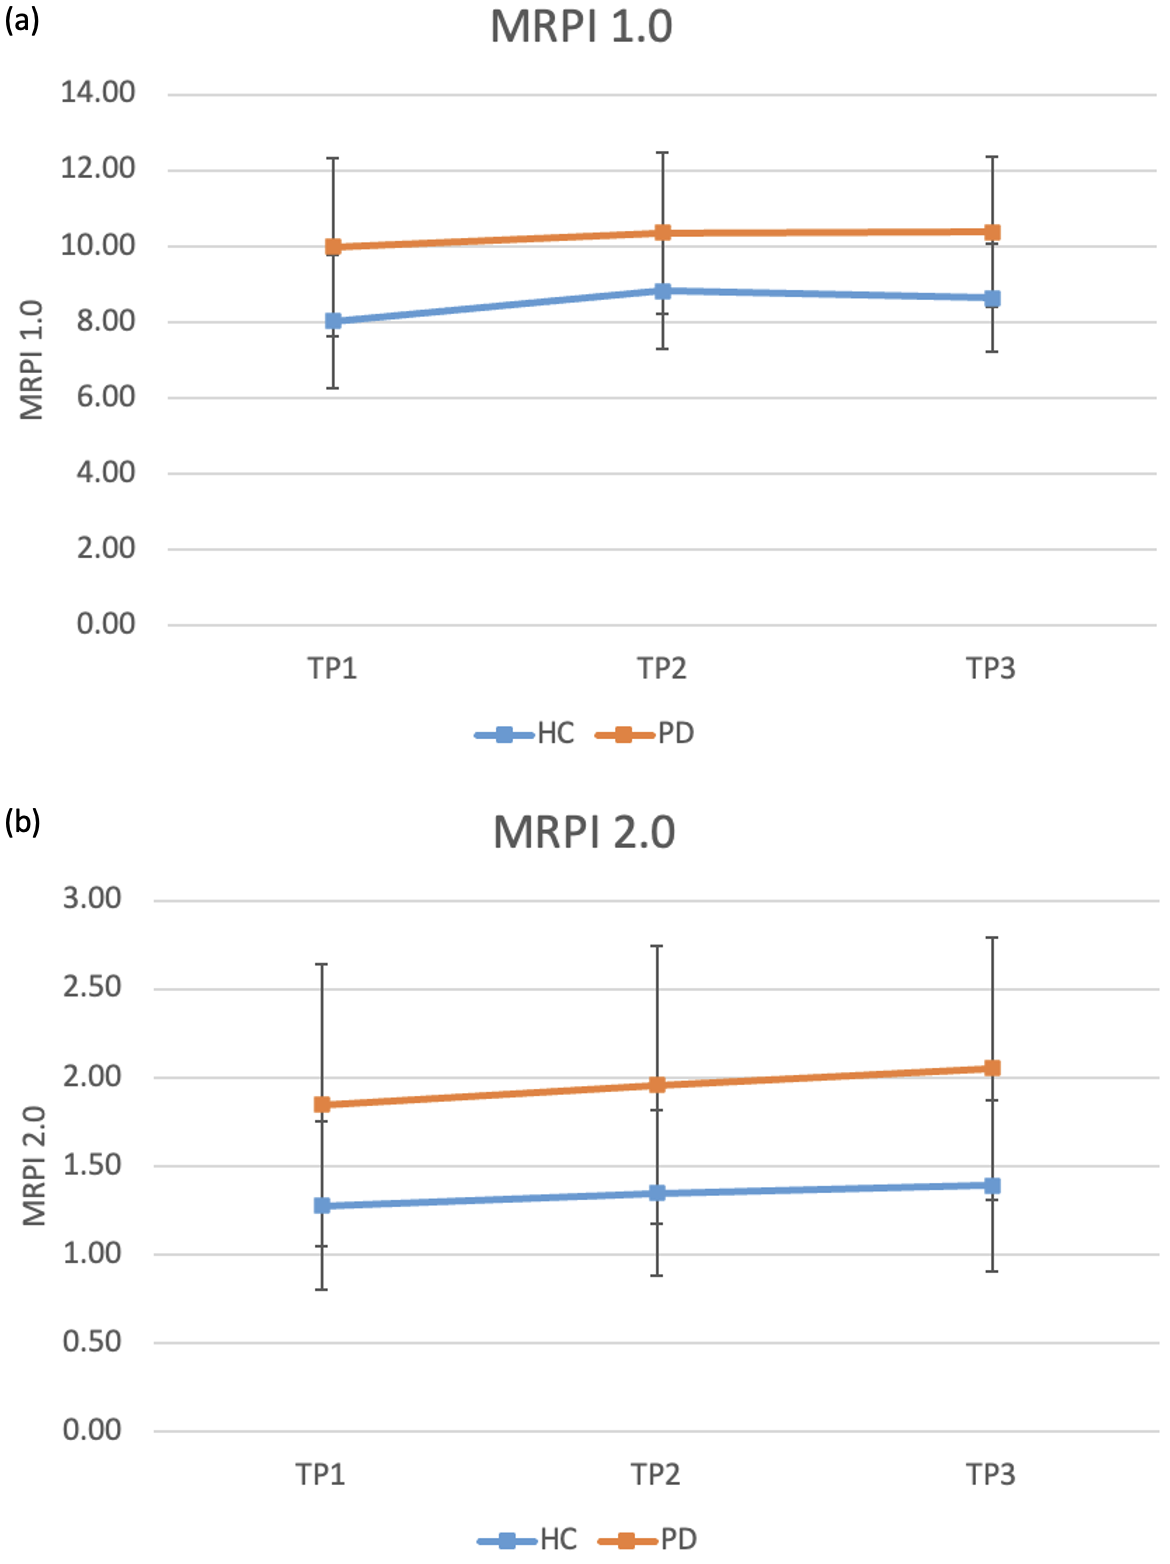
Longitudinal analyses of subjects who completed all time point scans showed significant effect for “group” (p=0.004) in MRPI 2.0, but no significance was found for “timepoint” (p=0.097) and “group x timepoint” (p=0.316). No significance was found for “group” (p=0.346), “timepoint” (p=0.548) and “group x timepoint” (p=0.244) for MRPI 1.0 (Figure 4).
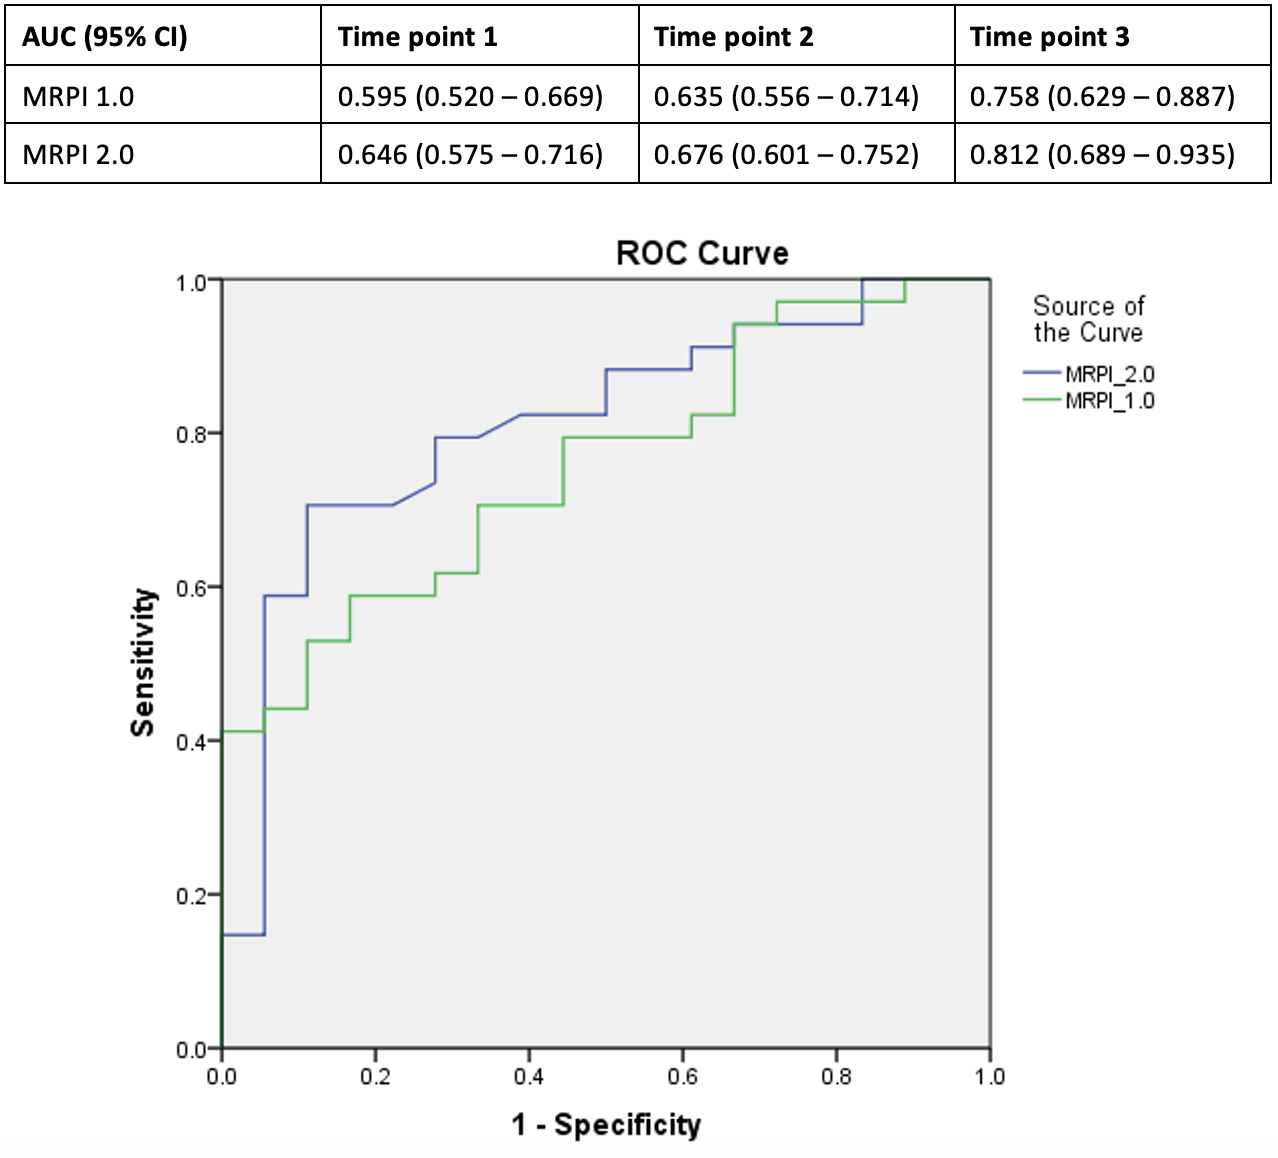
In Figure 5, we showed disease classification performance for MRPI 1.0 and MRPI 2.0 at each time point. AUC for MRPI 1.0 increased from 0.595 at baseline and 0.635 at TP2 to 0.758 at TP3. Similarly, AUC for MRPI 2.0 also increased at each time point and they were higher than MRPI 1.0 at all time points (baseline: 0.646, TP2: 0.676, TP3: 0.812).
DISCUSSION & CONCLUSION
This is a large, longitudinal, three time-point case-control study of patients presenting with early parkinsonism (average disease duration less than 1 year at baseline). Here, we assessed the added value of a fully automated DL pipeline for MRPI measurements. MRPI 2.0 showed improved group differentiation and disease classification in patients presenting with early parkinsonism if compared to MRPI 1.0, with potential to streamline radiological screening, and complement other quantitative MRI techniques like quantitative susceptibility mapping and diffusion MRI for the monitoring of PD progression.Acknowledgements
We would like to thank the National Medical Research Council Singapore for their funding support.References
1. Quattrone A, Morelli M, Nigro S, et al. A new MR imaging index for differentiation of progressive supranuclear palsy-parkinsonism from Parkinson's disease. Parkinsonism Relat Disord. 2018;54:3-8. doi: 10.1016/j.parkreldis.2018.07.016.
2. Quattrone A, Bianco MR, Antonini A, et al. Development and Validation of Automated Magnetic Resonance Parkinsonism Index 2.0 to Distinguish Progressive Supranuclear Palsy-Parkinsonism from Parkinson's Disease. Mov Disord. 2022 Jun;37(6):1272-1281. doi: 10.1002/mds.28992. Epub 2022 Apr 11.
3. Scheffler M, Maréchal B, Boto J, et al. A method for fast automated assessment of the magnetic resonance parkinsonism index. Neuroradiology. 2020;62(6):747-751. doi: 10.1007/s00234-020-02380-5. Epub 2020 Feb 24.
4. Gelb DJ, Oliver E, Gilman S. Diagnostic criteria for Parkinson disease. Arch Neurol. 1999 Jan;56(1):33-9. doi: 10.1001/archneur.56.1.33.
5. Huang X, Wen MC, Ng SYE, et al. Periventricular white matter hyperintensity burden and cognitive impairment in early Parkinson’s disease. Eur J Neurol. 2020;27(6):959-966. doi: 10.1111/ene.14191. Epub 2020 Mar 26.
6. Venkategowda PB, Di Noto T, et al. CNN-based Automated Pipeline for Accurate Computation of Magnetic Resonance Parkinsonism’s Index Measurements. Submitted in parallel, ISMRM 2024.
Figures