4709
Deep learning-based estimation of future brain atrophy using baseline MRI and PET1Biomedical Engineering, University of California, Davis, Davis, CA, United States, 2Neurology, University of California, Davis, Davis, CA, United States
Synopsis
Keywords: Diagnosis/Prediction, Alzheimer's Disease, Deep learning
Motivation: Prediction of brain atrophy, a key feature in Alzheimer’s Disease (AD), is critical to observe disease progression before the onset of irreversible atrophy.
Goal(s): We aim to predict future cortical atrophy rates in the elderly population from baseline PET and MRI scans.
Approach: We predict image-derived cortical atrophy rate as an anatomical biomarker of neurodegeneration using image-generation deep learning networks based on T1-weighted structural MRI and PET as inputs.
Results: Both T1- and PET-based models can predict longitudinal atrophy maps from baseline, with greater average atrophy in AD and mild cognitive impairment compared to cognitively normal, consistent with the Tensor-Based Morphometry method.
Impact: Predicting future brain atrophy from baseline imaging can show disease progression before the onset of irreversible atrophy. Early detection of cognitive impairment and Alzheimer’s Disease progression would support planning for patient care and monitoring new lifestyle interventions and pharmacological therapies.
INTRODUCTION
Alzheimer’s Disease (AD) is related to increased rates of whole-brain loss and hippocampal atrophy1,2 with concurrent expansion of the ventricles, which accelerates over the disease course as an individual progresses from a diagnosis of cognitively normal (CN) to AD.3,7,8 Cortical brain atrophy thus is an excellent marker of clinical decline and can support future clinical course prediction in patients with cognitive impairment. These neurodegenerative features are measurable on T1-weighted MRI for longitudinal imaging of brain structure and volume.1 Existing studies have shown a strong relationship between beta-amyloid (Aβ) and subsequent atrophy in temporal-parietal brain areas.6 Here, we used a U-Net image-generation deep learning network to predict future cortical atrophy rates in elderly populations, with the initial MRI- or baseline Amyloid-PET images serving as inputs to the model.METHODS
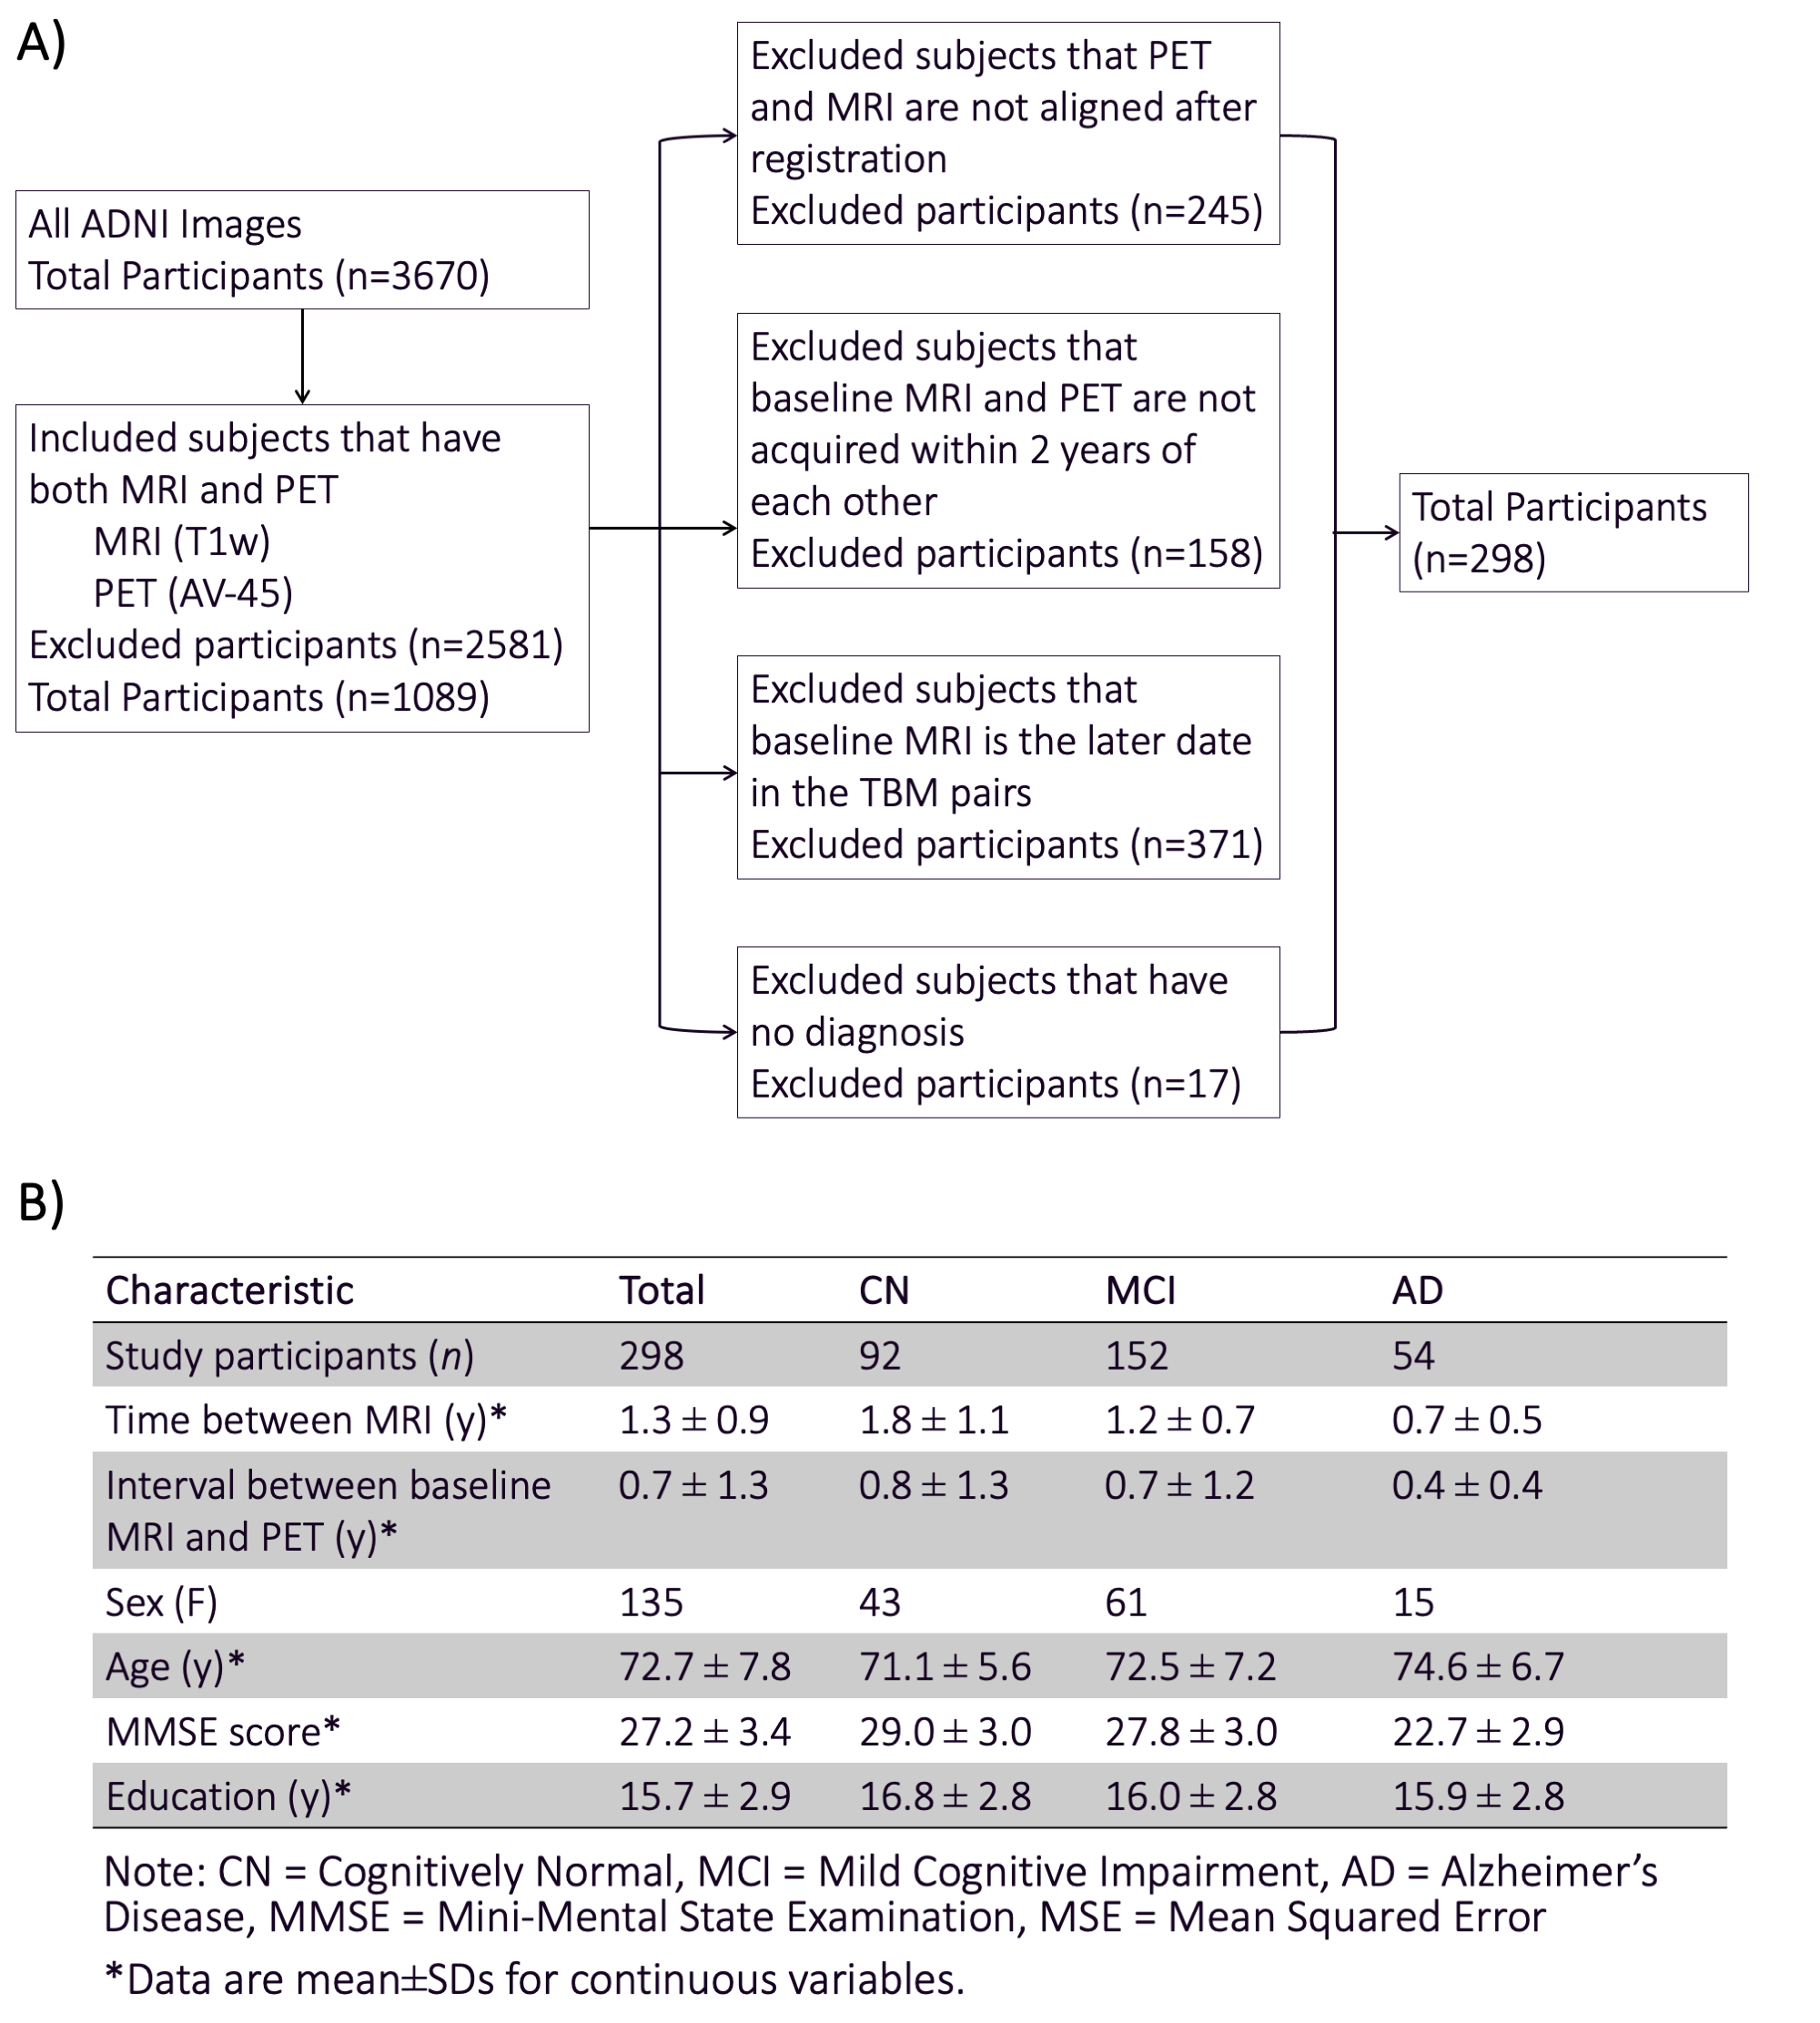
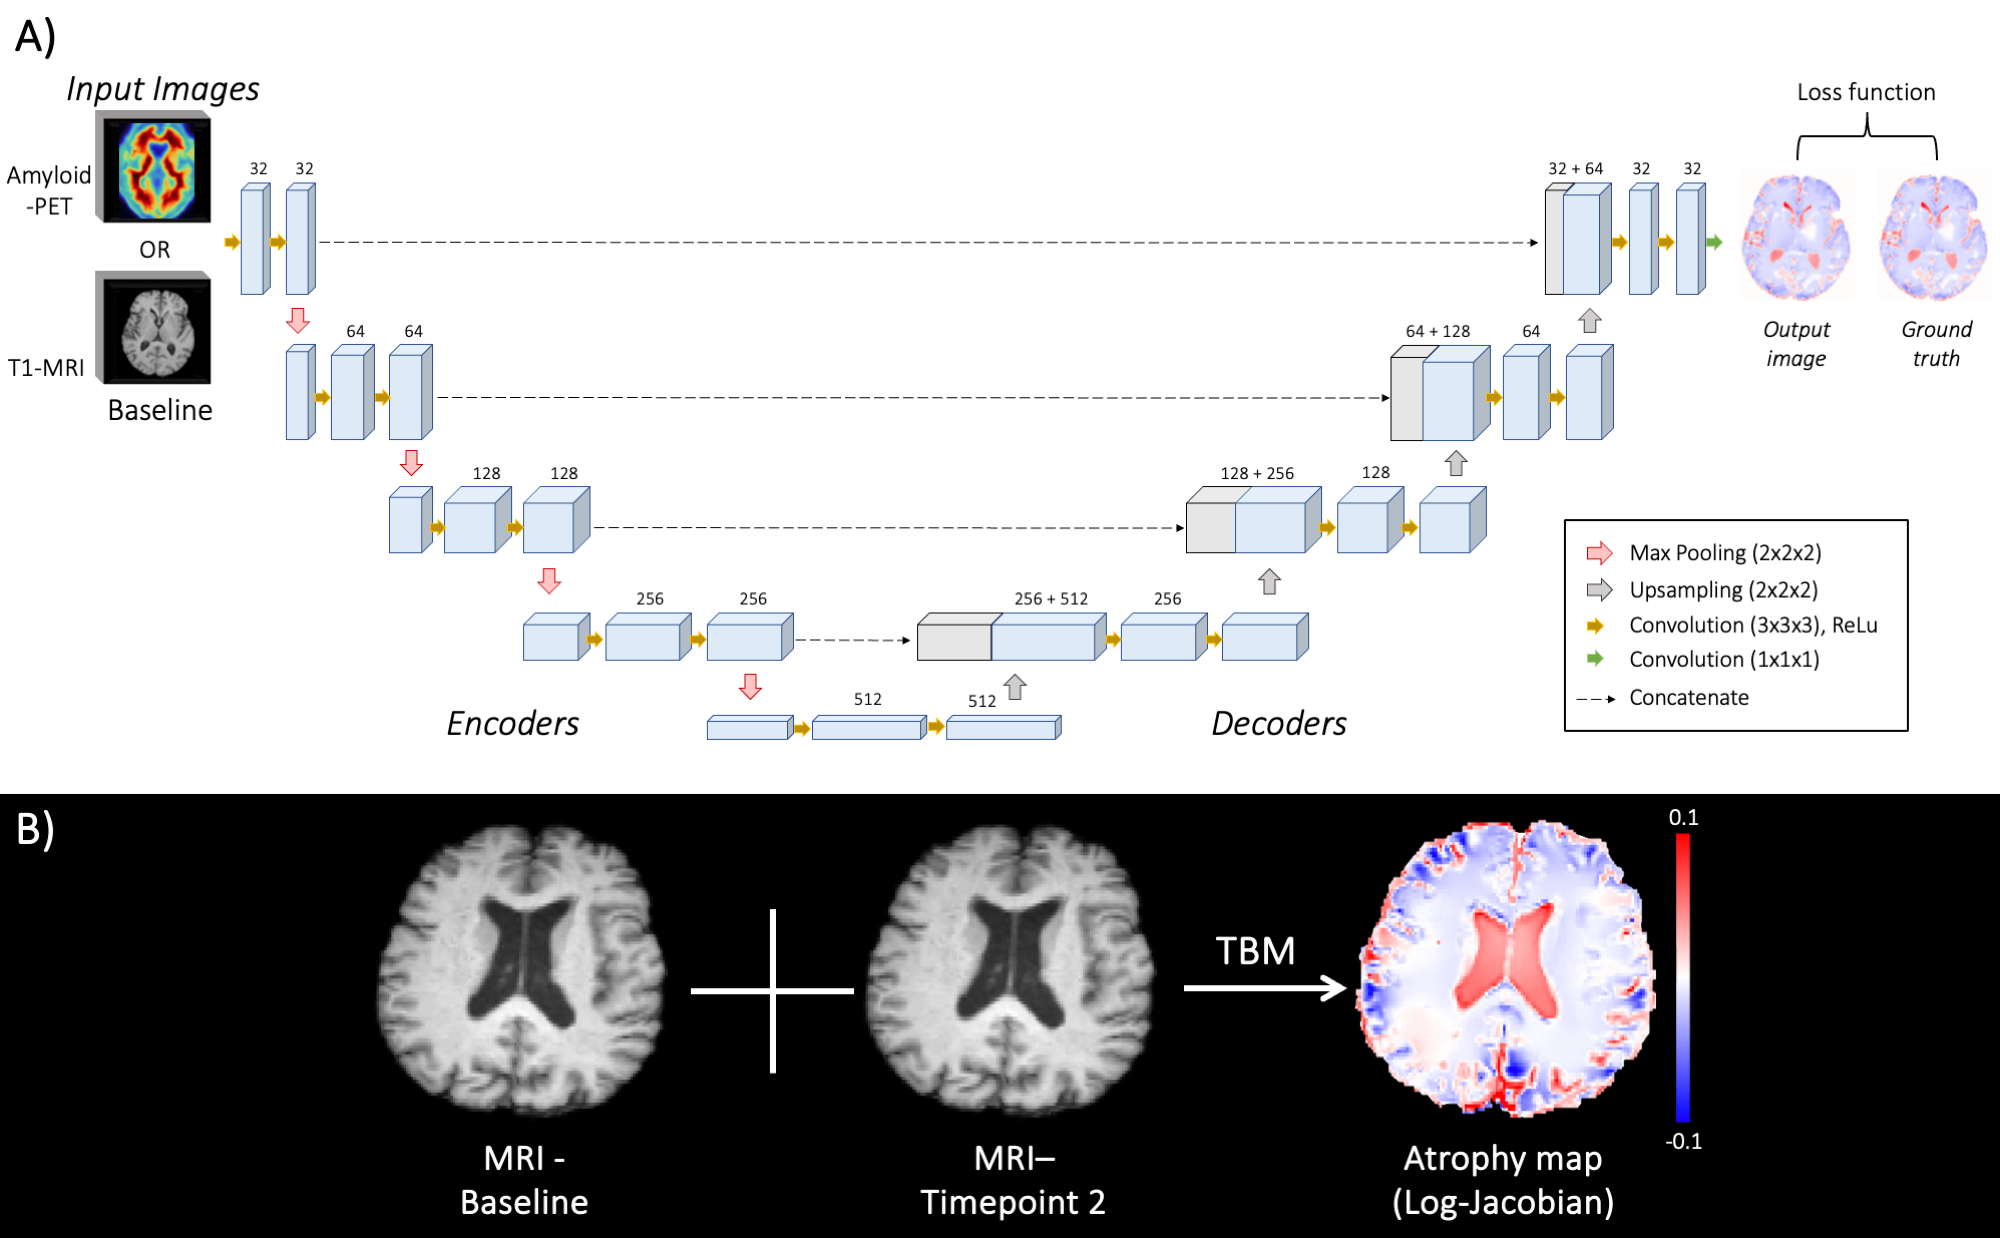
Dataset: MRI and PET data were retrospectively collected from the Alzheimer’s Disease Imaging Initiative (ADNI). A total of 298 subjects, including 92 CN individuals, 152 Mild Cognitive Impairment (MCI), and 54 AD patients, were identified with both MRI and PET scans (Figure 1).Tensor-Based Morphometry (TBM): For the ground truth of brain atrophy rate maps, we used voxelwise log-Jacobian measures of longitudinal brain structural changes that were computed by TBM. TBM performs nonlinear registration of two serial T1-weighted MRI scans between an earlier (baseline) and a later time point (Figure 2B). Negative log-Jacobian values (blue) indicate tissue contractions, whereas positive values (red) indicate tissue expansions. The TBM algorithm also incorporates prior information about tissue boundaries for robust and sensitive measurement of tissue changes.4 All data were registered to Minimal Deformation Template (MDT3) space.5
Model Architecture: A U-Net architecture was used in this study (Figure 2A). The ground truth was an atrophy map (in log-Jacobian values) generated from the TBM algorithm. Image scaling and horizontal rotation were used for data augmentation. The model was trained with ADAM optimizer (learning rate 0.0001) using a batch size of 2 and 200 epochs. We used mean squared error (L2 loss) for the loss function. The model outputs an atrophy map with voxel values in log-Jacobian. The testing set was randomly chosen (n=30). Then, subjects were randomly divided into five sets for five-fold cross-validation. In each fold, the five sets were split by a ratio of 4:1, with 4 sets used for training and 1 set for validation. We compared a model that used T1-MRI data as input (T1-model) and amyloid-PET as input (PET-model), which were trained and tested separately.
Data Analysis: We compared the performance from T1- and PET-models with the TBM ground truth. The predicted atrophy rate was evaluated across diagnosis groups in the test set using the structural similarity index measure (SSIM) at the whole-brain level. Each model's average atrophy was recorded with the corresponding absolute error and mean squared error (MSE) between the model output and the TBM ground truth. Paired t-tests were performed to compare outputs from each model with TBM.
RESULTS
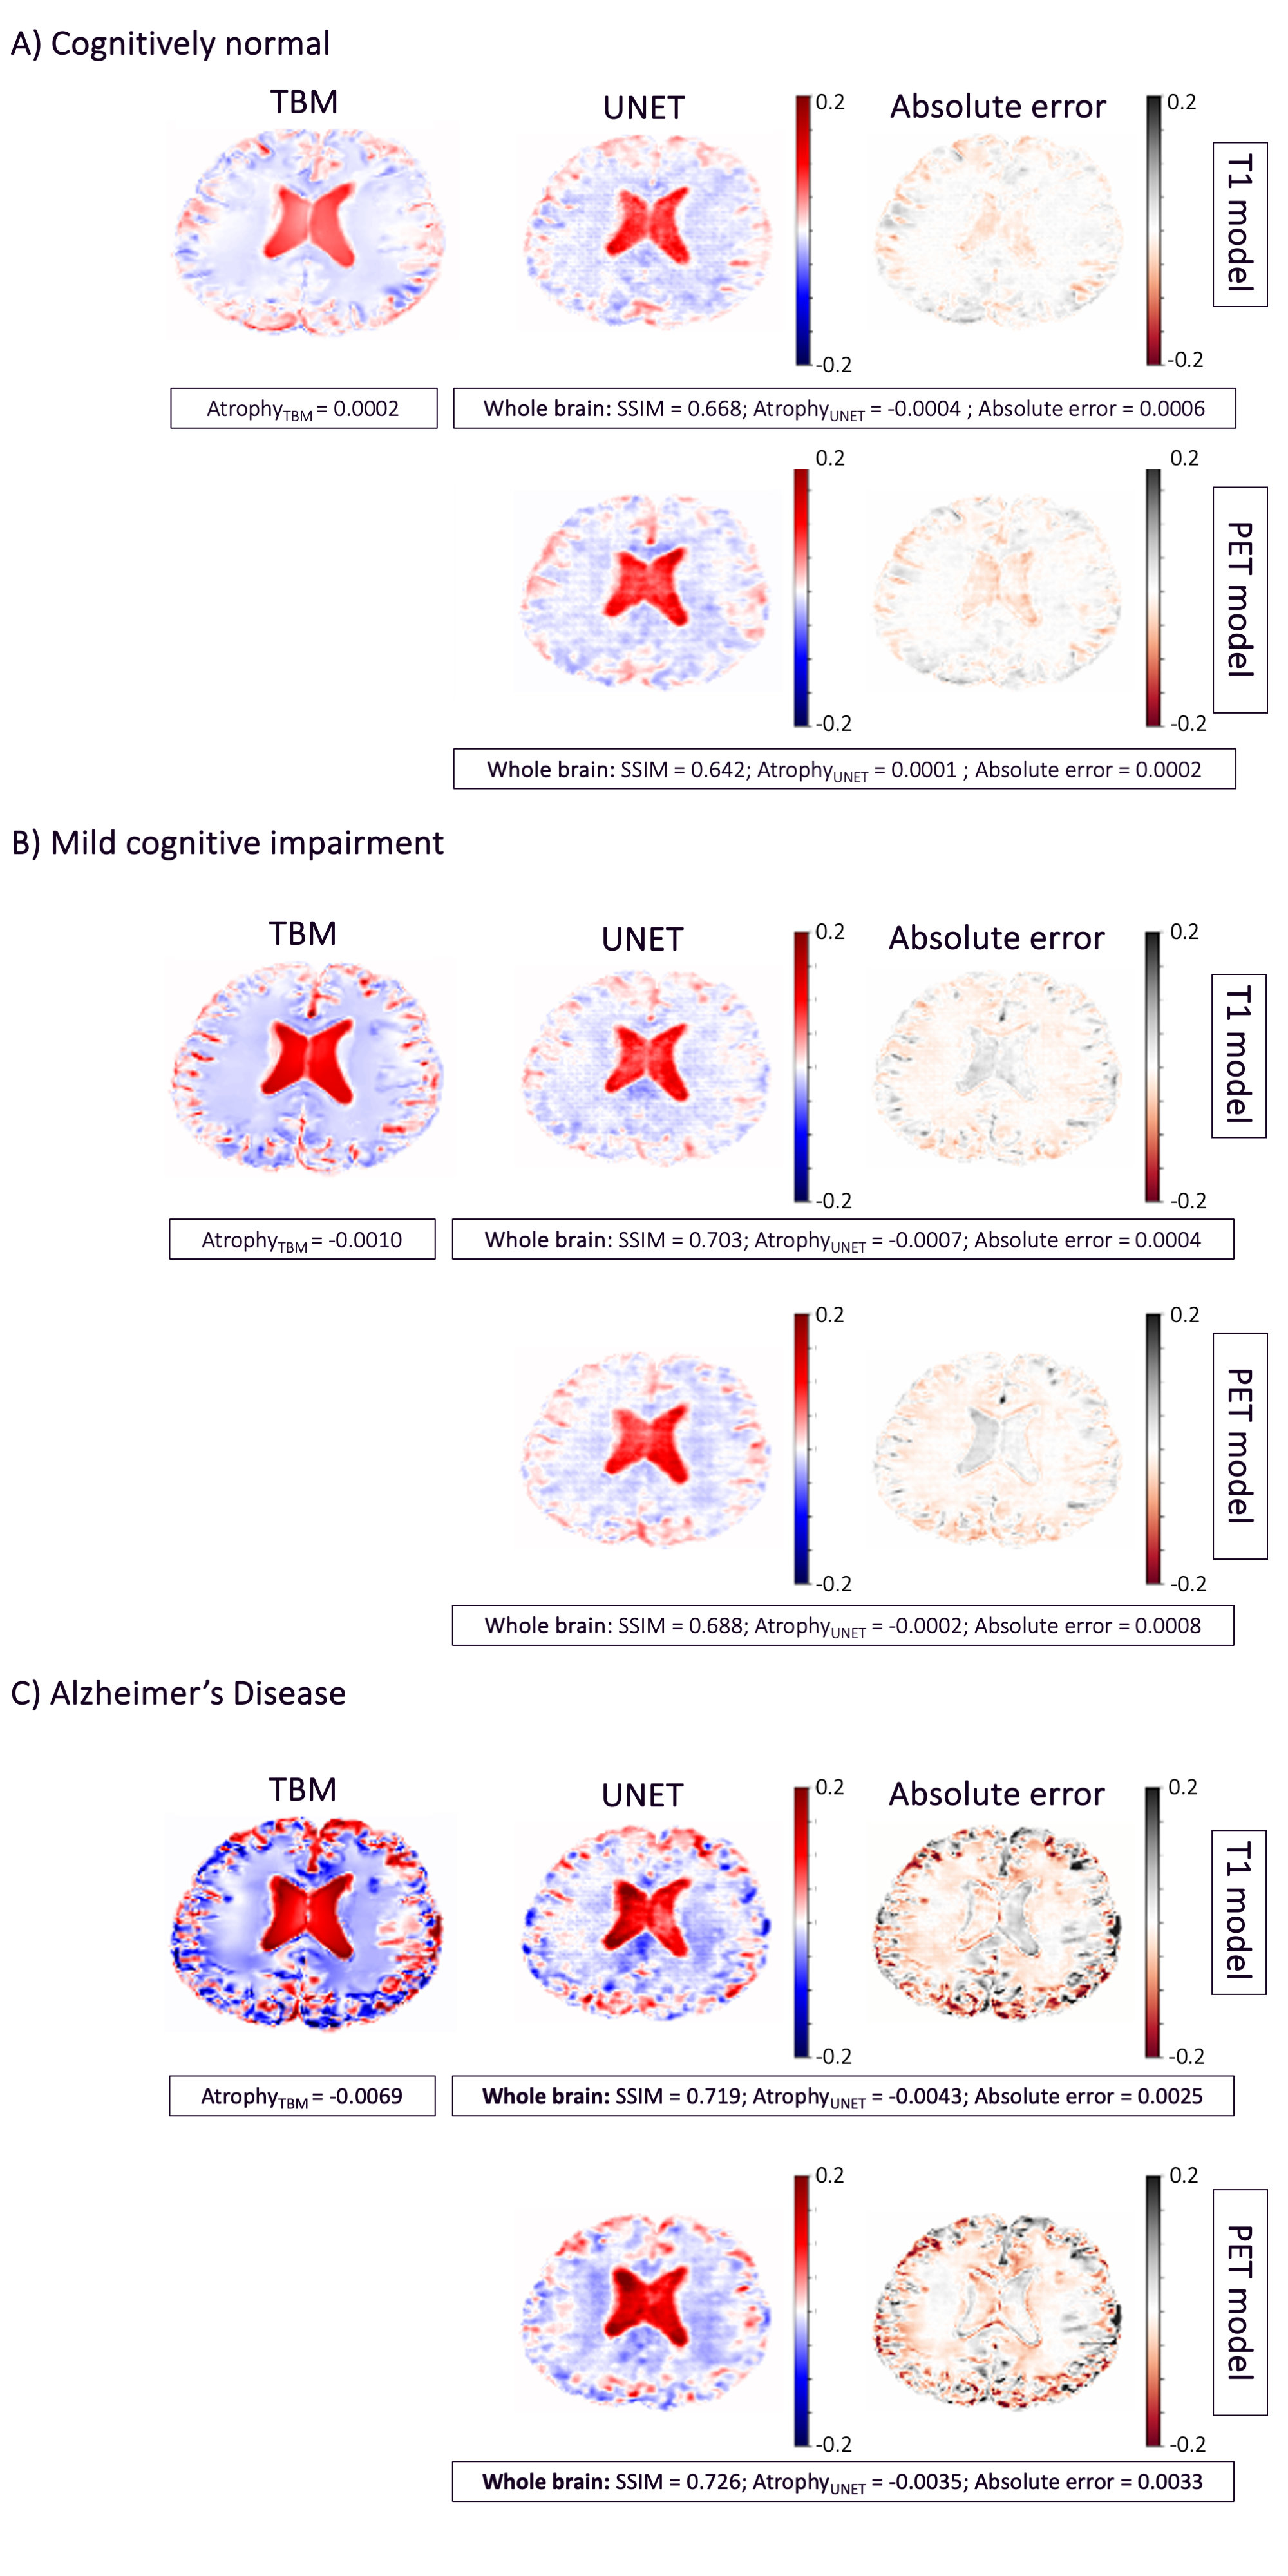
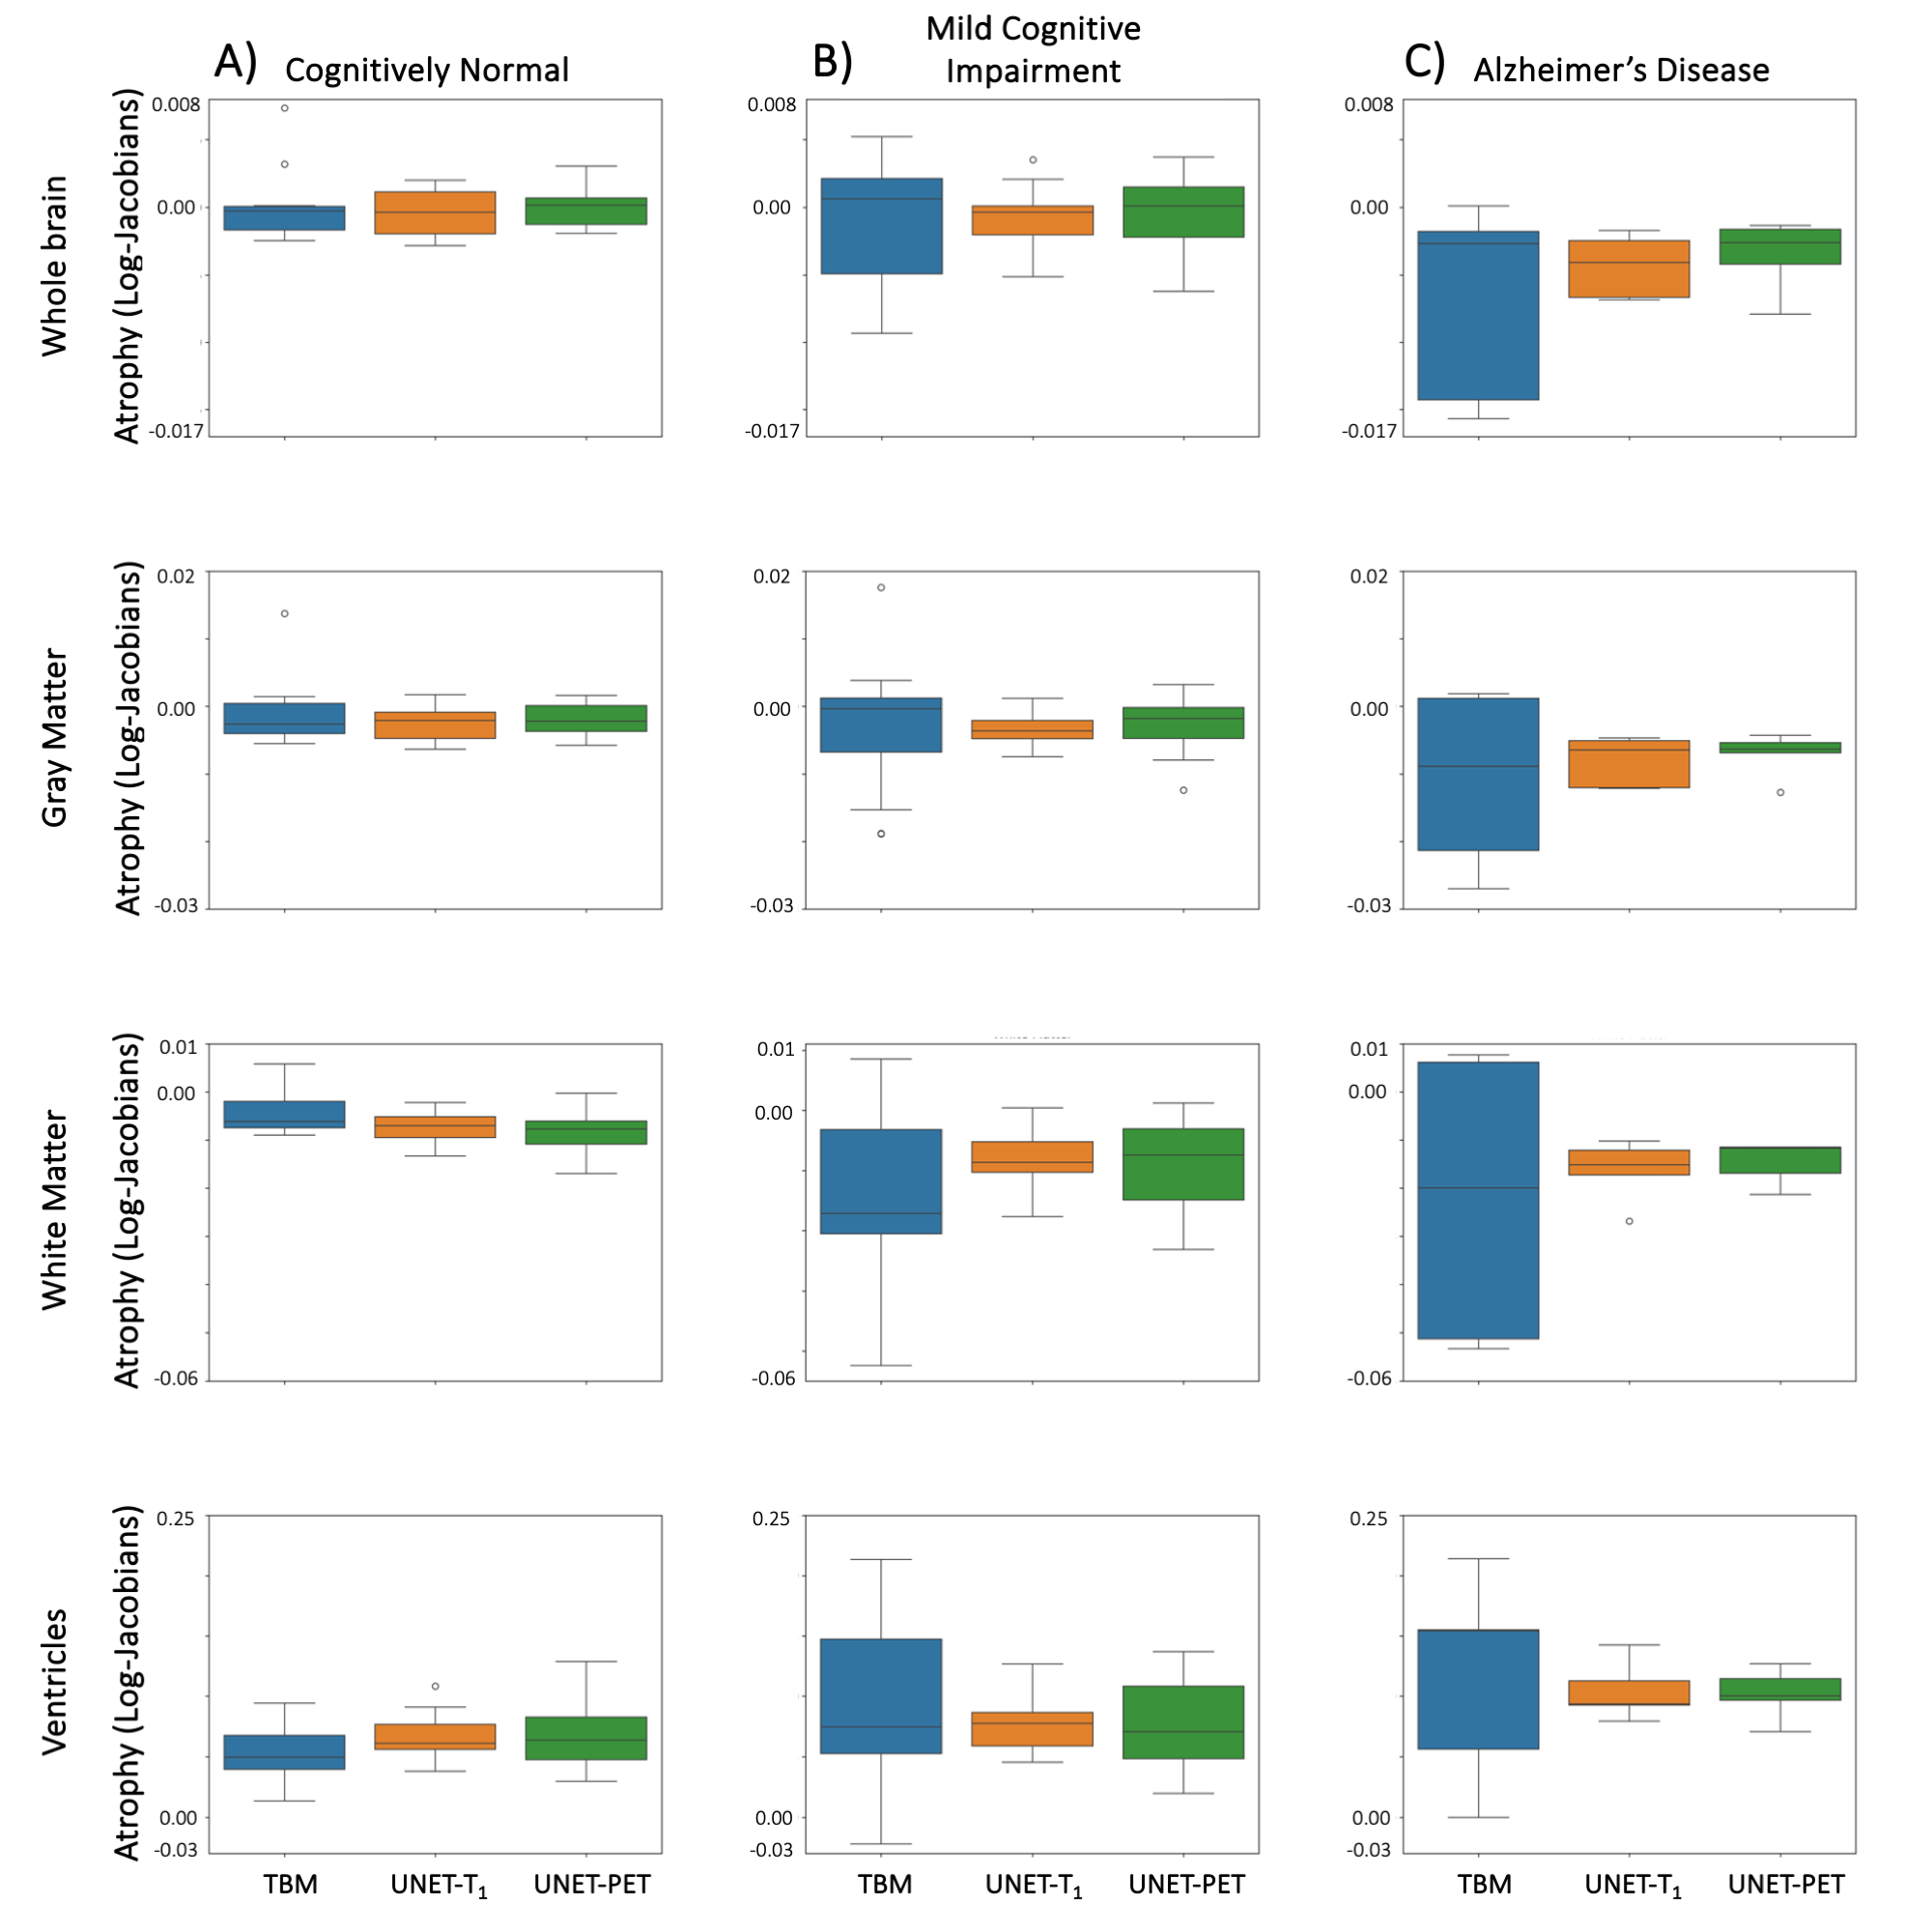
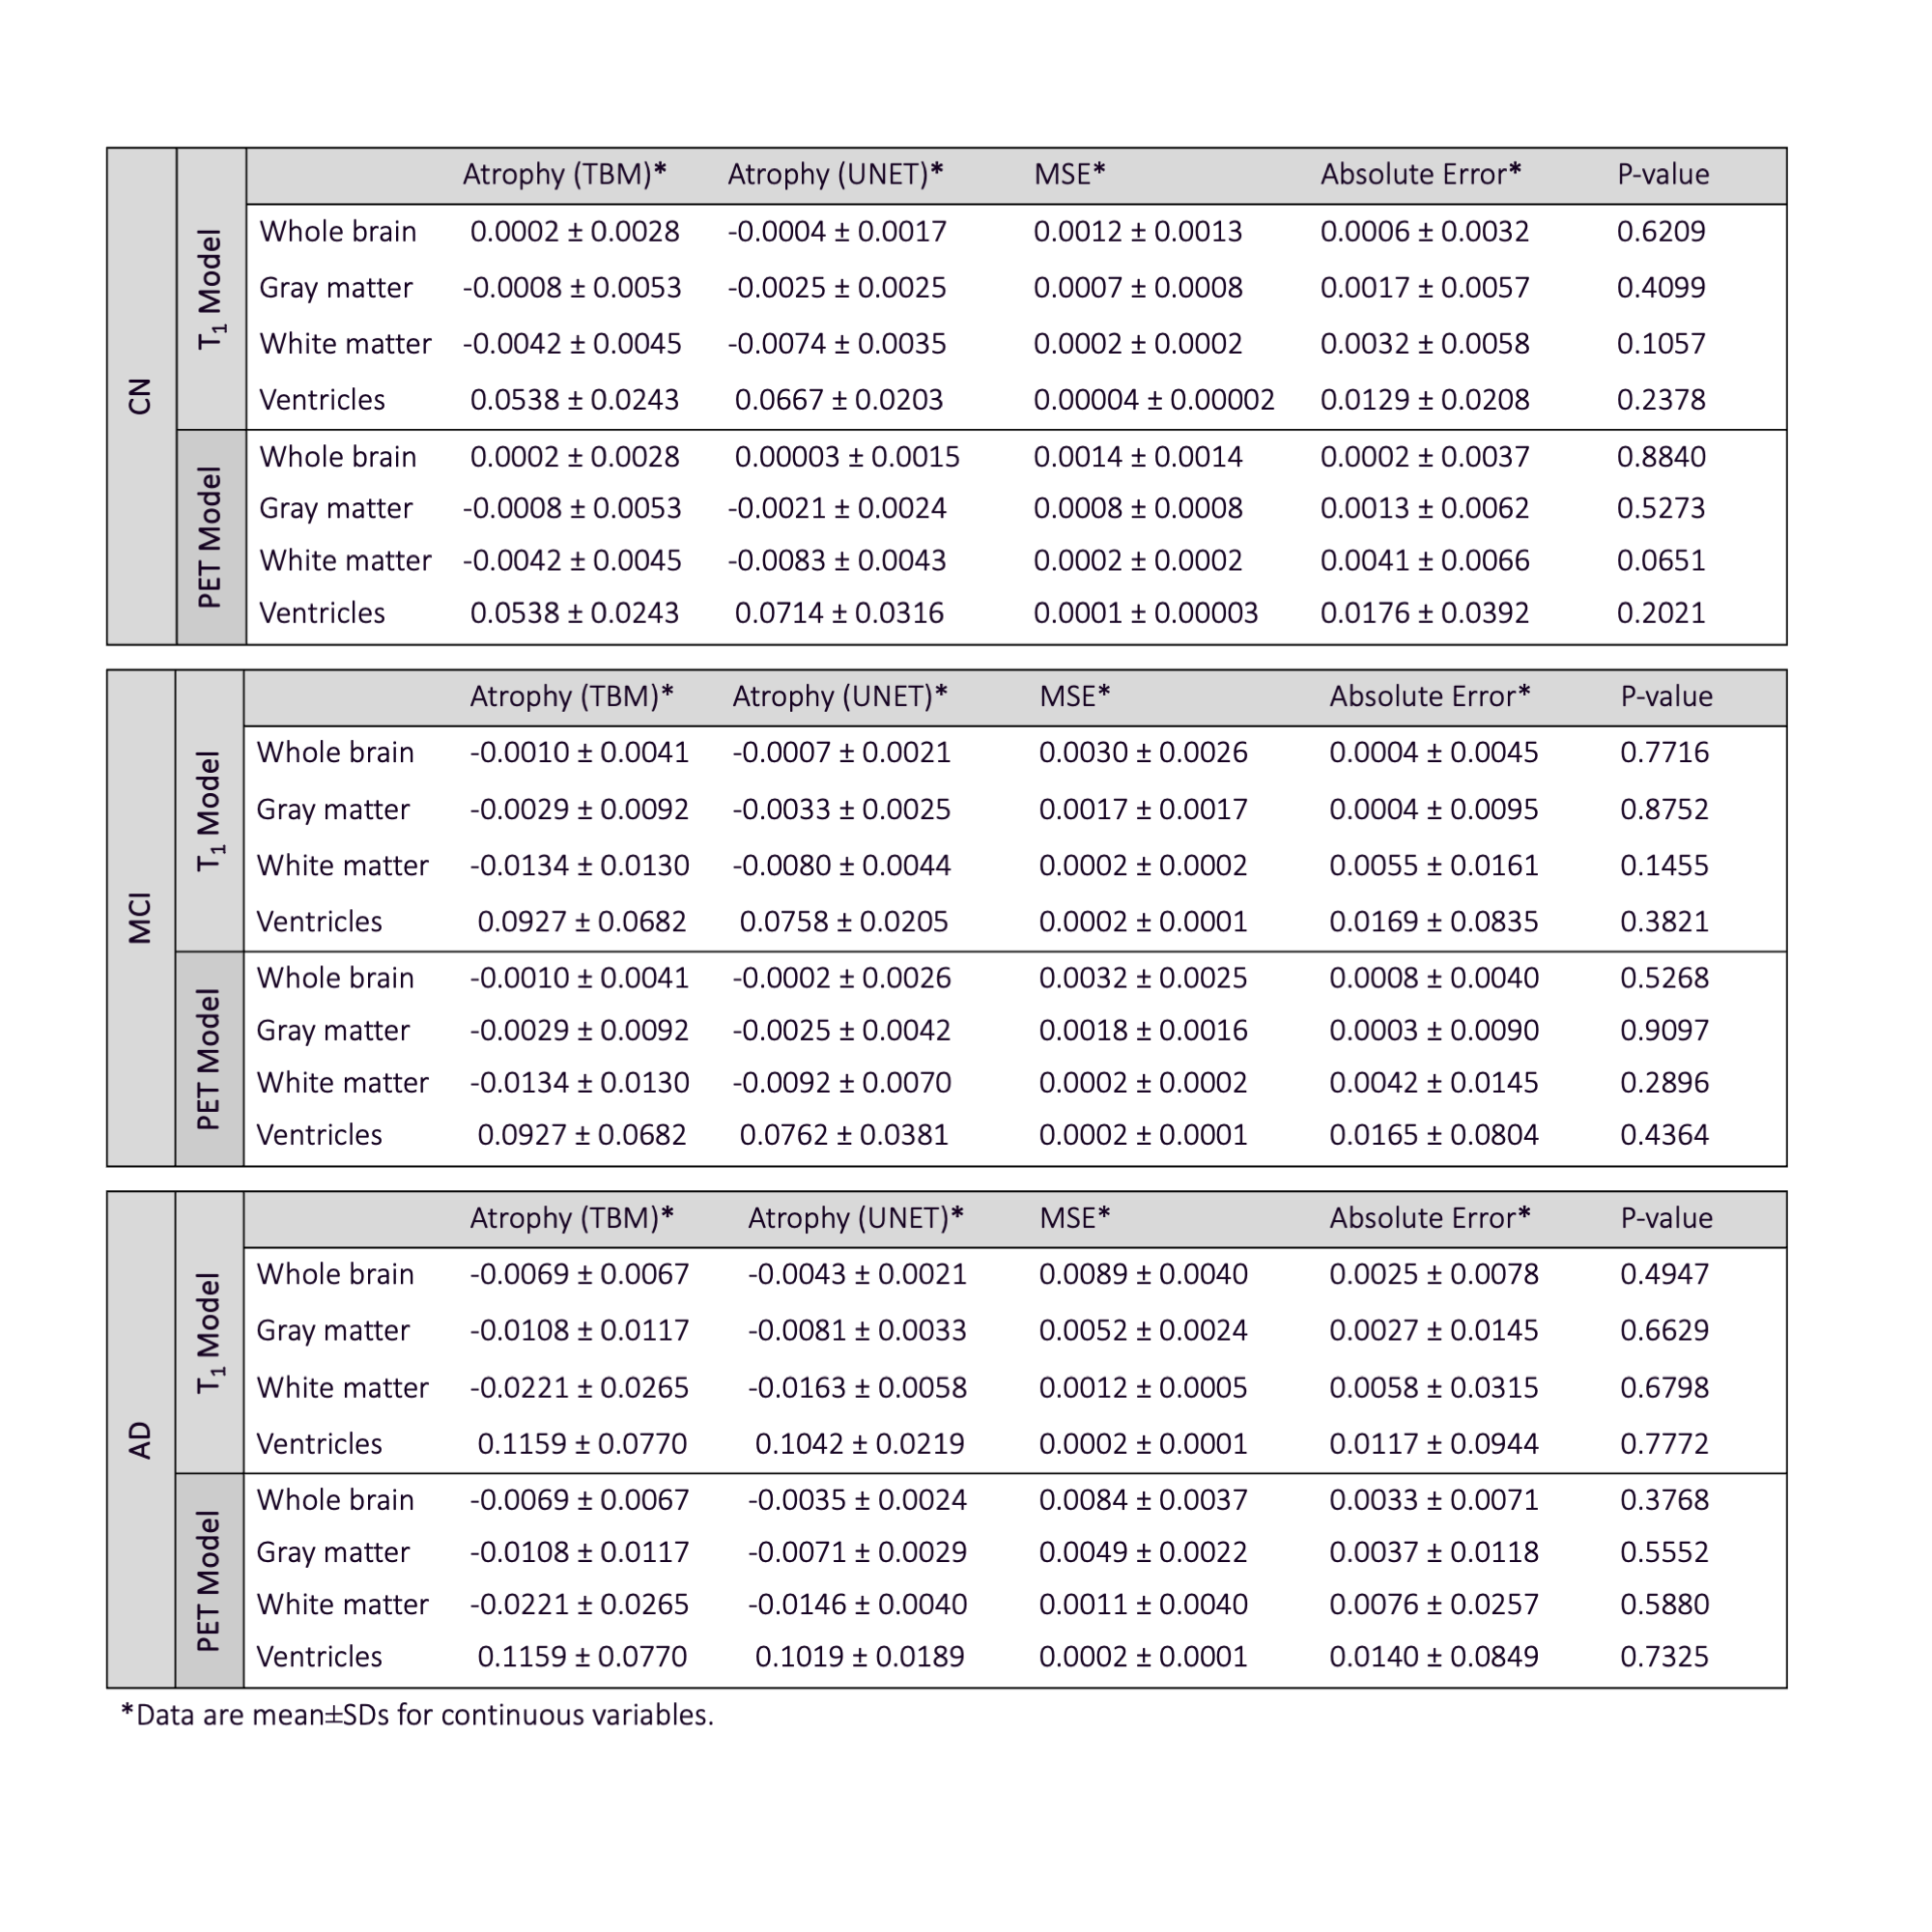
Figure 3 shows the average predicted atrophy maps and corresponding error for each diagnosis group at the group level. In the whole brain, for CN and MCI groups, the T1 model slightly outperformed the PET model with SSIMs of 0.67±0.07 and 0.64±0.06, respectively, while the PET model had SSIMs of 0.70±0.06 and 0.69±0.06, respectively. In selected regions, especially gray matter, we observed a larger rate of atrophy in AD compared to MCI and in MCI compared to CN groups in both deep learning models, which was consistent with the ground truth from TBM. There was no statistical difference in average atrophy predicted by either model and TBM values for all diagnostic groups in all selected regions (Figure 4), with relatively small absolute error and MSE in both models (Table 1).DISCUSSION AND CONCLUSION
Our study demonstrated that a U-Net deep learning model trained using only baseline T1 weighted MRI or baseline amyloid PET data could be used to predict future atrophy rates. Both models are able to show the cortical volume loss and ventricle expansion as patterns of atrophy that differed between AD, MCI, and CN. As the next steps, we will extend the sample size of training to our local Alzheimer’s Disease Research Center PET and MRI data and evaluate model generalizability. We treated each modality as an individual input for the deep learning model, but amyloid PET, structural changes, and vascular pathology (detected in MRI-FLAIR) also affect atrophy concurrently.6 In future studies, we will adapt this image-generation deep learning network to integrate multiple input imaging biomarkers with clinical data to enhance prediction performance and understand the complex relationship of those pathologies.Acknowledgements
This study was supported by NIH R01-NS128179 and Translational Health Data Science Fellowship, sponsored by the UCD Department of Public Health Science and UCD DataLab, funded through the Center for Information Technology for the Interest of Society and the Banatao Institute, University of California, in collaboration with First Affiliated Hospital/Sun Yat-sen University, China. Data used in the preparation of this study were obtained from the Alzheimer's Disease Neuroimaging Initiative (ADNI) database (www.loni.ucla.edu/ADNI).References
1. Whitwell, J. L. Progression of Atrophy in Alzheimer’s Disease and Related Disorders. Neurotox. Res. 18, 339–346 (2010).
2. Whitwell, J. L. et al. 3D maps from multiple MRI illustrate changing atrophy patterns as subjects progress from mild cognitive impairment to Alzheimer’s disease. Brain J. Neurol. 130, 1777–1786 (2007).
3. Jack, C. R. et al. Update on the magnetic resonance imaging core of the Alzheimer’s disease neuroimaging initiative. Alzheimers Dement. J. Alzheimers Assoc. 6, 212–220 (2010).
4. Fletcher, E. et al. Combining Boundary-Based Methods With Tensor-Based Morphometry in the Measurement of Longitudinal Brain Change. IEEE Trans. Med. Imaging 32, 223–236 (2013).
5. Kochunov, P. et al. An Optimized Individual Target Brain in the Talairach Coordinate System. NeuroImage 17, 922–927 (2002).
6. Chételat, G. et al. Relationship between atrophy and β-amyloid deposition in Alzheimer disease. Ann. Neurol. 67, 317–324 (2010).
7. Jack, C. R. & Holtzman, D. M. Biomarker Modeling of Alzheimer’s Disease. Neuron 80, 1347–1358 (2013).
8. Fox, N. C., Freeborough, P. A. & Rossor, M. N. Visualisation and quantification of rates of atrophy in Alzheimer’s disease. The Lancet 348, 94–97 (1996).
Figures