4707
An Alzheimer's Disease Progression Score Using Supervised Variational Autoencoders on MRI Anatomic Imaging Data1Department of Biostatistics, University of Washington, Seattle, WA, United States, 2Department of Radiology, University of Washington, Seattle, WA, United States, 3National Alzheimer’s Coordinating Center, Seattle, WA, United States, 4Department of Biostatistics, The University of Texas MD Anderson Cancer Center, Houston, TX, United States
Synopsis
Keywords: Diagnosis/Prediction, Alzheimer's Disease
Motivation: Alzheimer's disease affects millions, but understanding its progression remains challenging. This study seeks to assess the severity of Alzheimer's from imaging data alone.
Goal(s): To create a score that reflects how far Alzheimer's has progressed in a patient.
Approach: Using brain scans and simple patient demographic information, we developed an imaging-based model that predicts the severity of Alzheimer's.
Results: Our model successfully distinguishes between different stages of Alzheimer's, offering a reliable disease progression score.
Impact: This work could lead to earlier detection and better tracking of Alzheimer's, informing treatment decisions and aiding in the objective development and evaluation of new therapies.
Introduction
Alzheimer's disease (AD), the most prevalent form of dementia, poses a significant challenge to healthcare systems worldwide due to its clinically heterogeneous nature. The variability in cognitive symptoms, diagnostic test results, and progression rates complicates the development and evaluation of therapeutic strategies. Accurate measurement of disease progression is critical for the timely assessment of treatment efficacy, particularly in the pre-symptomatic stages of AD where observable symptoms may not be evident. This paper seeks to enhance the current understanding of AD progression by applying advanced machine learning techniques to integrate neuroimaging metrics with demographic data, offering a more holistic view of the disease's stage.Methods
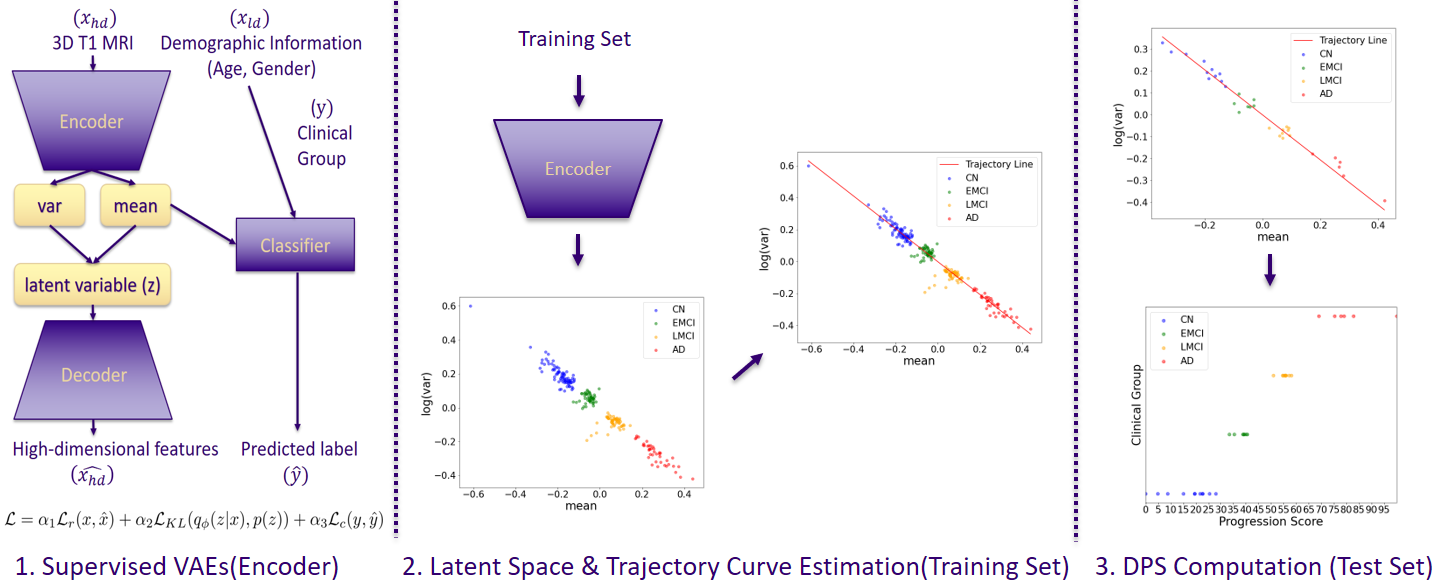
We used supervised Variational Autoencoders (VAEs) [1] to process high-dimensional neuroimaging data for Alzheimer's disease progression analysis, with age and gender as low-dimensional covariates. We used imaging data from ADNI [2], in which Free Surfer [3] had been utilized to extract 68 cortical and 48 subcortical volumes (“features”) from 3D T1-weighted MRI images (MPRAGE or SPGR) using the Desikan-Killany atlas. Features were normalized by each participant’s total intracranial volume, enhancing comparability across subjects. Our analysis included 257 ADNI3 and 676 ADNI2 baseline participants, after removing those with missing data and duplicates, spanning four clinical groups: Control (CN), Early Mild Cognitive Impairment (EMCI), Late MCI (LMCI), and AD.The VAE's objective was to minimize the reconstruction error, estimating latent variables for each subject to create a generative model that captures AD progression. The encoder component of the VAE computes the mean and variance parameters of a normal distribution, and it is the mean that is concatenated with supervisory variables to form an input for the classifier, which then predicts the patient class labels. The decoder portion of the VAE was used for training only. The training process was guided by three loss components: reconstruction error (MSE), Kullback-Leibler divergence, and classification error. The overall scheme is similar to the method described by Kmetzsch [4].
To compute our Disease Progression Score (DPS), we first encoded the set of 116 neuroimaging features from each individual in a training set into a latent space, which was then used to project the test data onto a trajectory curve, delineating the progression from early to advanced stages of AD. We constructed both linear and non-linear trajectory curves that passed through the centroids of the control and AD clusters. The DPS is the coordinate of their projection along this curve, 0 corresponding to the beginning and 100 to the end of the curve.
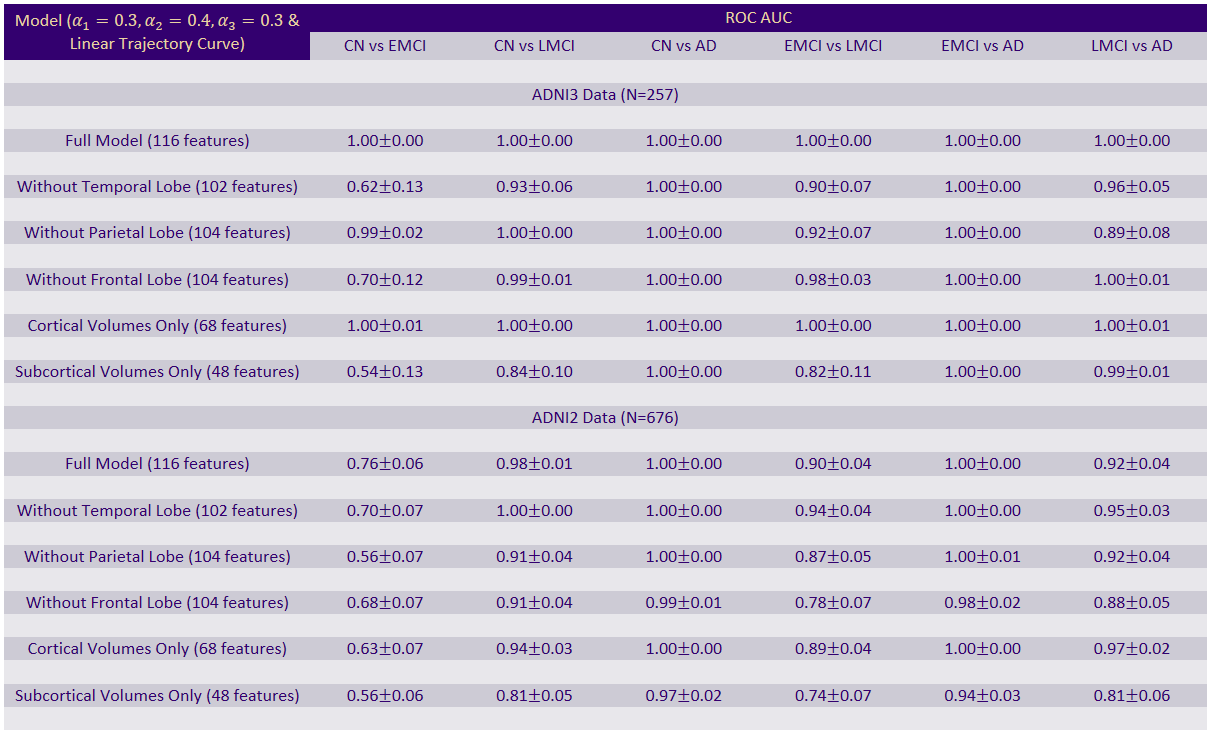
To ensure robustness and generalizability, we employed stratified sampling to create 100 folds, allowing for multiple DPS measurements per participant. We estimated the area under the ROC curve (AUC) to assess the model’s performance in classifying six pairwise clinical groups. The mean DPS was then correlated with cognitive assessment scores using Kendall’s Tau, providing a statistical measure of the association between the estimated disease progression and cognitive decline.
Results
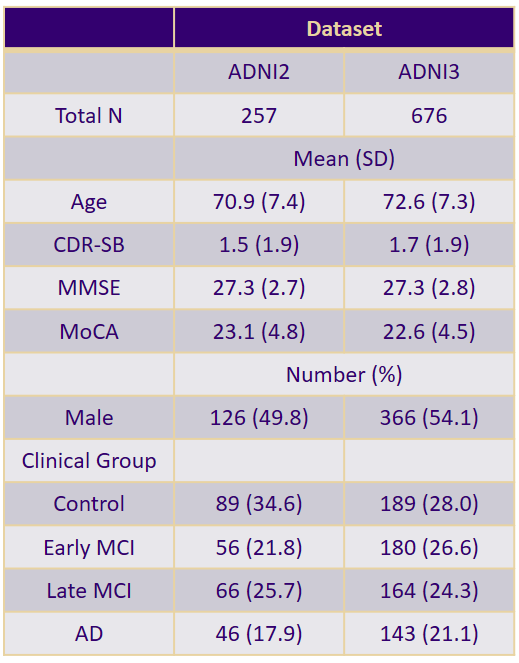
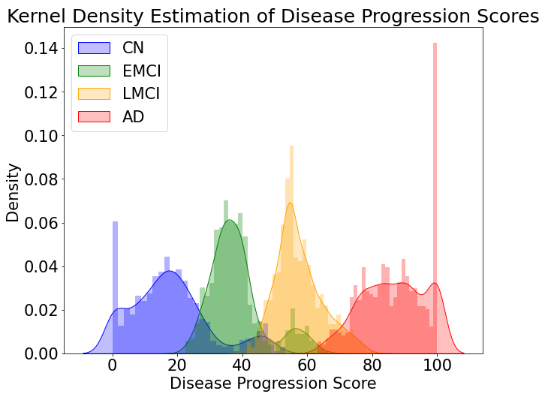
Descriptive statistics of the study population, including age, gender, and clinical group distributions, are detailed in Table 1.Our VAE model demonstrated excellent discriminative power in classifying Alzheimer’s disease progression stages. Ablation studies, presented in Table 2, showed that models incorporating all 116 features have ROC AUC values near 1, and outperform those using subsets of features. Specifically, models utilizing only cortical volumes were more predictive than those with only subcortical volumes, indicating the cortical measures’ greater relevance in AD progression. The high level performance is demonstrated in Figure 2, which displays a histogram of the fold-averaged DPS with minimal overlap between different clinical groups.
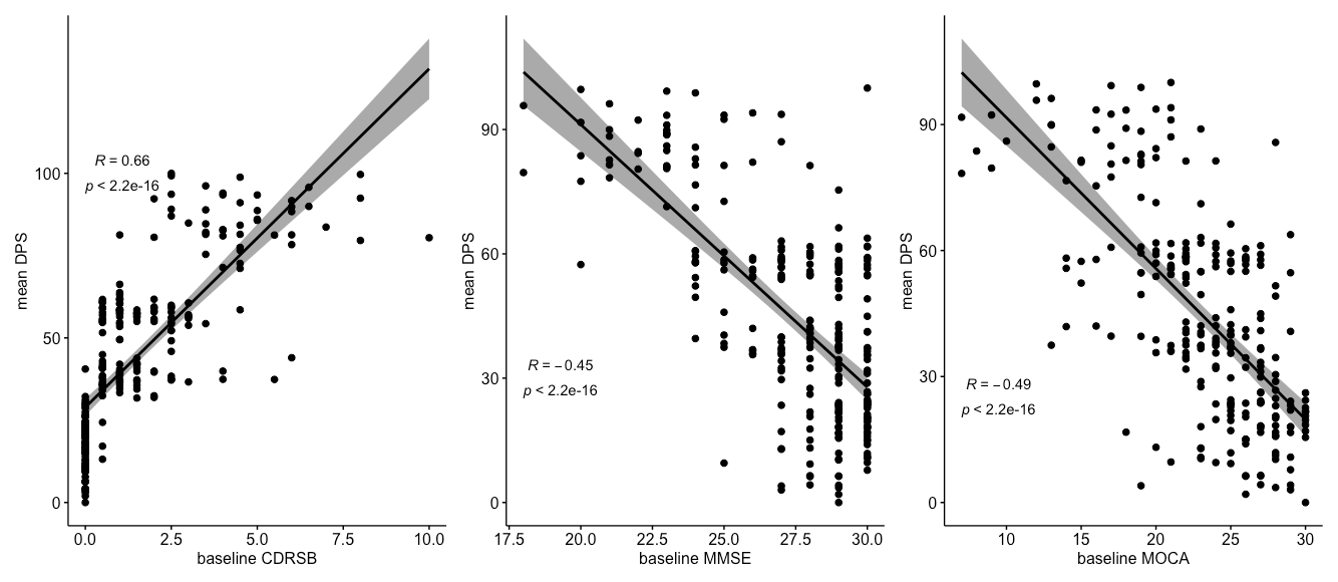
Crucially, the mean DPS showed a statistically significant correlation with cognitive assessments (p<0.01), with Kendall's Tau values of 0.66 for CDR-SB, -0.45 for MMSE, and -0.49 for MoCA. These correlations, illustrated in Figure 3, underscore the DPS’s validity as a quantitative biomarker for cognitive decline in Alzheimer’s disease.
Conclusion
The use of supervised VAEs effectively models the progression of Alzheimer’s disease brain atrophy on MRI and suggests their use as imaging biomarkers in clinical trials. The strong correlation between the DPS and cognitive assessments supports the potential of supervised VAEs to provide a quantifiable measure of AD severity that could be pivotal for clinical assessments and monitoring disease progression. The promising results from the ADNI dataset suggest that as more data becomes available, particularly longitudinal data, the predictive power and clinical relevance of the model are likely to improve. The study's methodology and findings contribute to the broader field of computational neuroscience and offer a foundation for future research aimed at early detection and personalized treatment strategies for Alzheimer's disease.Acknowledgements
No acknowledgement found.References
[1] Doersch, C. (2016). Tutorial on variational autoencoders. arXiv preprint arXiv:1606.05908.
[2] Petersen, R. C., Aisen, P. S., Beckett, L. A., Donohue, M. C., Gamst, A. C., Harvey, D. J., ... & Weiner, M. W. (2010). Alzheimer's disease neuroimaging initiative (ADNI): clinical characterization. Neurology, 74(3), 201-209.
[3] Fischl, B. (2012). FreeSurfer. Neuroimage, 62(2), 774-781.
[4] Kmetzsch, V., Becker, E., Saracino, D., Rinaldi, D., Camuzat, A., Le Ber, I., ... & PREV-DEMALS study group. (2022). Disease progression score estimation from multimodal imaging and microRNA data using supervised variational autoencoders. IEEE Journal of Biomedical and Health Informatics, 26(12), 6024-6035.
Figures