4706
Macromolecules from short echo time 7 Tesla brain 1HMRS as biomarkers of the Alzheimer’s disease continuum1Department of Neuroradiology, Charité – Universitätsmedizin Berlin, Berlin, Germany, 2Department of Neurology, Charité – Universitätsmedizin Berlin, Berlin, Germany, 3NeuroScience Clinical Research Center, Charité – Universitätsmedizin Berlin, Berlin, Germany, 4Physikalisch-Technische Bundesanstalt (PTB), Berlin, Germany, 5Institute for Applied Medical Informatics, University Hospital Hamburg-Eppendorf (UKE), Hamburg, Germany
Synopsis
Keywords: Diagnosis/Prediction, Spectroscopy
Motivation: To investigate the potential of macromolecule (MM) from 1HMRS as biomarkers for Alzheimer's Disease (AD).
Goal(s): Enhance the MRS-only diagnostic prediction for the AD continuum by incorporating MM data.
Approach: We predict the diagnosis of 143 individuals ranging from cognitively healthy to AD using only 1HMRS data, employing OPLSDA. We compare the model's performance with/without MM and validate the results with a second ML classifier. We also evaluate variable importance in classification.
Results: The inclusion of MM signals improves AD diagnosis prediction when OPLSDA is used. Various MM peaks contribute to the classification. However, the transitional stage of MCI cannot be accurately classified.
Impact: When combined with the appropriate method, MM signals can enhance the diagnosis of AD using MRS as a stand-alone marker, and important MM peaks belonging to the AD neurochemical fingerprint were identified.
Introduction
Magnetic Resonance Spectroscopy (MRS) is a non-invasive technique capable of providing insights into brain neurochemistry, potentially revealing biomarkers for diseases. Short echo-time MR spectra contain a background of broad signals, commonly referred to as macromolecules (MM), which stem from the resonance of amino acids in proteins. While these signals make metabolite quantification challenging, they might also contain valuable information that can serve as biomarkers for diseases1.Alzheimer’s Disease (AD) is the world’s primary cause of dementia and can only be reliably diagnosed with invasive methods. Moreover, metabolite changes in AD are subtle and, although multiple studies investigated the metabolite levels in AD there is not a wide consensus yet2.
Previously, we proposed an MM model enabling the quantification of both metabolites and the individual MM peaks3, which we applied to a dataset comprising spectra acquired from the posterior cingulate cortex (PCC) of individuals ranging from cognitively healthy controls (HC), over mild cognitive impairment (MCI) to AD4. Employing orthogonal projection to latent structure discriminant analysis (OPLSDA), we successfully differentiated HC from AD patients based solely on MRS data. Additionally, the variable importance in projection identified certain MM peaks as significant in the classification. However, for clinical relevance, the method must be capable of distinguishing not only HC and AD but also the transitional stage of MCI.
Hypothesizing that the MMs are a biomarker in AD, we characterize potential differences in the MM signals and test if including the MMs in a predictive model like OPLSDA improves the classification of the AD spectrum diagnosis compared to metabolites alone. Moreover, we aim to characterize a “fingerprint” of the three main diagnoses of the AD-spectrum. To do so, we use a one vs rest approach, where one diagnosis is classified against the other two. In this way, the variable importance in prediction (VIP) for each classification can be considered a molecular fingerprint of the diagnosis. Additionally, we will validate the OPLSDA classification with a further algorithm - Random Forest (RF) – which was used for AD classification with blood metabolites5.
Our hypotheses are the following: 1) OPLSDA can successfully classify the individual diagnosis along the AD spectrum. 2) The inclusion of MMs improves classification performance. 3) MMs play an important role in VIPs. 4) The classification of OPLSDA and RF are driven by the same features.
Method
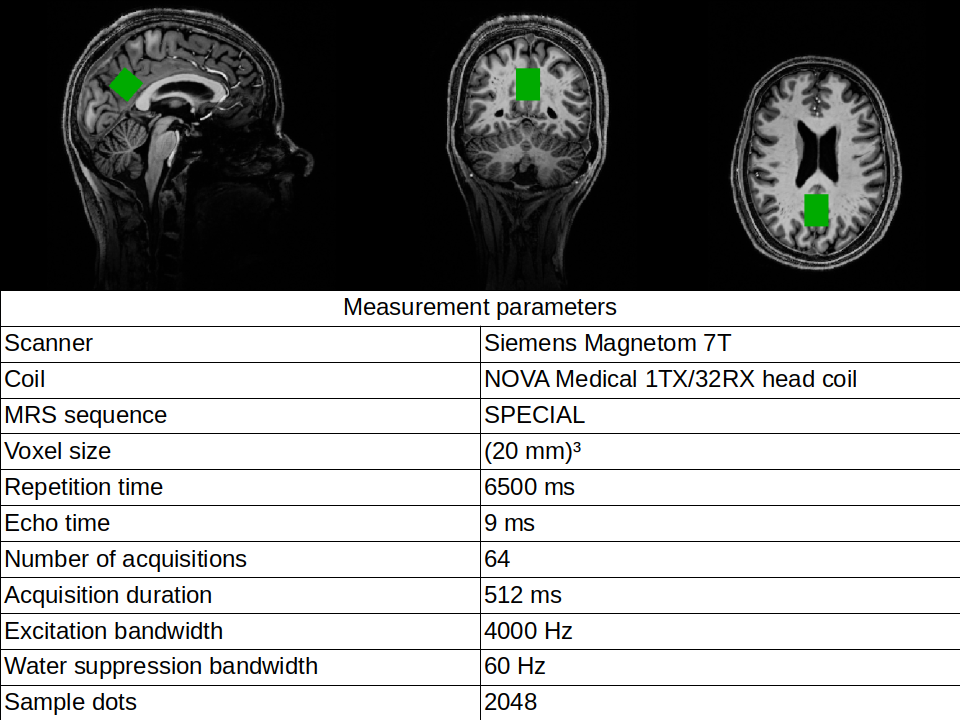
The study included 146 subjects: 72 HC, 31 MCI, and 43 AD. See Fig.1 for acquisition parameters. See our previous work3,4 for details on spectral preprocessing, LCModel fitting, and absolute quantification.We performed three classifications with both OPLSDA and RF, each with and without MM. Each classification underwent 100 Monte Carlo cross-validation cycles, using Cohen's kappa (κ) as the performance metric to account for the imbalance in the dataset.
Performance comparisons between MM inclusion/exclusion were made using paired sample t-tests, between the two methods with t-test. Bonferroni correction was applied.
Results and Discussion
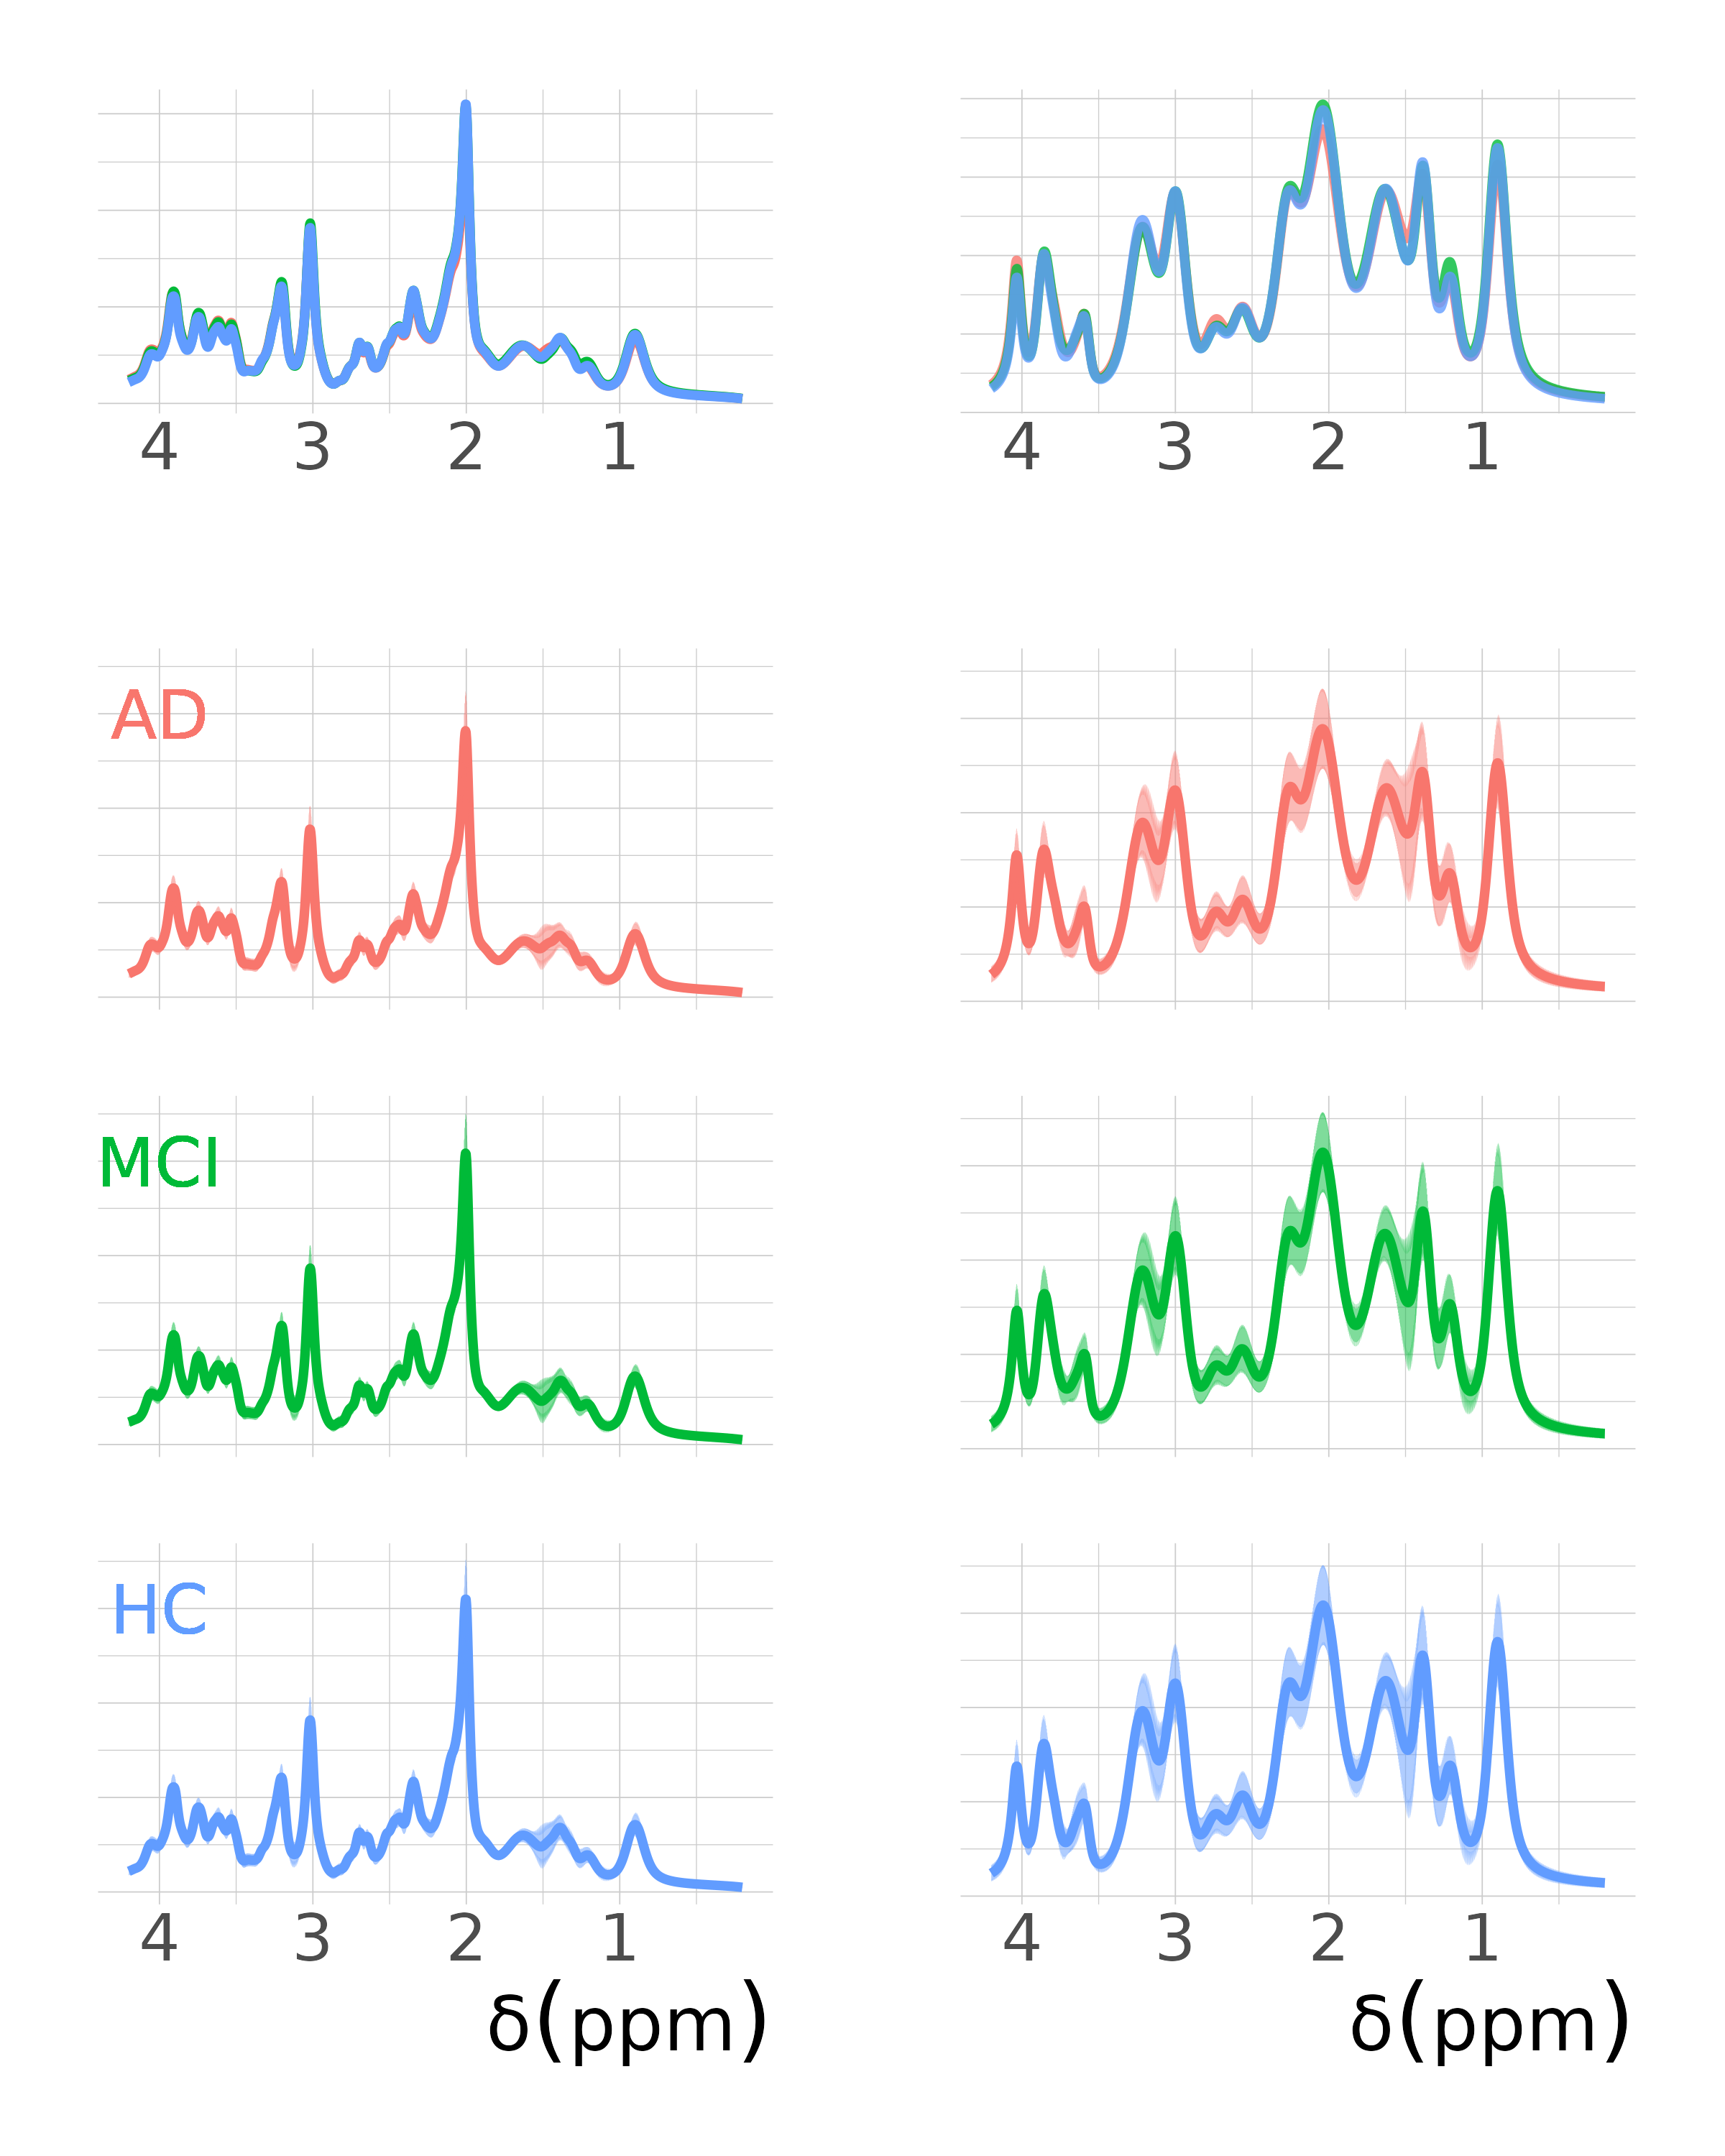
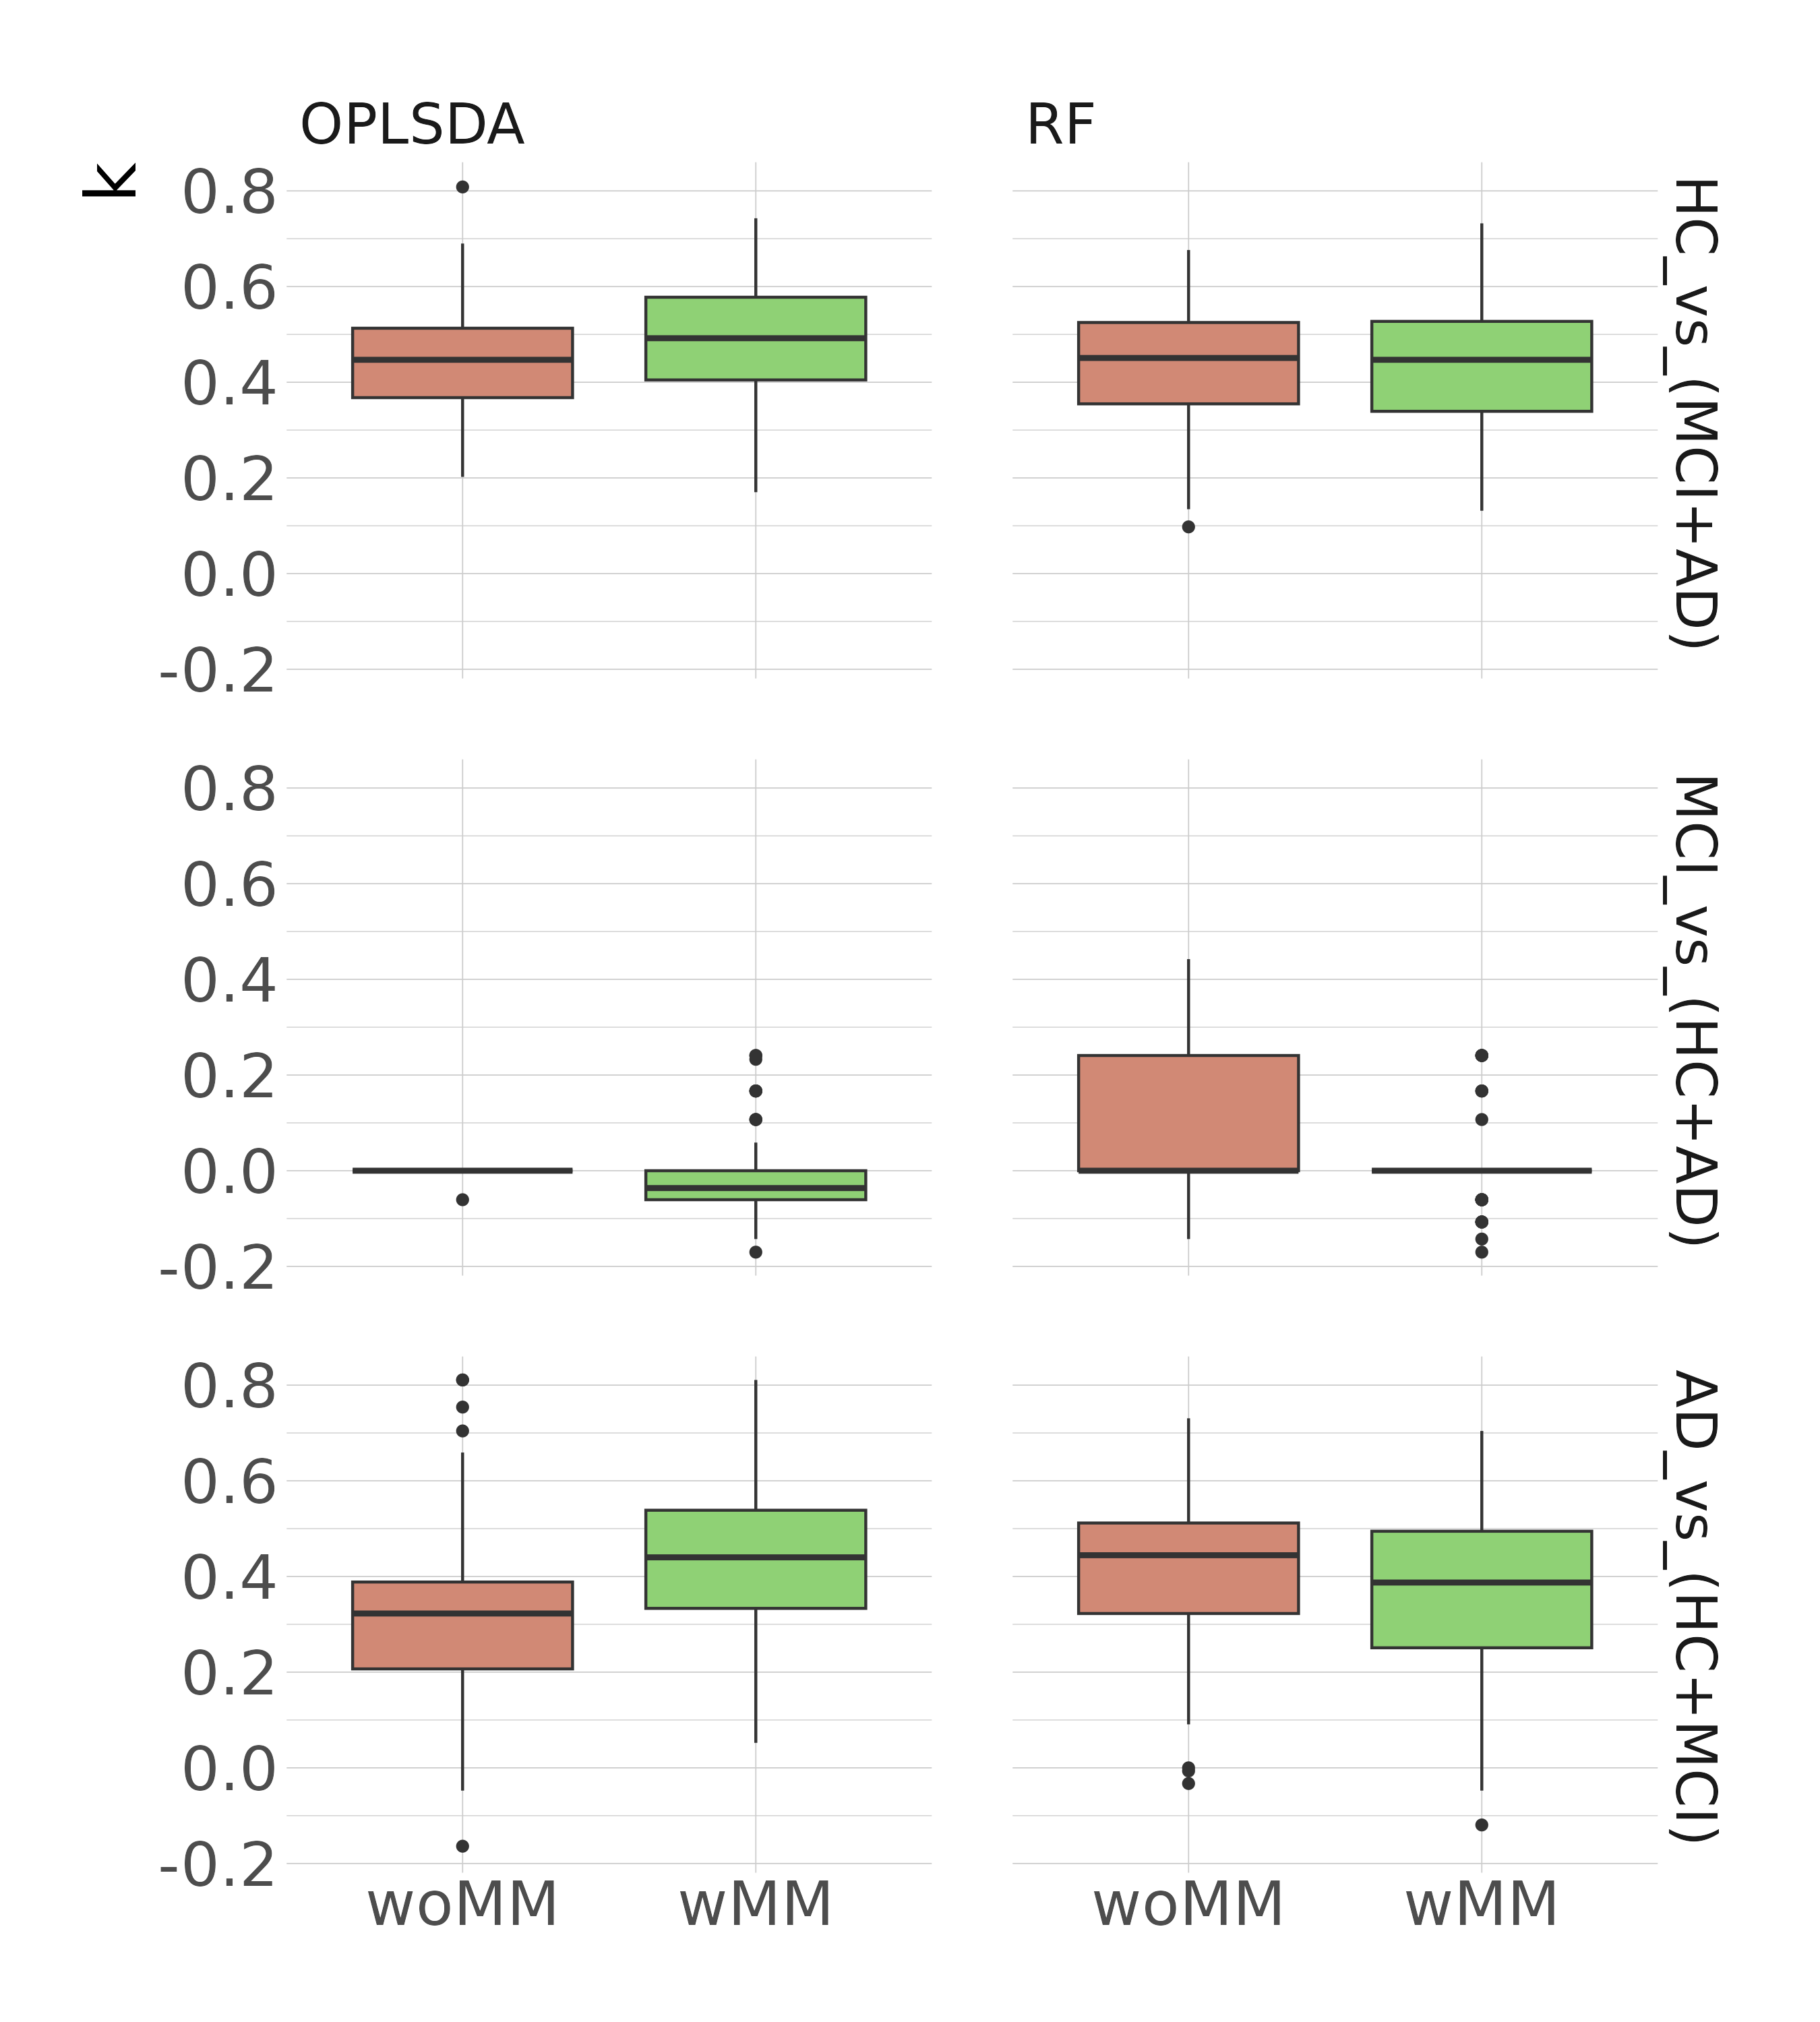
Averaged spectral MM signals for each diagnosis are shown in Fig.2. Classification performance metrics kappa are shown in Fig.3. For OPLSDA, we observed significantly improved k with MM inclusion in AD_vs_(HC+MCI) (padj≤0.0001) and HC_vs_(MCI+AD) (padj≤0.01). However, RF performs better without MMs in AD_vs_(HC+MCI) (padj≤0.05). OPLSDA performed worse than RF without MM (padj≤0.01) but outperformed RF with MM (padj≤0.05). This points out how the MM can help the classification; however, the classification method should also be able to handle noisy data.With both algorithms, the classification of MCI_vs_(HC+AD) showed very poor performance. This could be due to MCI's transitional nature, which shares characteristics with both preceding and subsequent stages. A further development for this classification challenge could involve the ortho-OPLSDA components as prediction correction parameters as in Bylesjö et al 20066.
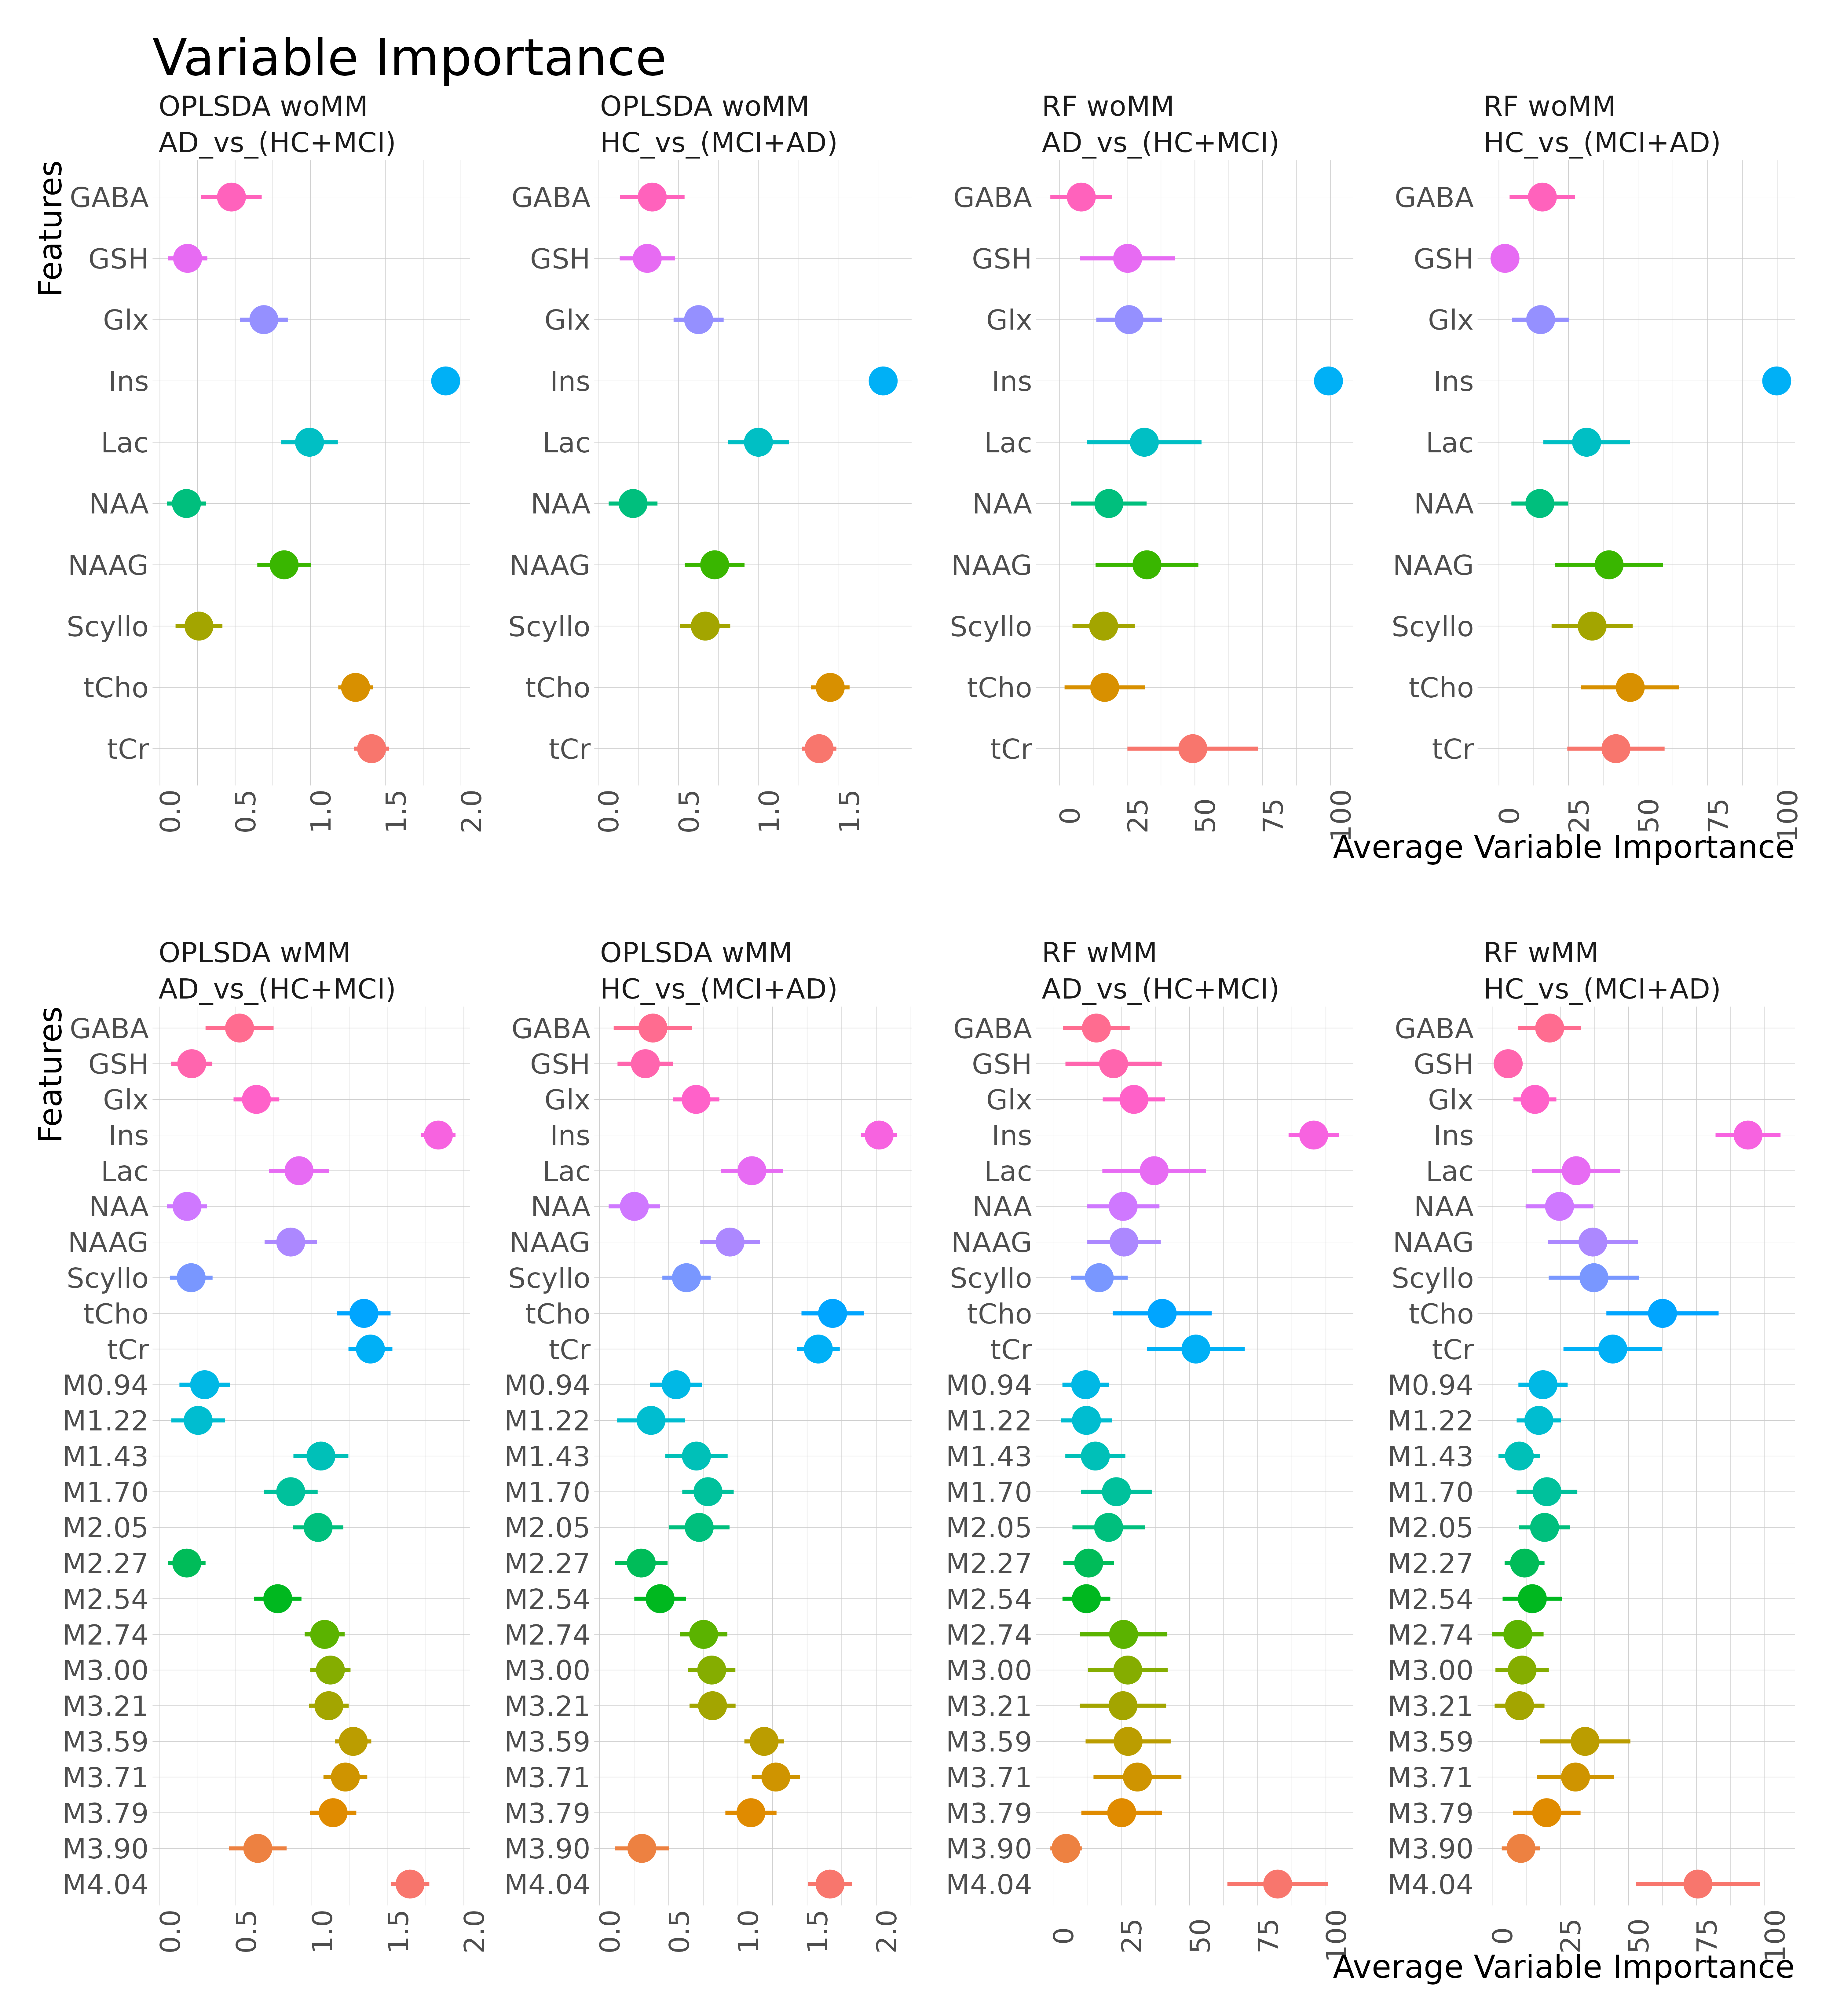
Variable importance for the classification is presented in Fig.4. RF generally aligns with OPLSDA's VIP, despite their differing approaches. Minor disparities exist between the VIP of HC_vs_(MCI+AD) and AD_vs_(HC+MCI) in both RF and OPLSDA. These variations refer either to potential MCI biomarkers or measurement uncertainties.
Conclusion
We can perform a machine-learning based classification of HC and AD from a dataset of patient diagnoses on the AD-spectrum, using only MRS-Data. The MMs do play a role in the classification, although the most important classifier is still a metabolite, namely myo-inositol. An improvement of the classification under inclusion of MMs was seen only with OPLSDA. Using another classification algorithm, RF, confirms essentially the VIP from OPLSDA.The MMs can be considered a biomarker for AD, however they must be used with prudence in the models choosing an appropriate classification method.
Acknowledgements
References
1. Cudalbu, C. et al. Contribution of macromolecules to brain 1 H MR spectra: Experts’ consensus recommendations. NMR Biomed 34, 1–24 (2021).
2. McKiernan, E., Su, L. & O’Brien, J. MRS in neurodegenerative dementias, prodromal syndromes and at-risk states: A systematic review of the literature. NMR Biomed (2023) doi:10.1002/NBM.4896.
3. Dell’Orco, A. et al, . Macromolecule modelling for improved metabolite quantification using very short echo time MRS at 3T: The PRaMM model. in ISMRM (2022).
4. Dell’Orco Andrea et al. Metabolomic fingerprinting of Alzheimer"s disease spectrum by brain proton MR spectroscopy. in ESMRMB (2023).
5. Stamate, D. et al. A metabolite-based machine learning approach to diagnose Alzheimer-type dementia in blood: Results from the European Medical Information Framework for Alzheimer disease biomarker discovery cohort. Alzheimer’s & Dementia: Translational Research & Clinical Interventions 5, 933–938 (2019).
6. Bylesjö, M. et al. OPLS discriminant analysis: Combining the strengths of PLS-DA and SIMCA classification. J Chemom 20, 341–351 (2006).
Figures