4703
Predicting cognitive performance at age 9 using multimodal MRI neuroimaging at age 71Human Biology, University of Cape Town, Cape Town, South Africa, 2Neuroscience Institute UCT, Cape Town, South Africa, 3Paediatrics and Child Health, Stellenbosch University, Family Centre for Research with Ubuntu, Cape Town, South Africa, 4Psychology, Acsent Lab, University of Cape Town, Cape Town, South Africa, 5A.A. Martinos Centre for Biomedical Imaging, Boston, MA, United States, 6Radiology, Harvard Medical School, Boston, MA, United States
Synopsis
Keywords: Diagnosis/Prediction, Multimodal
Motivation: The relationship between multimodal MRI neuroimaging and future cognitive performance of children from low-socioeconomic status backgrounds remains incompletely understood.
Goal(s): We aimed to predict cognitive performance at age 9 using multimodal MRI data of the same children at age 7.
Approach: We implemented 10-fold cross validated support vector machines and regression modelling on a combination of structural, diffusion, and spectroscopic MRI to predict continuous scores and categories of cognitive performance.
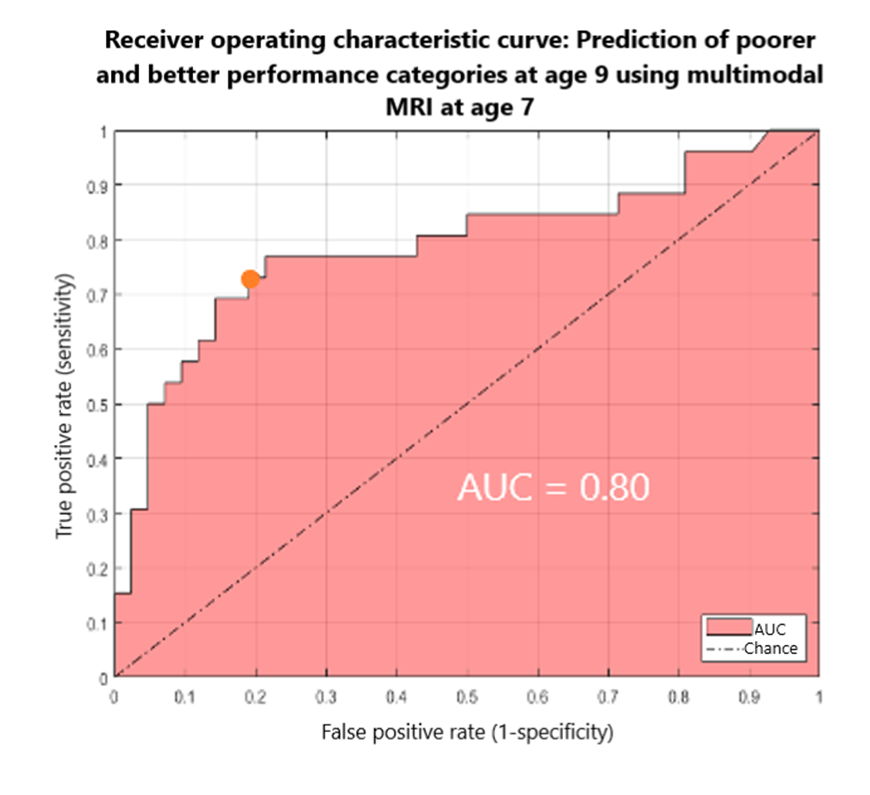
Results: We could predict whether children would fall into a poorer or better scoring category at age 9 with 76% accuracy, 81% specificity, and 72% sensitivity.
Impact: We demonstrate the ability to predict overall cognitive performance at age 9 from neuroimaging 2 years earlier. This could facilitate identification of at-risk children who may benefit the most from earlier targeted interventions.
Introduction
Children from low socio-economic status (SES) households and communities are at a risk of developmental delays1 and cognitive deficits which lead to high rates of school dropouts2. Therefore, the ability to predict future cognitive outcomes from neuroimaging or other methods could make it easier to identity at-risk children who may benefit the most from early targeted interventions. In this work, we aimed to predict cognitive performance of children from low-SES backgrounds at age 9 using cross-validated support vector machines and regression (SVMs and SVR) on a multimodal MRI dataset at age 7.Methods
Our study population comprised 127 children (64 female, 63 male) from low-SES backgrounds in Cape Town, South Africa. At age 7, we acquired structural MRI (sMRI; 1.3x1.0x1.0 mm3), diffusion tensor imaging (DTI; 2x2x2 m3), and single-voxel spectroscopy (1H-MRS; 1.5x1.5x1.5 cm3) in the midfrontal grey matter (MFGM) on a 3T Allegra scanner (Siemens, Erlangen) using acquisition parameters specified previously3-5.Automated cortical reconstruction and volumetric segmentation were performed on the structural T1-weighted dataset with FreeSurfer version 6.06. We computed sMRI cortical measures—thickness, area, mean curvature, volumes, and local gyrification index for each of the 68 regions of the Desikan-Kalliany atlas7. Additionally, 47 sMRI subcortical and other non-cortical regional and total volumes were included in the analyses. Motion and eddy current distortion corrections on the DTI dataset were done in Tortoise v.2.5.28. Voxel-wise diffusivity measures were calculated in AFNI9. We calculated average values of fractional anisotropy (FA) as well as mean, radial, and axial diffusivities (MD, RD, AD) for each of the 20 white matter tracts in the Johns Hopkins University (JHU) atlas10. The processing of MFGM 1H-MRS data was performed using LCModel version 6.111. We calculated the absolute concentrations of 11 metabolites and their ratios to total creatine (CrPCr): creatine (Cr), phosphocreatine (PCr), glutamate (Glu), myo-inositol (Ins), N-acetylaspartate (NAA), choline (Cho), phosphocholine, total choline, glutamate plus glutamine, N-acetylaspartylglutamate plus N-acetylaspartate, and CrPCr. In total, 489 imaging features were included as predictors in the models.
At age 9, all participants were administered a battery of standardised cognitive tests, including the Kauffman battery for children, Purdue pegboard test, Peabody picture vocabulary test, semantic fluency test, test of variables of attention, and Beery-Buktenica developmental test of visual-motor integration. These tests assessed 7 domains of learning, namely auditory working memory, short-term memory (attention), psychomotor integration, working memory (executive function), language, and motor control, which have been shown to share a bidirectional link with children’s academic skills12.
We used 10-fold cross-validated (CV) support vector regression (SVR) modelling to predict the 7 individual cognitive domain scores. Regression performance was assessed via 10-fold CV SVR errors, coefficient of determination, and Pearson’s r between predicted and actual values. We further used hierarchical clustering algorithm to group the children into performance categories based on overall cognitive performance, represented by a 7-element vector corresponding to each domain. We identified 2 main clusters of poorer and better scoring children, which were used for classification. Sensitivity, specificity, and area under the receiver operating characteristic curve (AUC) were obtained for the 10-fold CV SVM classification models. Relevant features in the models were identified with SVM recursive feature elimination (SVM-RFE).
Results
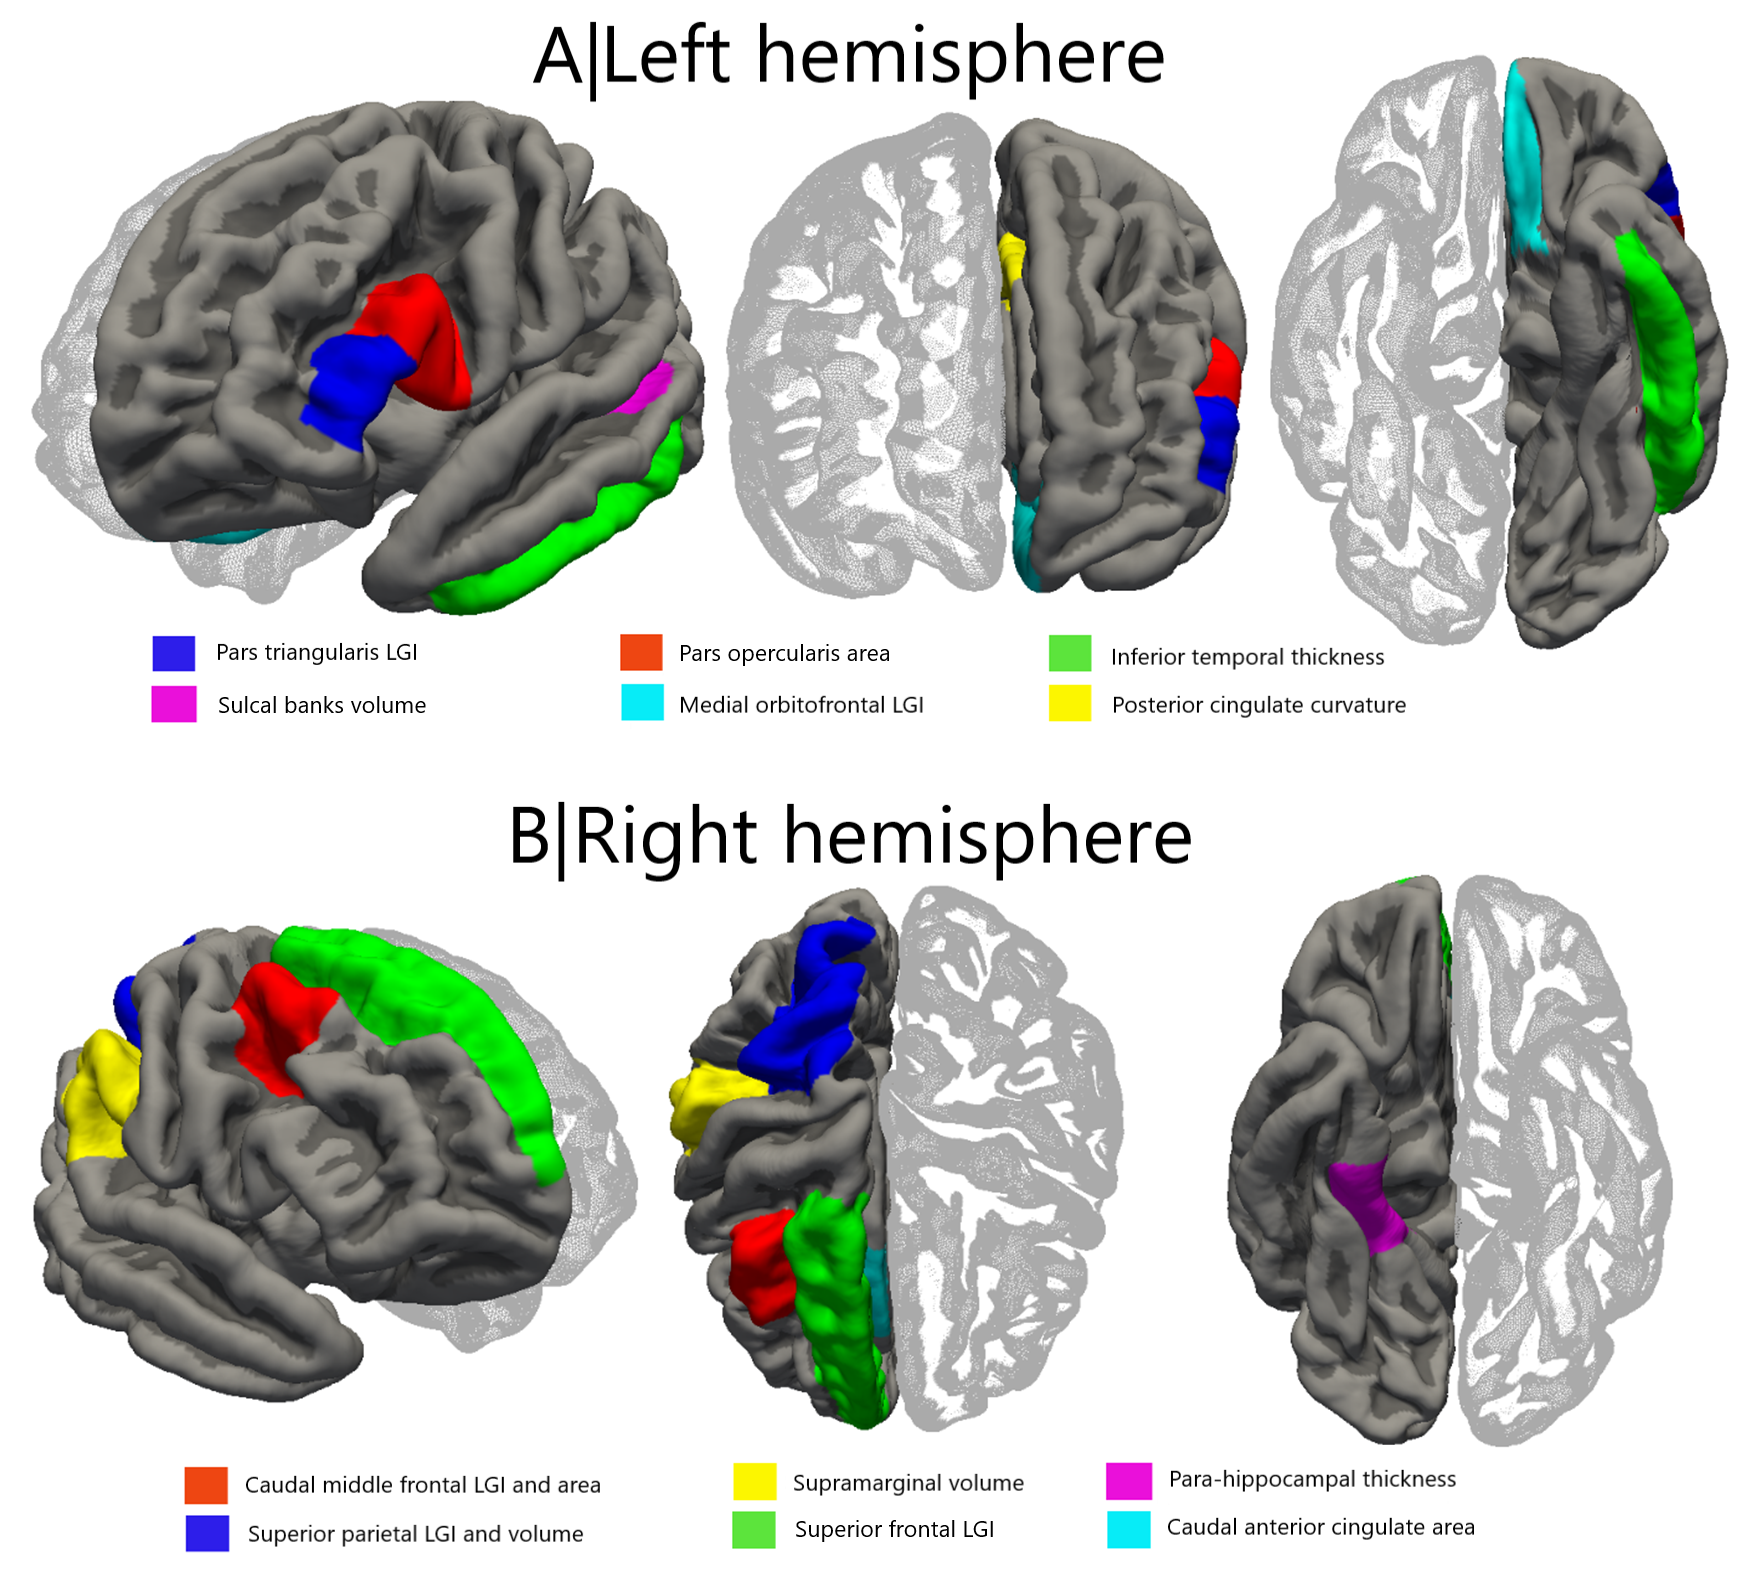
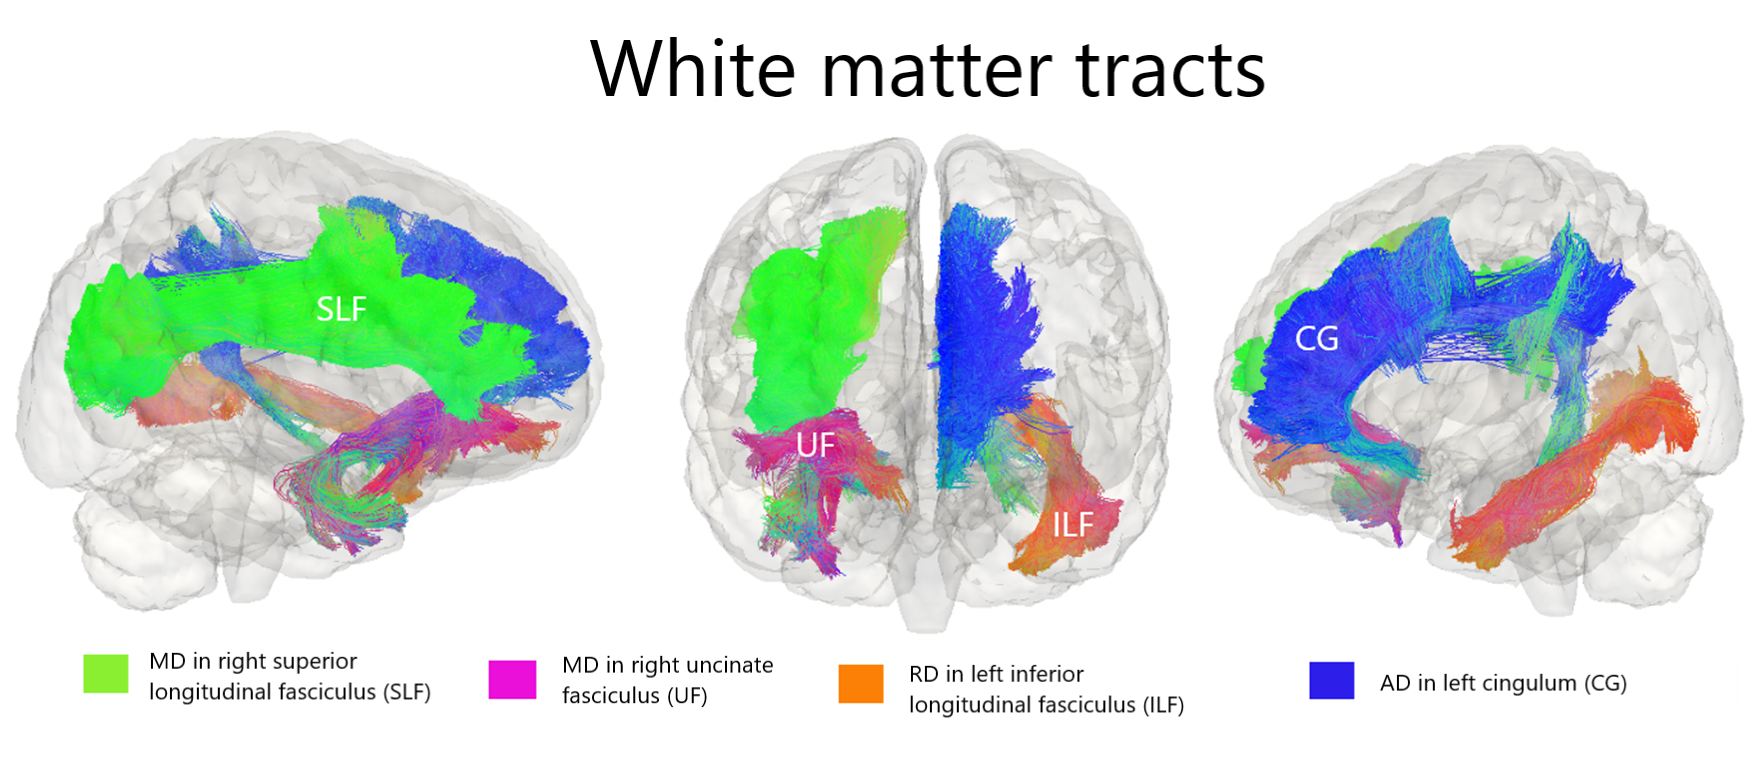
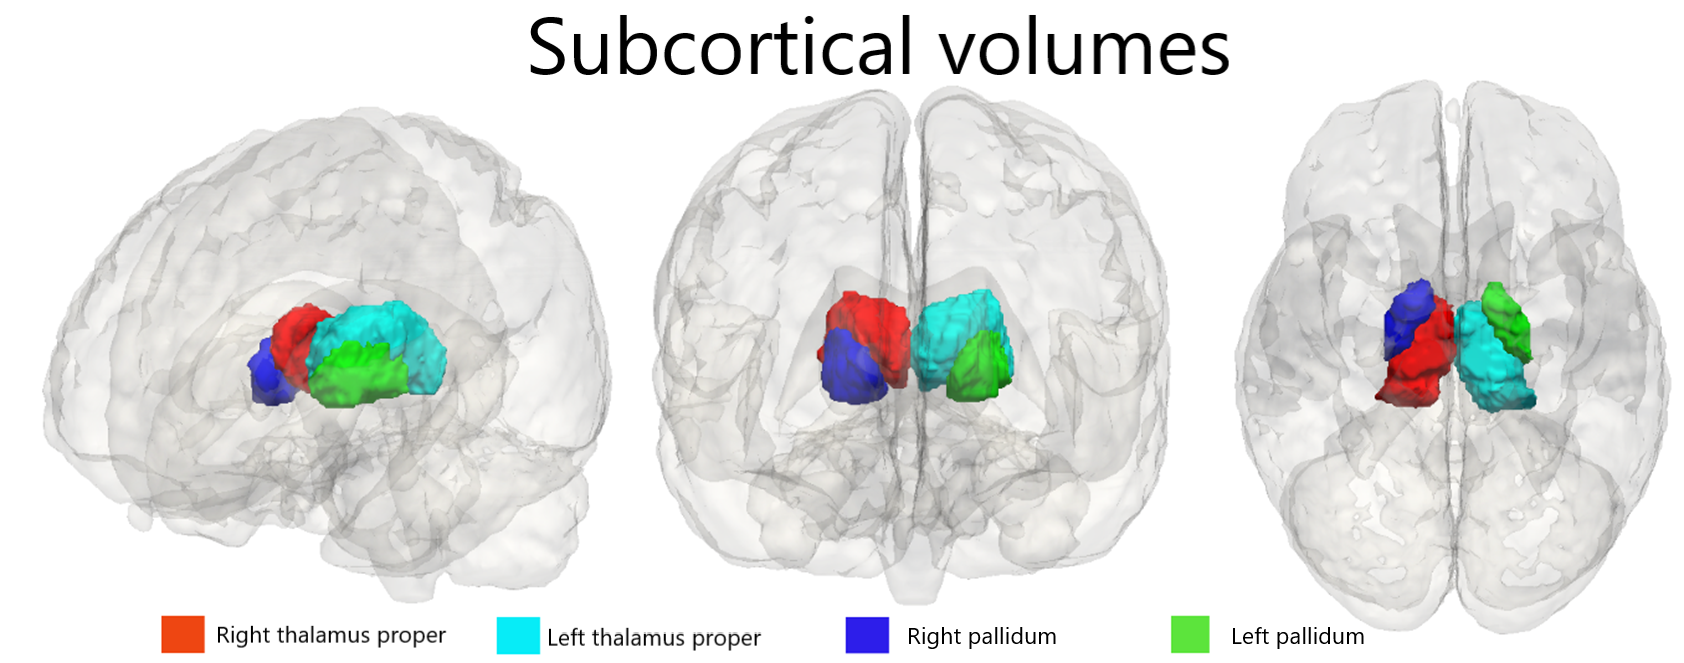
Prediction of the individual cognitive domain scores resulted in poor regression performance, characterised by high generalised errors and weak Pearson’s correlation between actual and predicted values. However, using multimodal MRI at age 7 we could predict whether the children would be in the poorer or better performance category at age 9 with 81% specificity, 72% sensitivity, 76% accuracy, and 0.80 AUC (Figure 1). Using SVM-RFE, we identified 27 relevant features out of 489 imaging predictors. Fourteen cortical measures (Figure 2), 4 diffusivity measures (Figure 3), 4 subcortical volumes (Figure 4), and concentrations of Cr, PCr, Glu, Cho, and NAA in midfrontal GM contributed to the prediction of categories of overall cognitive performance.Discussion
Consistent with previous studies that have predicted cognition from cortical measures13,14,15, we identified many cortical morphology related biomarkers of future cognitive performance. It is well known that higher level processes such as thought, reasoning, language, and memory are associated with cortical measures. However, predictors from diffusion MRI and MR spectroscopy were also present in our models. These modalities are rarely studied for predicting paediatric cognitive performance16,17.Conclusion
Notwithstanding the small sample size, this study suggests multimodal MRI can be a useful technique to predict future cognitive performance. Using more training data, adding more time-points, adding functional MRI to the current multimodal MR imaging, and exploring different ways of feature construction and implementing deep learning models all have potential to further improve performance accuracy.Acknowledgements
We would like to acknowledge the MRI Research team, CUBIC staff, participants and their parents/caregivers. The project was funded via the UCT Accelerated Transformation of the Academic Program Scholarship, NRF/DST South African Research Chairs Initiative (UID 48337, 120140), NIH grants R01HD099846, R01DC015984, R21MH108346, R01HD071664, R21MH096559, U19 AI53217, R01MH105134, NRF grant CPR20110614000019421 (UID 99069, 78737), South African Medical Research Council (SAMRC), and UCT University Research CommitteeReferences
1. Rakesh, D., Whittle, S., Sheridan, M. A., & McLaughlin, K. A. (2023). Childhood socioeconomic status and the pace of structural neurodevelopment: accelerated, delayed, or simply different?. Trends in cognitive sciences, 27(9), 833–851. https://doi.org/10.1016/j.tics.2023.03.011
2. David, W., Gerry, M., Michael, S., & Gillian, A. (2019). Relationship between childhood socioeconomic position and adverse childhood experiences (ACEs): a systematic review. Journal of Epidemiology and Community Health, 73(12), 1087. https://doi.org/10.1136/jech-2019-212738
3. Nwosu, E. C., Robertson, F. C., Holmes, M. J., Cotton, M. F., Dobbels, E., Little, F., Laughton, B., van der Kouwe, A., & Meintjes, E. M. (2018). Altered brain morphometry in 7-year old HIV-infected children on early ART. Metabolic brain disease, 33(2), 523–535. https://doi.org/10.1007/s11011-017-0162-6
4. Jankiewicz, M., Holmes, M. J., Taylor, P. A., Cotton, M. F., Laughton, B., van der Kouwe, A. J. W., & Meintjes, E. M. (2017). White Matter Abnormalities in Children with HIV Infection and Exposure. Frontiers in neuroanatomy, 11, 88. https://doi.org/10.3389/fnana.2017.00088
5. Robertson, F. C., Holmes, M. J., Cotton, M. F., Dobbels, E., Little, F., Laughton, B., van der Kouwe, A. J. W., & Meintjes, E. M. (2018). Perinatal HIV Infection or Exposure Is Associated With Low N-Acetylaspartate and Glutamate in Basal Ganglia at Age 9 but Not 7 Years. Frontiers in human neuroscience, 12, 145. https://doi.org/10.3389/fnhum.2018.00145
6. Fischl, B., Salat, D. H., Busa, E., Albert, M., Dieterich, M., Haselgrove, C., van der Kouwe, A., Killiany, R., Kennedy, D., Klaveness, S., Montillo, A., Makris, N., Rosen, B., & Dale, A. M. (2002). Whole brain segmentation: automated labeling of neuroanatomical structures in the human brain. Neuron, 33(3), 341–355. https://doi.org/10.1016/s0896-6273(02)00569-x
7. Desikan, R. S., Ségonne, F., Fischl, B., Quinn, B. T., Dickerson, B. C., Blacker, D., Buckner, R. L., Dale, A. M., Maguire, R. P., Hyman, B. T., Albert, M. S., & Killiany, R. J. (2006). An automated labeling system for subdividing the human cerebral cortex on MRI scans into gyral based regions of interest. NeuroImage, 31(3), 968–980. https://doi.org/10.1016
8. Pierpaoli, C., Walker, L., Irfanoglu, M. O., Barnett, A., Basser, P., Chang, L. C., ... & Wu, M. (2010, May). TORTOISE: an integrated software package for processing of diffusion MRI data. In ISMRM 18th annual meeting (Vol. 1597). Stockholm.
9. Cox, R. W. (1996). AFNI: software for analysis and visualization of functional magnetic resonance neuroimages. Computers and Biomedical research, 29(3), 162-173.
10. Oishi, K., Zilles, K., Amunts, K., Faria, A., Jiang, H., Li, X., ... & Mori, S. (2008). Human brain white matter atlas: identification and assignment of common anatomical structures in superficial white matter. Neuroimage, 43(3), 447-457.
11. Provencher, S. W. (2001). Automatic quantitation of localized in vivo 1H spectra with LCModel. NMR in Biomedicine: An International Journal Devoted to the Development and Application of Magnetic Resonance In Vivo, 14(4), 260-264.
12. Lovden, M., Fratiglioni, L., Glymour, M. M., Lindenberger, U., & Tucker-Drob, E. M. (2020). Education and Cognitive Functioning Across the Life Span. Psychol Sci Public Interest, 21(1), 6-41. https://doi.org/10.1177/1529100620920576
13. Adeli, E., Meng, Y., Li, G., Lin, W., & Shen, D. (2019). Multi-task prediction of infant cognitive scores from longitudinal incomplete neuroimaging data. Neuroimage, 185, 783-792. https://doi.org/10.1016/j.neuroimage.2018.04.052
14. Khundrakpam, B., Booij, L., Jeon, S., Karama, S., Tohka, J., & Evans, A. C. (2022). Individualized prediction of future cognition based on developmental changes in cortical anatomy. Neuroimage: Reports, 2(4), 100127. https://doi.org/https://doi.org/10.1016/j.ynirp.2022.100127
15. Yao, J. K., Voorhies, W. I., Miller, J. A., Bunge, S. A., & Weiner, K. S. (2023). Sulcal depth in prefrontal cortex: a novel predictor of working memory performance. Cereb Cortex, 33(5), 1799-1813. https://doi.org/10.1093/cercor/bhac173
16. Sui, J., Jiang, R., Bustillo, J., & Calhoun, V. (2020). Neuroimaging-based Individualized Prediction of Cognition and Behavior for Mental Disorders and Health: Methods and Promises. Biol Psychiatry, 88(11), 818-828. https://doi.org/10.1016/j.biopsych.2020.02.016
17. Vieira, B. H., Pamplona, G. S. P., Fachinello, K., Silva, A. K., Foss, M. P., & Salmon, C. E. G. (2022). On the prediction of human intelligence from neuroimaging: A systematic review of methods and reporting. Intelligence, 93, 101654. https://doi.org/https://doi.org/10.1016/j.intell.2022.101654
Figures