4702
Towards Prediction of Motion Affected Spectra for MRSI at 7T1High Field MR Center, Department of Biomedical Imaging and Image-guided Therapy, Medical University of Vienna, Vienna, Austria, 2Christian Doppler Laboratory for Clinical Molecular MR Imaging, Vienna, Austria, 3University of Calgary, Calgary, AB, Canada, 4Athinoula A. Martinos Center for Biomedical Imaging, Massachusetts General Hospital, Boston, MA, United States, 5Department of Radiology, Massachusetts General Hospital, Harvard Medical School, Boston, MA, United States, 6Computational Imaging Research Lab - Department of Biomedical Imaging and Image-guided Therapy, Medical University of Vienna, Vienna, Austria, 7Medical University of Vienna, Vienna, Austria
Synopsis
Keywords: Analysis/Processing, Machine Learning/Artificial Intelligence, Motion, MRSI, Brain, Quality assurance
Motivation: Quality assessment of whole-brain MRSI spectra is usually based on post-quantification analyses, which does not reflect if the estimated metabolite concentration is true.
Goal(s): Simulate effects of subject motion for the raw non-Cartesian MRSI kSpace data. Build a dataset of motion-corrupted MRSI data with a corresponding ground truth version. Train a classifier to assess the quality of MRSI data.
Approach: Translations and rotations were simulated in the kSpace domain. A classifier is trained in a supervised fashion with the thresholded deviation between the motion-affected and original data as the target.
Results: The classifier outperforms the CRLBs in the quality assessment of MRSI data.
Impact: Simulation of subject motion effects on raw non-Cartesian kSpace MRSI data allows us to assess the quality of MRSI spectra and can lead us toward the understanding of lipid artifacts, which is the main limiting factor of MRSI.
Introduction
Performing Magnetic Resonance Spectroscopic Imaging (MRSI) presents certain challenges(1), such as long measurement times, during which patients may unintentionally move. This results in motion artifact but also increases lipid contamination, thus decreasing spectral quality(2). Typically, quality assessment relies on post-quantification metrics like Cramer-Rao Lower Bound (CRLBs), SNR or FWHM(3). However, those metrics do not adequately account for the changes in estimated concentrations caused by subject motion.To address this issue, we propose a neural network (NN) to predict motion-affected spectra, trained on a simulation model that introduces motion effects to the raw non-Cartesian k-Space data for in vivo MRSI data.
Methods
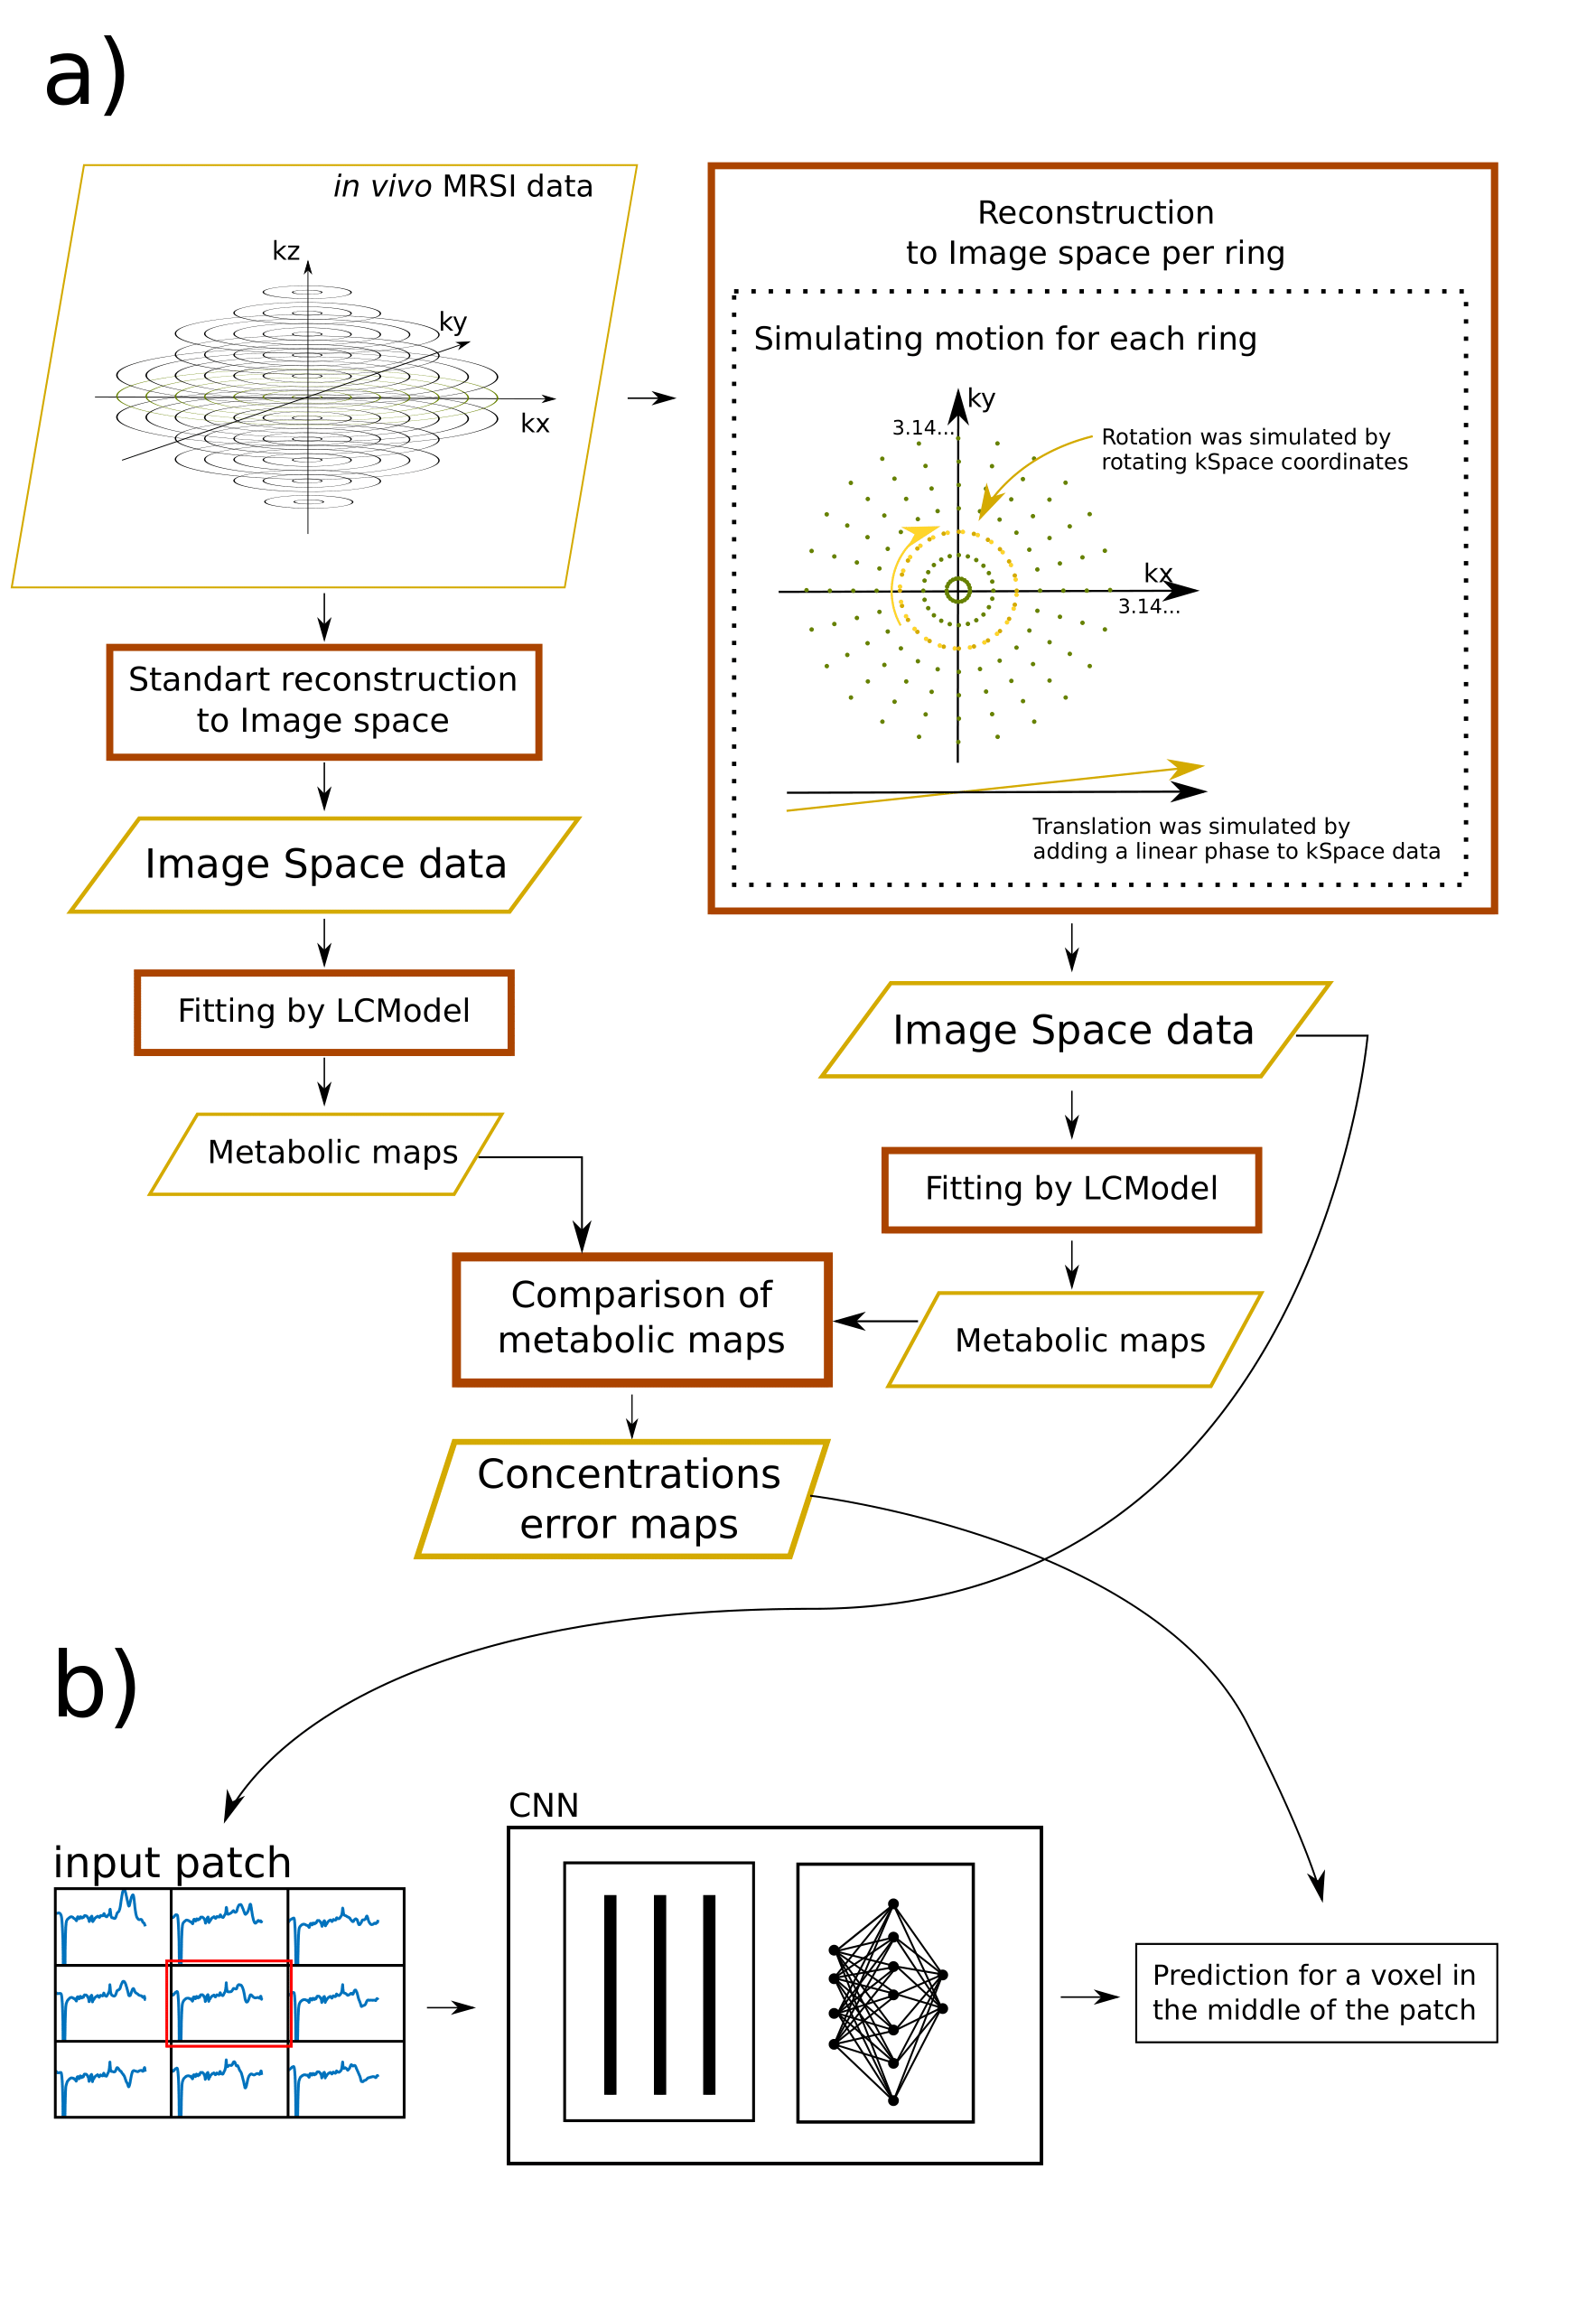
MRSI data from 8 healthy subjects, scanned using a 7T Magnetom-Dot-Plus MR scanner (Siemens Healthineers, Erlangen, Germany) with a 32-channel head coil (Nova Medical), were acquired. A 3D-CRT-MRSI sequence was used (TR: 300ms, TE: 1.3ms, FOV: 220x220x133mm, Resolution: 6.8x6.8x8.0mm, and TA: 1:52minutes).Motion logs from [http://34.88.15.16/webapps/home/session.html?app=BrainMRIMotionDB] were utilized. A 2 minute block was randomly chosen from the motion logs, and the TR raster of the MRSI sequence was used to extract time positions from the logs. Translations and rotations were introduced in the k-space domain through linear phases and rotations of the k-space coordinates.
For each in vivo MRSI dataset, 25 cases were simulated with unique motion logs, resulting in 200 3D-MRSI datasets. MRSI datasets generated from 3 subjects were retained for evaluation. The remaining data were used for training. The original and the MRSI data changed by the simulation were fitted with LCModel(4). CRLBs of tNAA and tCr of 20% were applied as quality criteria to fitted spectra, and concentration error maps were generated by comparing tNAA/tCr maps between the motion-corrupted and uncorrupted cases.
An NN was trained to predict whether the given spectra were affected by the (simulated) motion based on the spatial patch. The desired prediction was defined by the thresholded concentration error maps with a difference of <10%. Each instance's input was a 4D tensor, with two dimensions designated for the x- and y-dimensions of the MRSI data, the third dimension reserved for spectra, and the fourth dimension being the real and imaginary parts of the spectra. The NN consisted of two parts: a feature detector composed of three 3D convolutional layers, all of which had an extended kernel in the time dimension (size 3x3x14), and a classifier consisting of three fully-connected layers. A leaky ReLu activation was used after all layers except the last, where a Sigmoid activation was applied. The NN was trained for 1000 epochs, with the Adam optimizer (learning rate 0.0005) and the binary cross-entropy loss function. The method is summarized in Figure 1.
The NN was evaluated on the test cases, and NN classification maps were generated. The accuracy of the NN was estimated for each simulated case with the three test subjects.
Results
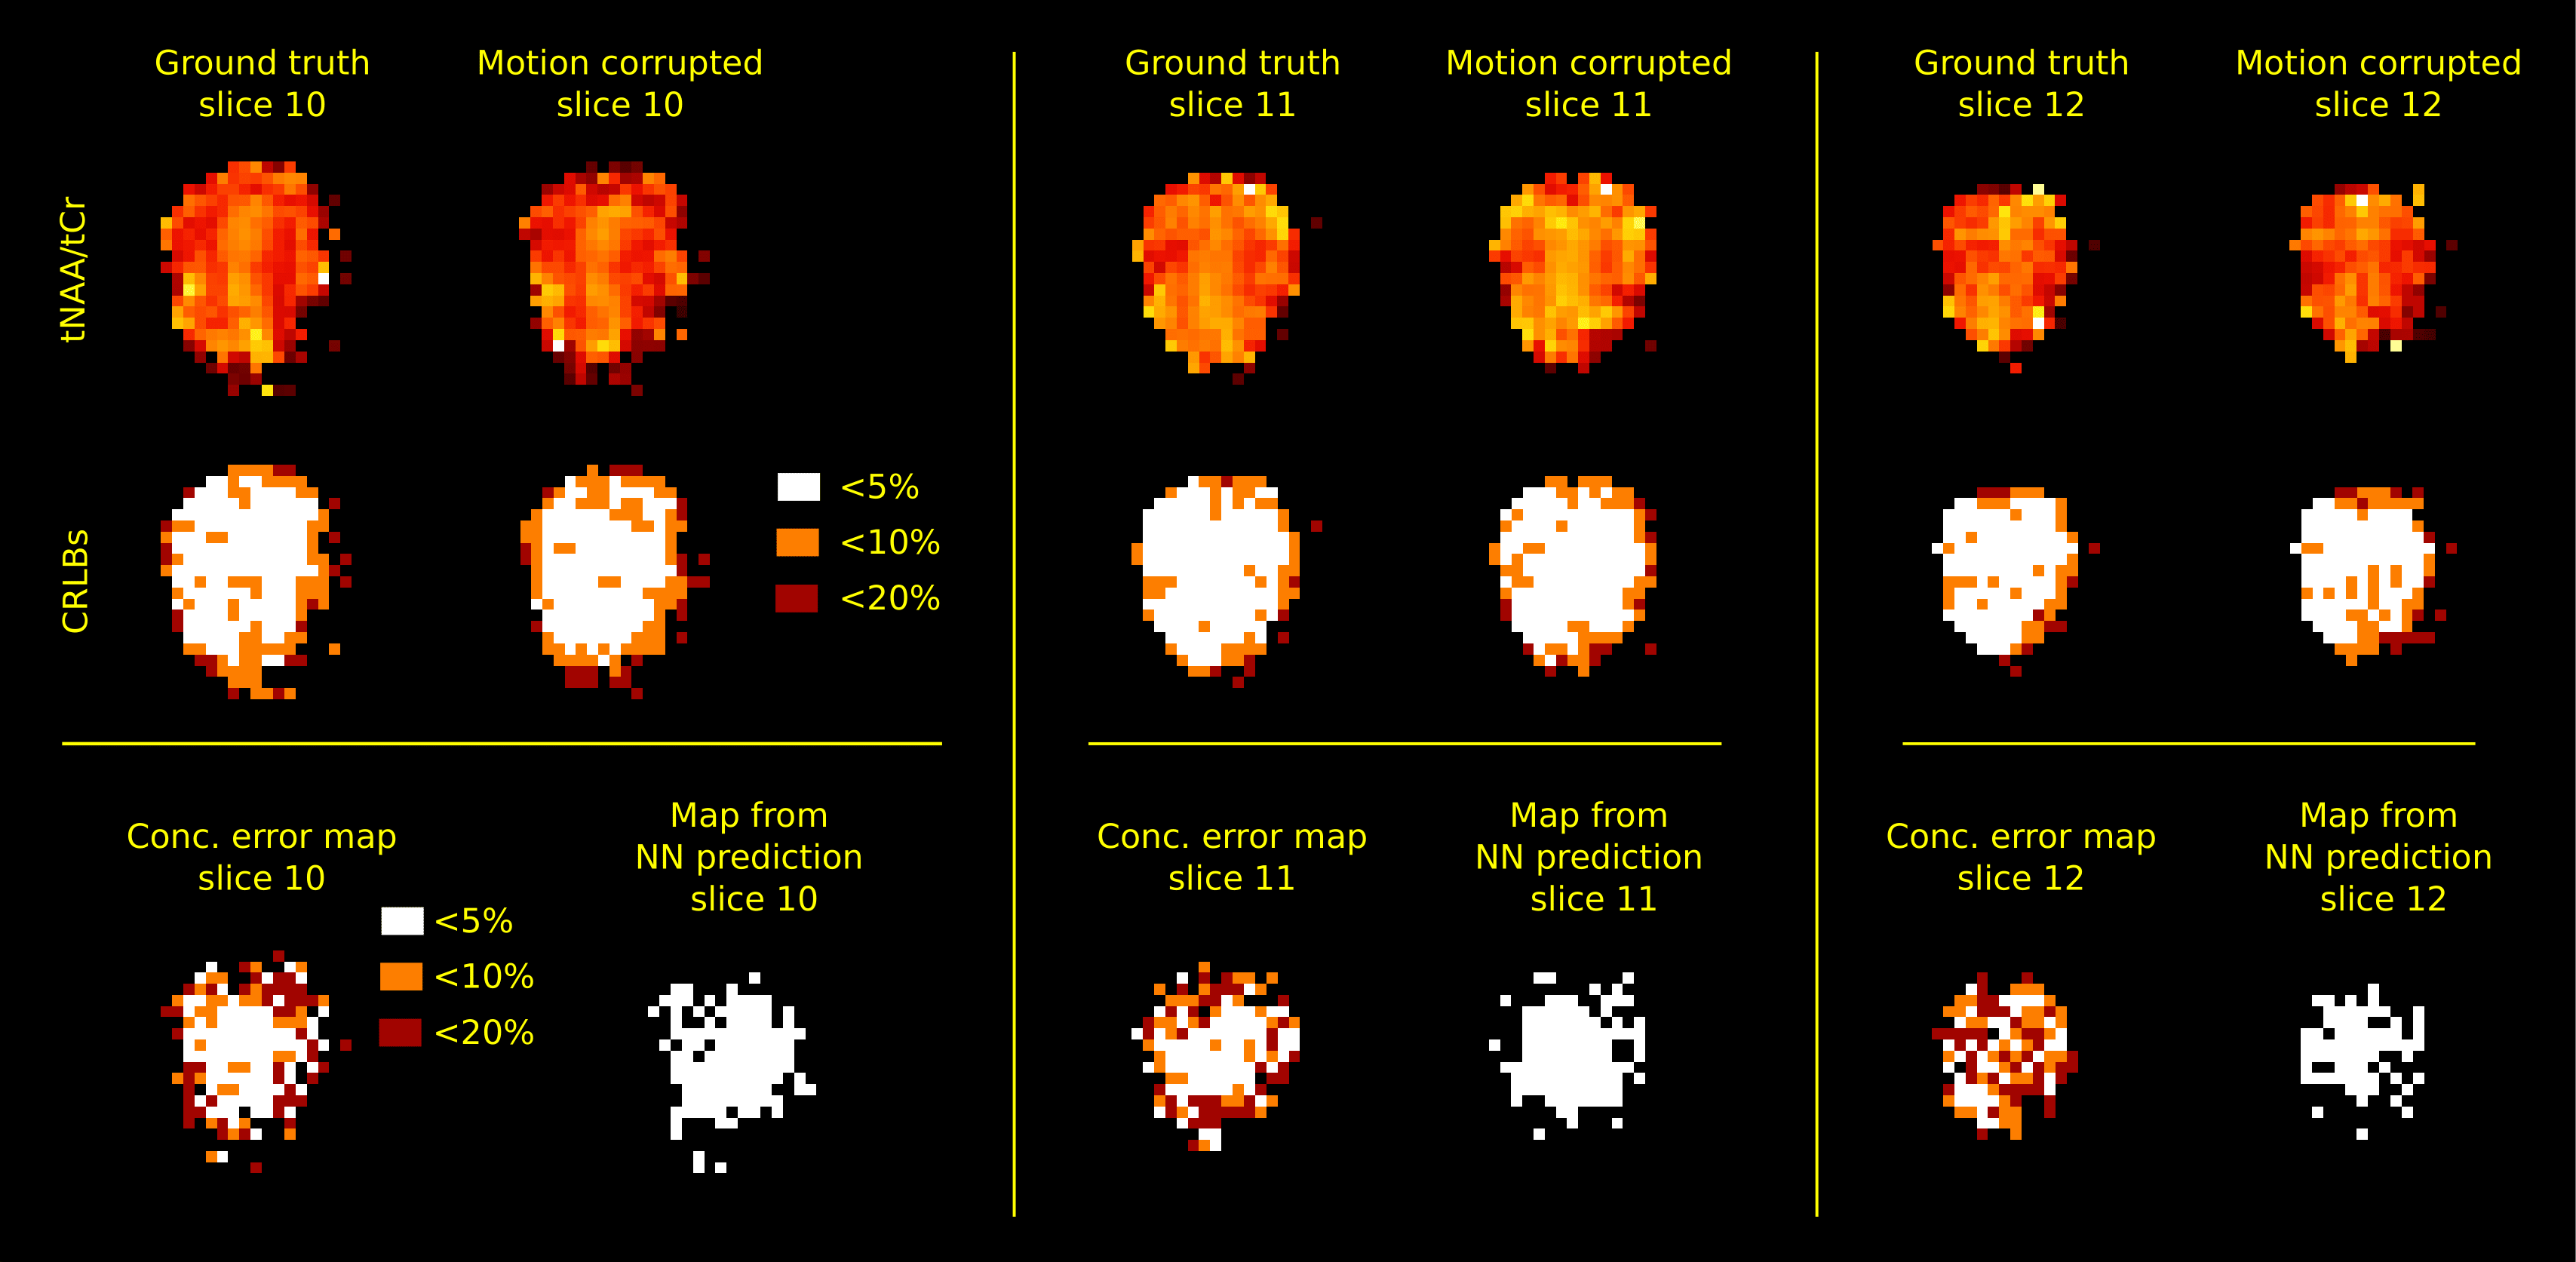
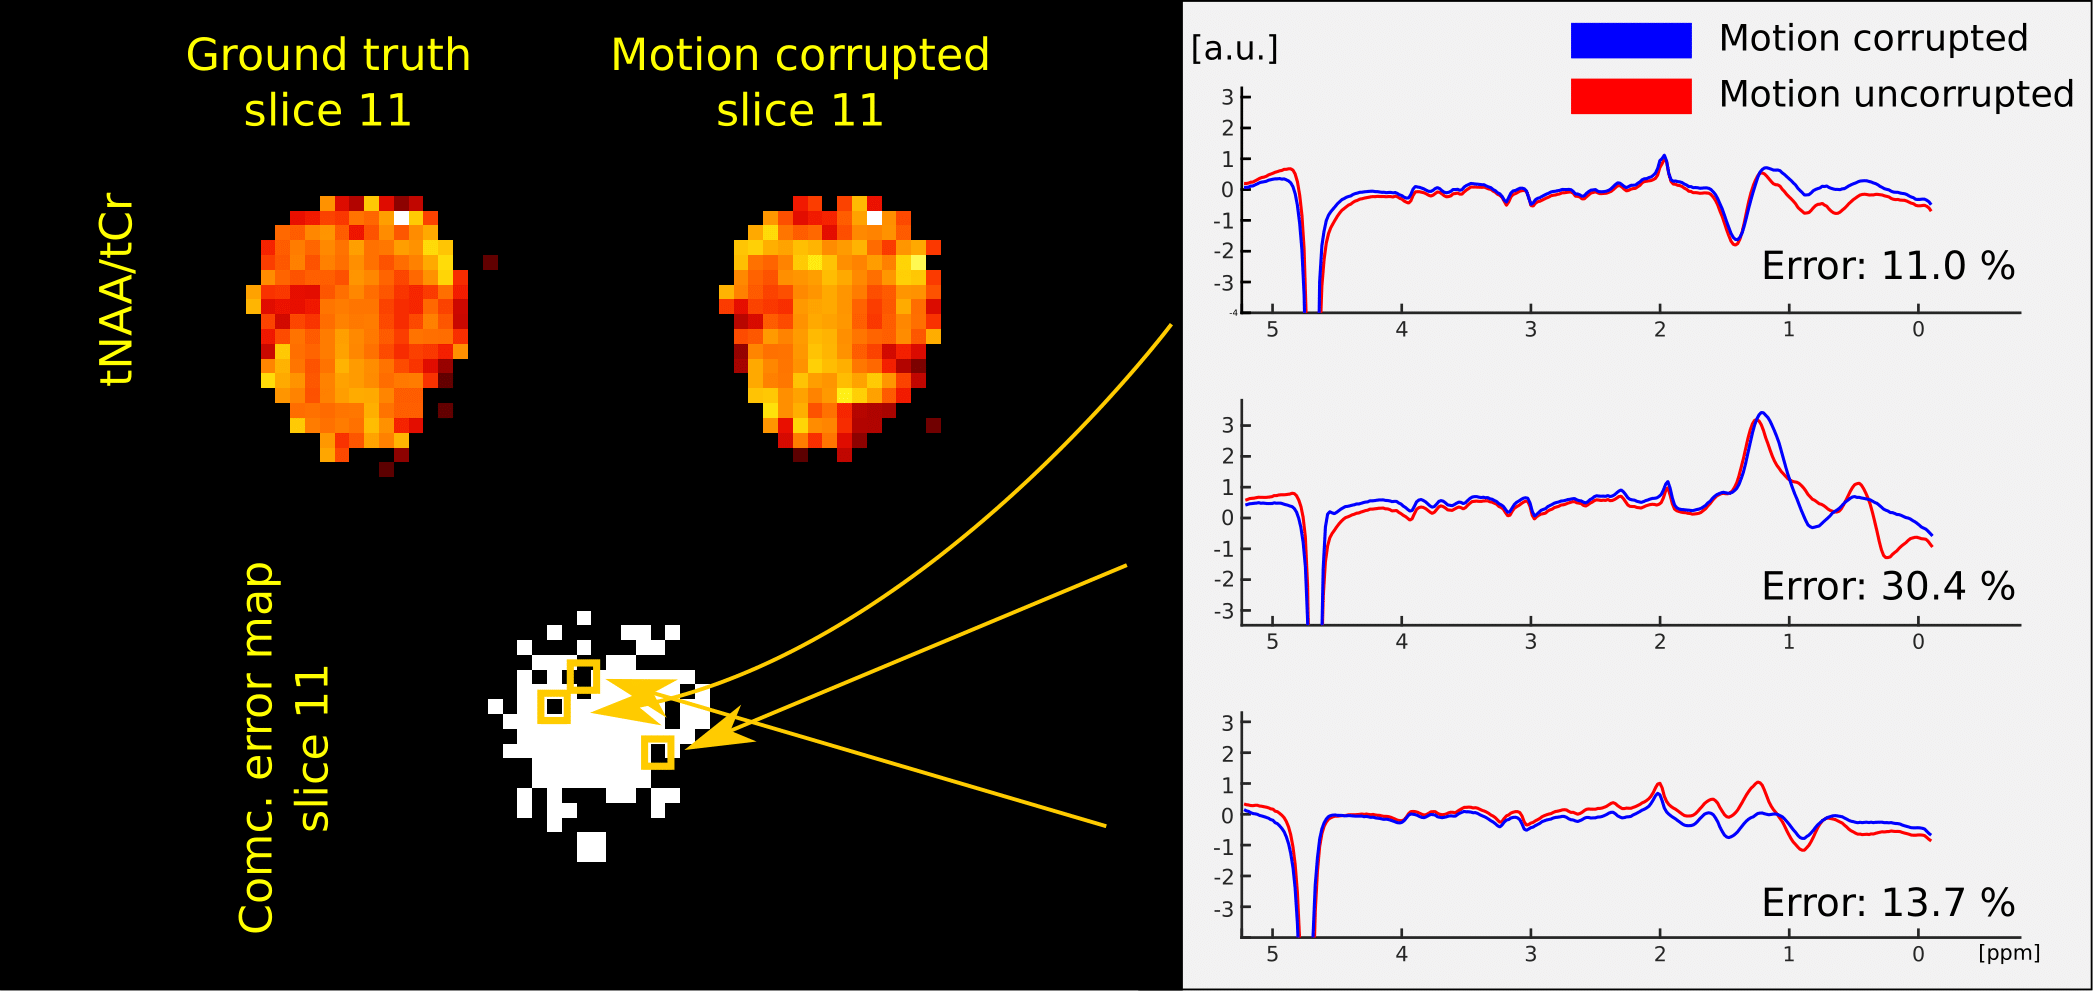
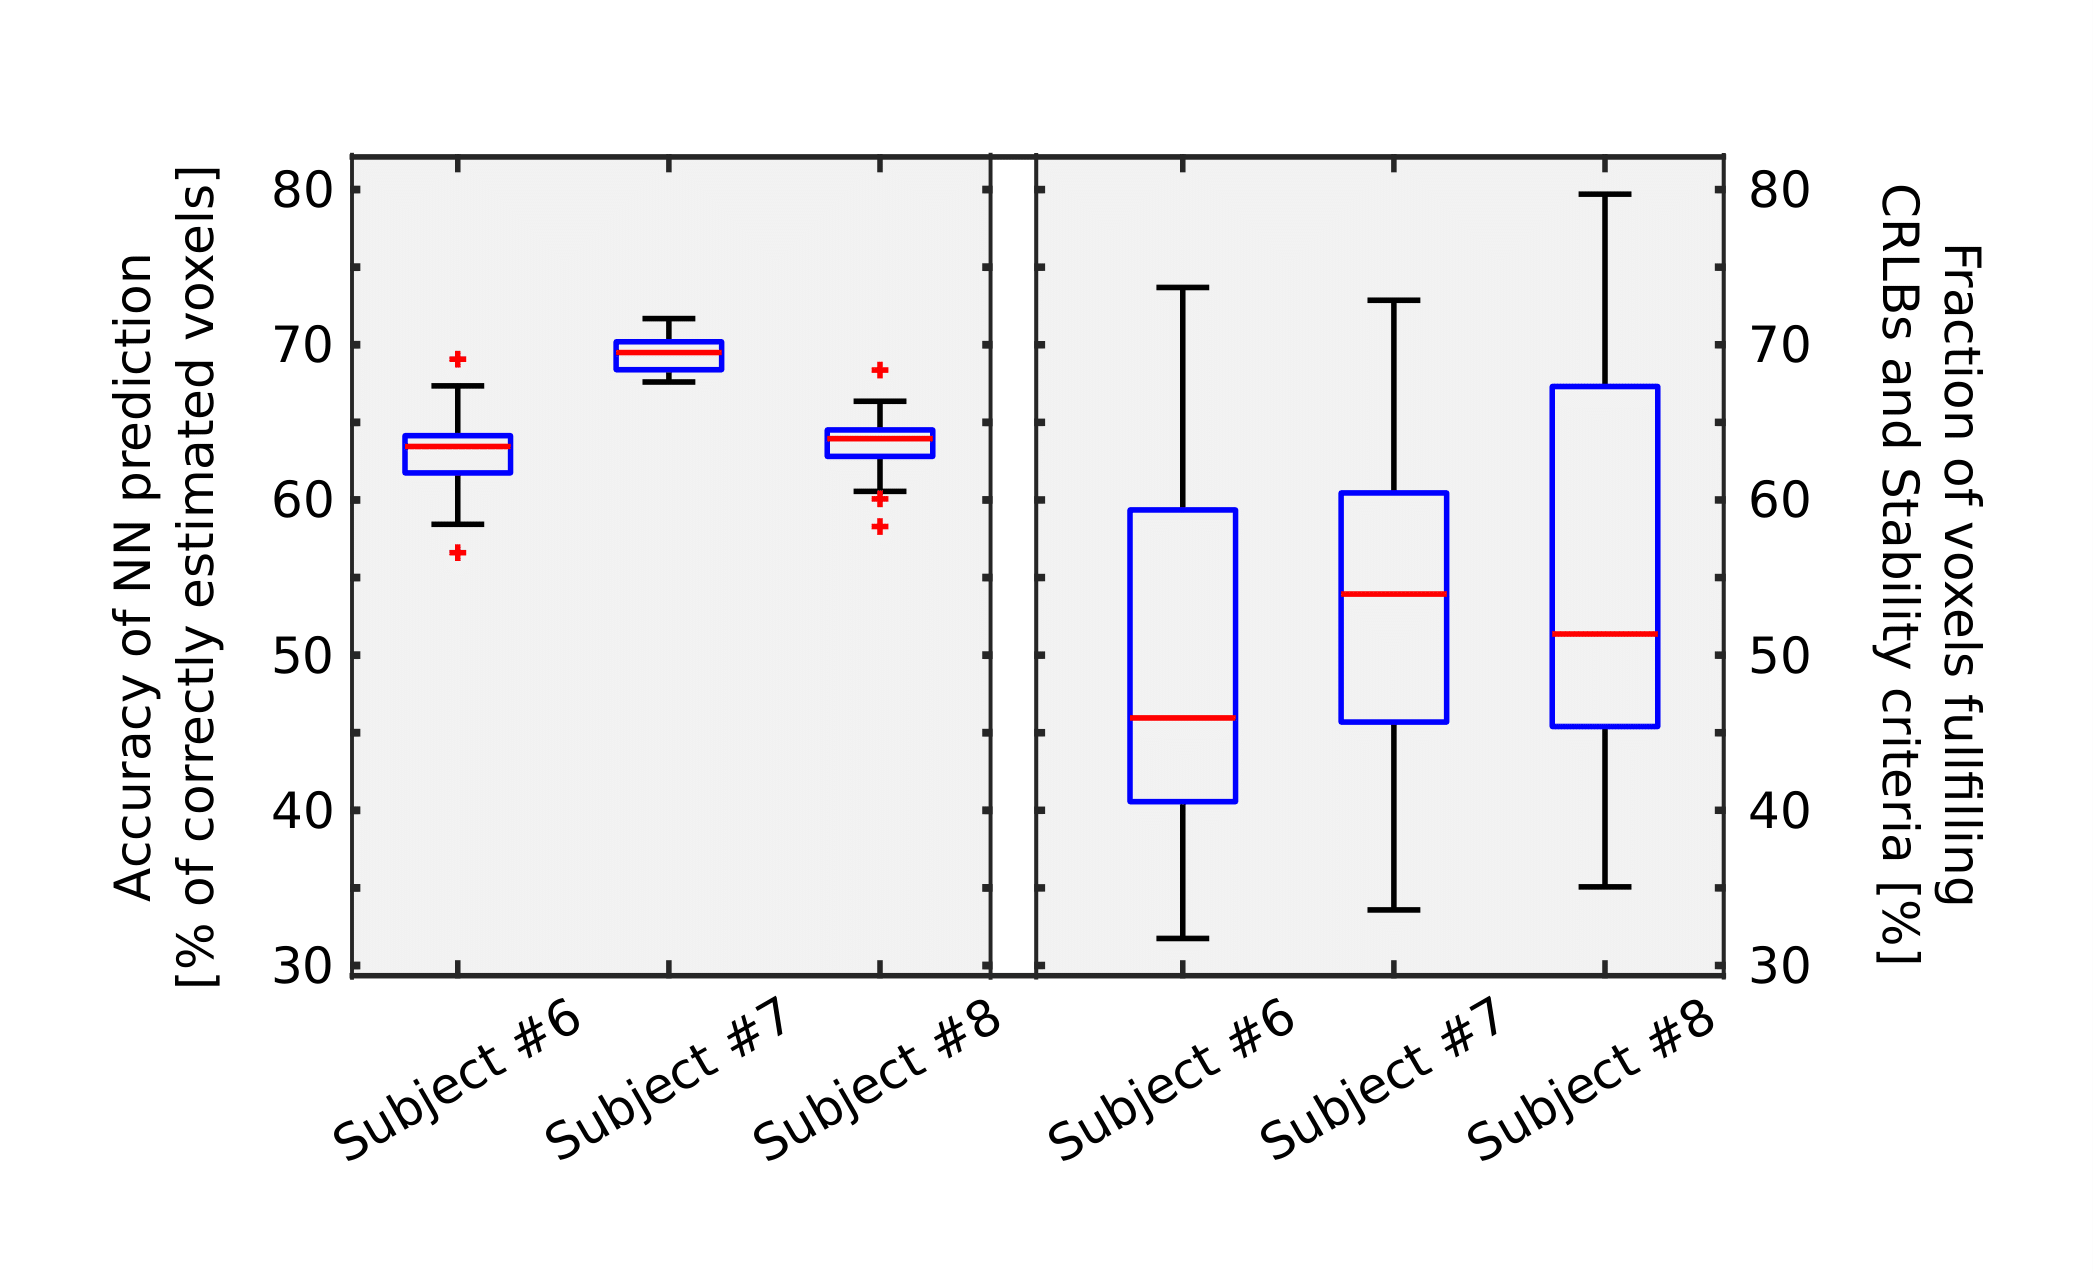
Quality evaluation of the NN prediction is presented in Figure 2 along with the metabolic maps for two cases, respective CRLBs, and concentration error maps. A good match between the NN classification and the concentration error maps can be seen. In Figure 3, three example spectra are presented, showing that the errors mainly stem from differences in the water and the lipids. Boxplots of accuracies for three subjects and boxplots of the fraction of voxels fulfilling CRLBs and stability conditions are presented in Figure 4. The median accuracy of the predictions for each subject is above 64% with inter-quartile-range of 3%, while fractions of voxels with sufficiently low CRLBs but with error >10% vary greatly, with medians around 50% and inter-quartile-range of 20%.Discussion & Conclusion
Preliminary results for the quality assessment of whole-brain MRSI spectra are presented. Instead of post-quantification analysis based on CRLB values of the fit for particular metabolites, we proposed a NN to predict instabilities caused by motion. Thus, a dataset simulating the effects of subject's motion on raw non-Cartesian k-space data was used to train the neural network that classifies the given spectra based on the spectra and its surrounding. The presented results showed the potential for such an approach (Figure 2 and 4) and highlighted the difficulty of the task (Figure 3). Moreover, we showed that CRLBs as quality parameters are not sufficient and provide very little information if the estimated concentration is accurate.We are aware that the presented study has many limitations, including a low number of subjects, a low spatial resolution and a lack of evaluation of the simulation model. Nevertheless, we think that quality assurance by traditional methods such as using CRLB thresholds is inaccurate and can be replaced by NN.
Acknowledgements
FWF grant P 34198References
1. Bogner W, Otazo R, Henning A. Accelerated MR spectroscopic imaging—a review of current and emerging techniques. NMR Biomed. 2020 doi: 10.1002/nbm.4314.
2. Kreis R. Issues of spectral quality in clinical 1H-magnetic resonance spectroscopy and a gallery of artifacts. NMR Biomed. 2004;17:361–381 doi: 10.1002/NBM.891.
3. Kreis R. The trouble with quality filtering based on relative Cramér-Rao lower bounds. Magn. Reson. Med. 2016;75:15–18 doi: 10.1002/MRM.25568.
4. Provencher SW. Estimation of metabolite concentrations from localized in vivo proton NMR spectra. Magn. Reson. Med. 1993;30:672–9.
Figures