4700
Tissue water referencing for 7T MRSI: Integrating proton density maps into quantitative metabolic mapping1Department of Neurosurgery, Medical University of Vienna, Vienna, Austria, 2High-field MR Center, Department of Biomedical Imaging and Image-guided Therapy, Medical University of Vienna, Wien, Austria, 3Wellcome Centre for Human Neuroimaging, Department of Imaging Neuroscience, UCL Queen Square Institute of Neurology, University College London, London, United Kingdom, 4Christian Doppler Laboratory for MR Imaging Biomarkers, Vienna, Austria, 5Institute for Clinical Molecular MRI, Karl Landsteiner Society, St. Poelten, Austria
Synopsis
Keywords: Spectroscopy, Brain, 7T, MRSI, Concentration Estimates
Motivation: In magnetic resonance spectroscopic imaging, generating concentration estimates is desirable. So far, our approach has been limited by the need for WM/GM separation and literature values, limiting it to healthy subjects. To solve this, it can be replaced by PD map-based references.
Goal(s): To test an approach of calculating concentration estimates within volunteers without relying on literature assumptions for reference.
Approach: Use quantitative proton density maps to calculate water concentration maps for metabolic imaging at 7T.
Results: We successfully used ME-GRE imaging to calculate water concentration maps. In healthy volunteers, these maps correspond well to the previous method.
Impact: Using tissue water maps for MRSI concentration estimation allows to not only apply the method to healthy brains, but also to pathologies like gliomas. This will make 7T MRSI a better tool for studies.
Introduction
Magnetic resonance spectroscopic imaging with concentric ring trajectories (FID-MRSI-CRT) at 7T has been shown to rapidly produce high-resolution metabolic images1. We have demonstrated quantitative mapping of concentration estimates of 5 metabolites was possible with inter-subject coefficients of variation (CV) <11% on average. This used tissue water referencing based on GM/WM segmentation and normalizing to literature water concentrations2,3. However, in pathologies where the compartmentalisation of the brain is not reliable, e.g. in the presence of gliomas, this approach is less robust. Instead, proton density maps acquired within the same scanning session could be used to create water concentration maps regardless of the tissue type4. Yet these maps are often not quantitative, but rather in arbitrary units. One such effort to create quantitative MRI maps was used by Tabelow et al. to create the hMRI-toolbox, which employs a multi-parameter mapping (MPM) approach5,6.The purpose of this study was to evaluate the integration of PD mapping into 7T MRSI in a group of volunteers by assessing its impact on reproducibility.
Methods
In 5 volunteers, we acquired an MRSI (FOV=220×220×130 mm³, matrix size=64×64×39, isotropic resolution=3.4 mm, TR=450 ms, AD=1.3 ms, TA=15 min) and a water reference MRSI scan having the same geometrical properties (TR=200 ms, TA=3:18 min), in a 7T scanner (Siemens Healthineers Magnetom.plus) using a 1Tx/32Rx coil. Spectroscopic quantification was done in LCModel using a basis set of 15 metabolites. We further acquired T1w images (0.8 mm isotropic resolution), a B1+ maps, and a GRE multi-echo (ME) sequence (6 echoes, TEs multiples of 2.3 ms) with 6° FA for PD-weighted images and 24° for T1-weighted images. We varied the ME-GRE resolution from 64×64×60, 128×128×60, to 256×256×60 with slab selective excitation- For two participants, we included the same ME sequences with slice selective excitation to match the B1 map.We now created water maps based on A) the previous approach2 and B) PD maps.
For A), T1w images were segmented with FSL’s FAST into GM/WM to create water concentration maps based on literature values7.
For B), we calculated quantitative PD-maps using the hMRI toolbox from both ME-GRE sequences and B1+ maps. We segmented the ME maps using SPM to map the water content (WC) of different tissue types (Fig.1). WM voxels with higher than 95% probability were averaged to scale the PD map to the average literature WM WC (69.70% ± 1.3%)8. The values outside the range 0-100 were capped at the extrema. Conversion between the relative WC and molar units are done according to the literature4.
We now evaluated 1) the best resolution and excitation mode settings for the ME-GRE, 2) the comparison of the previous and new water concentration maps, and 3) the concentration maps of both approaches.
Results
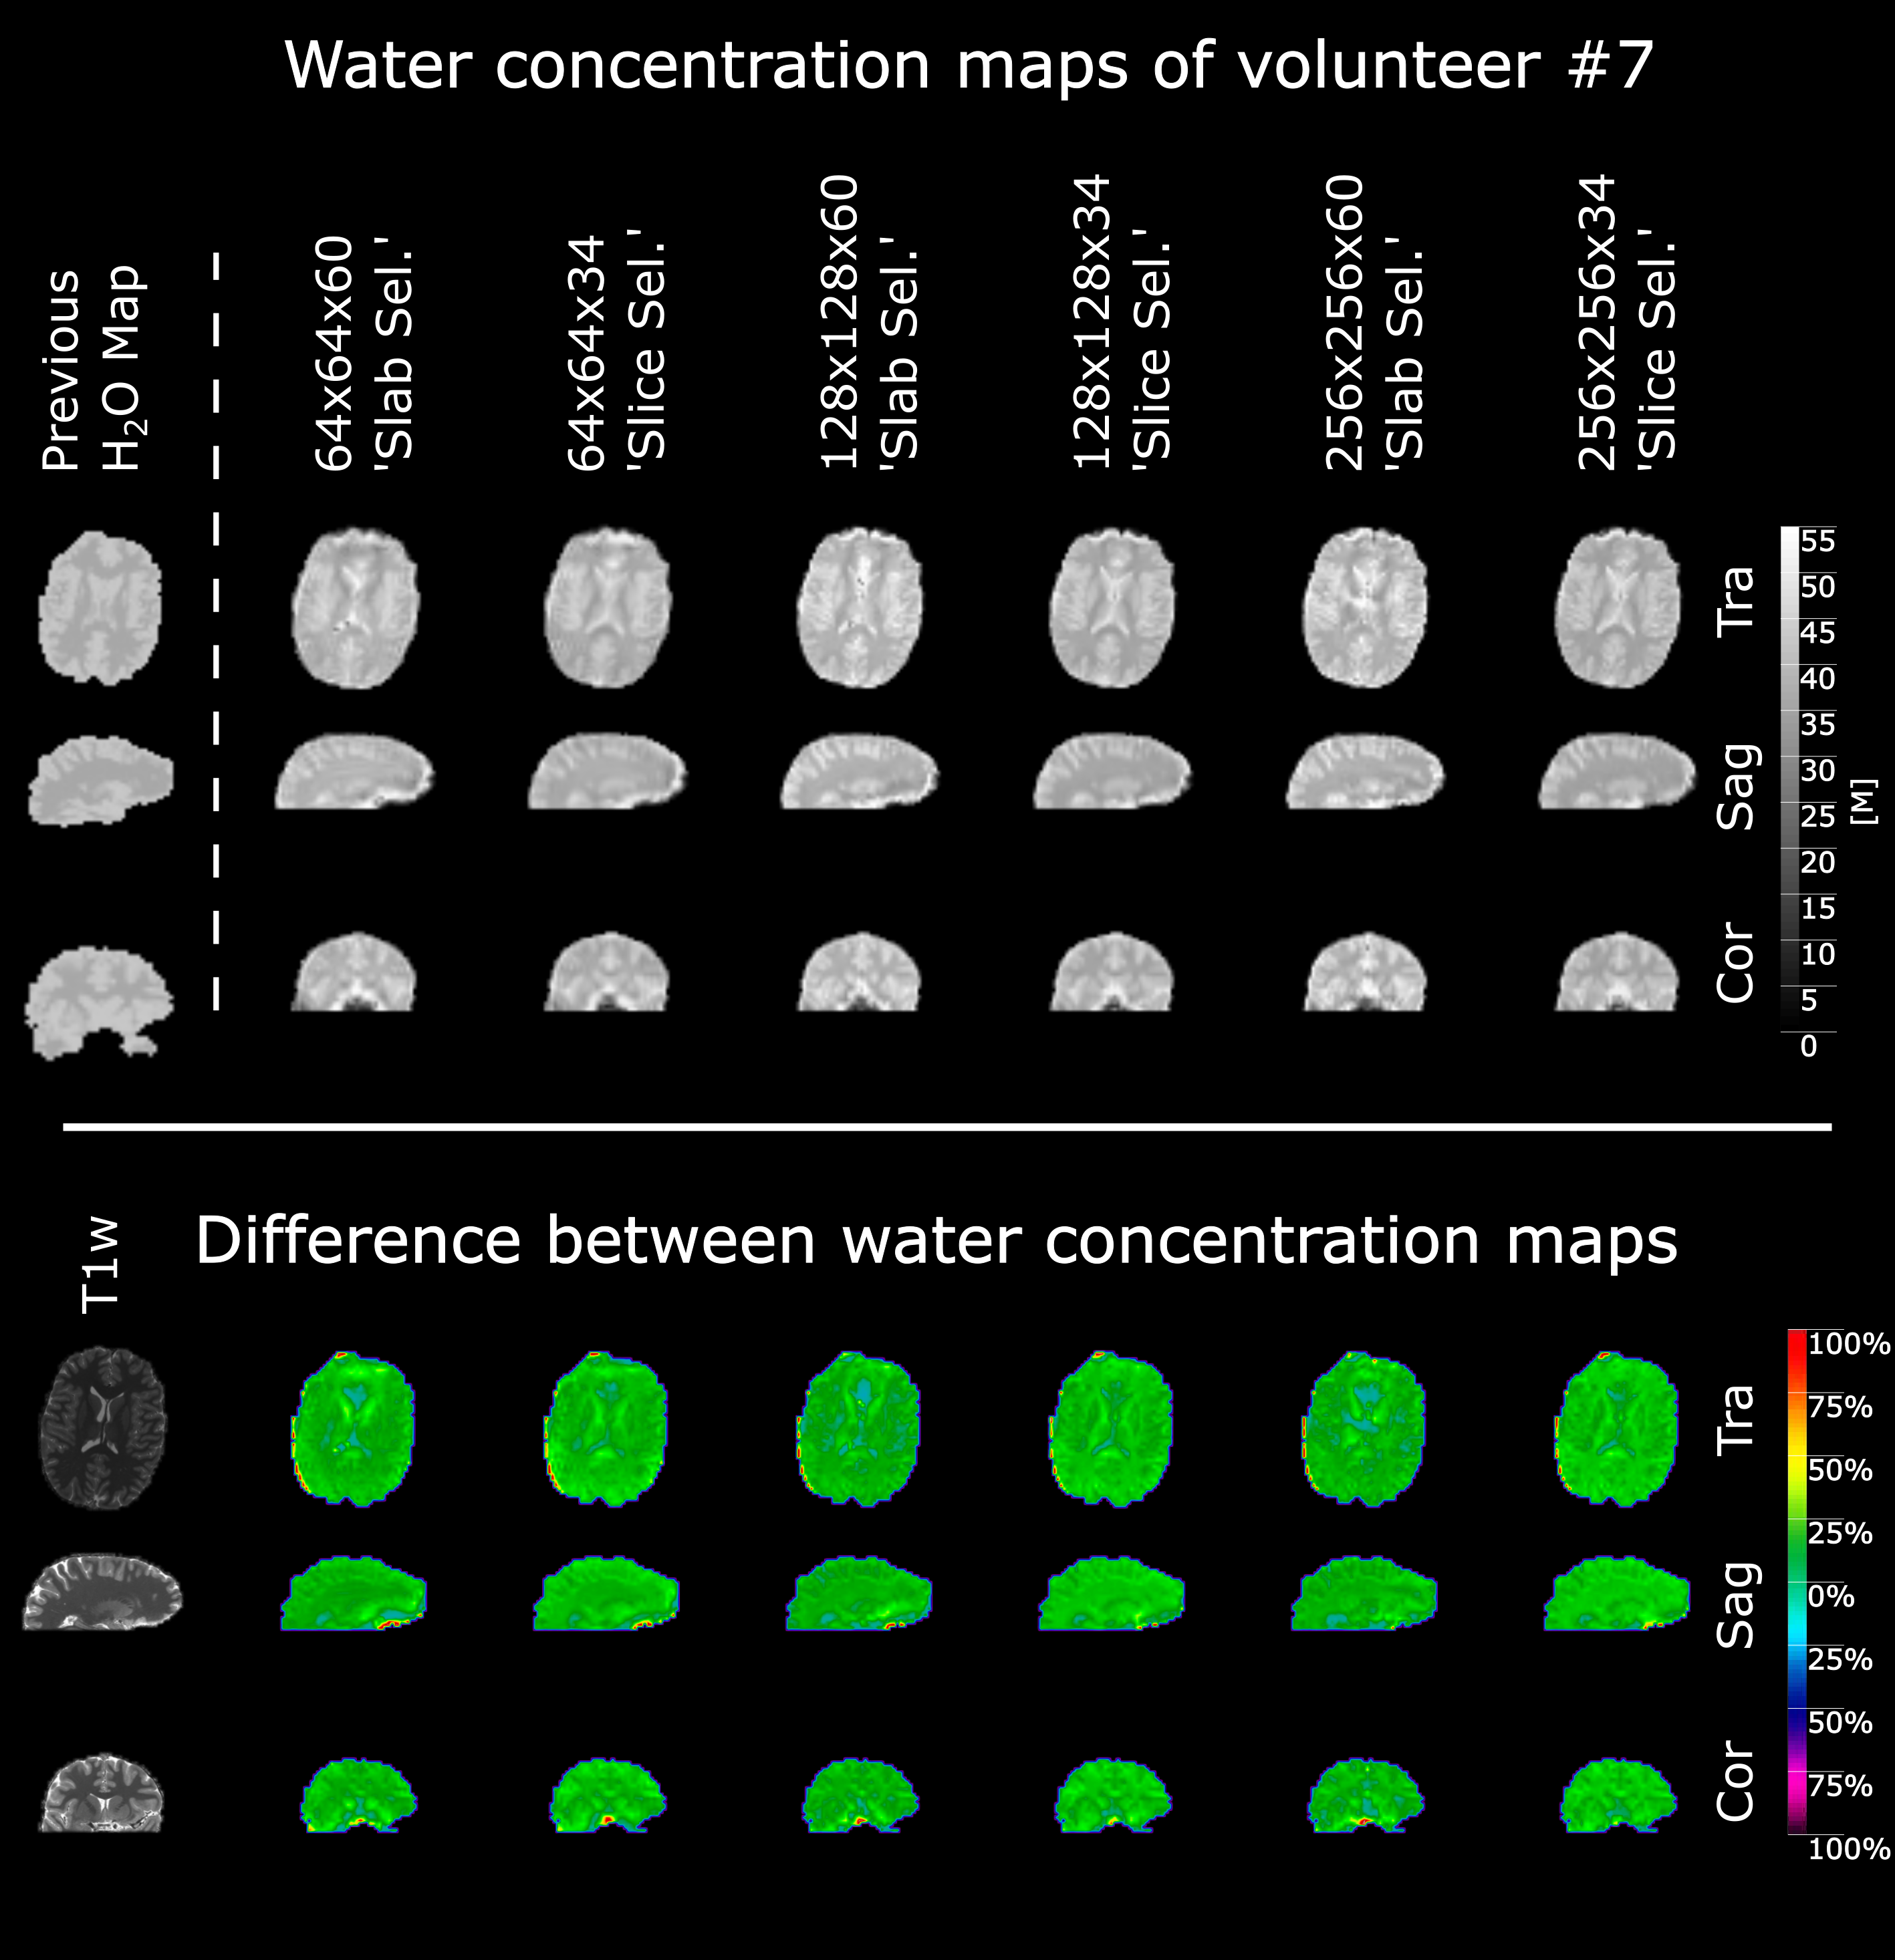
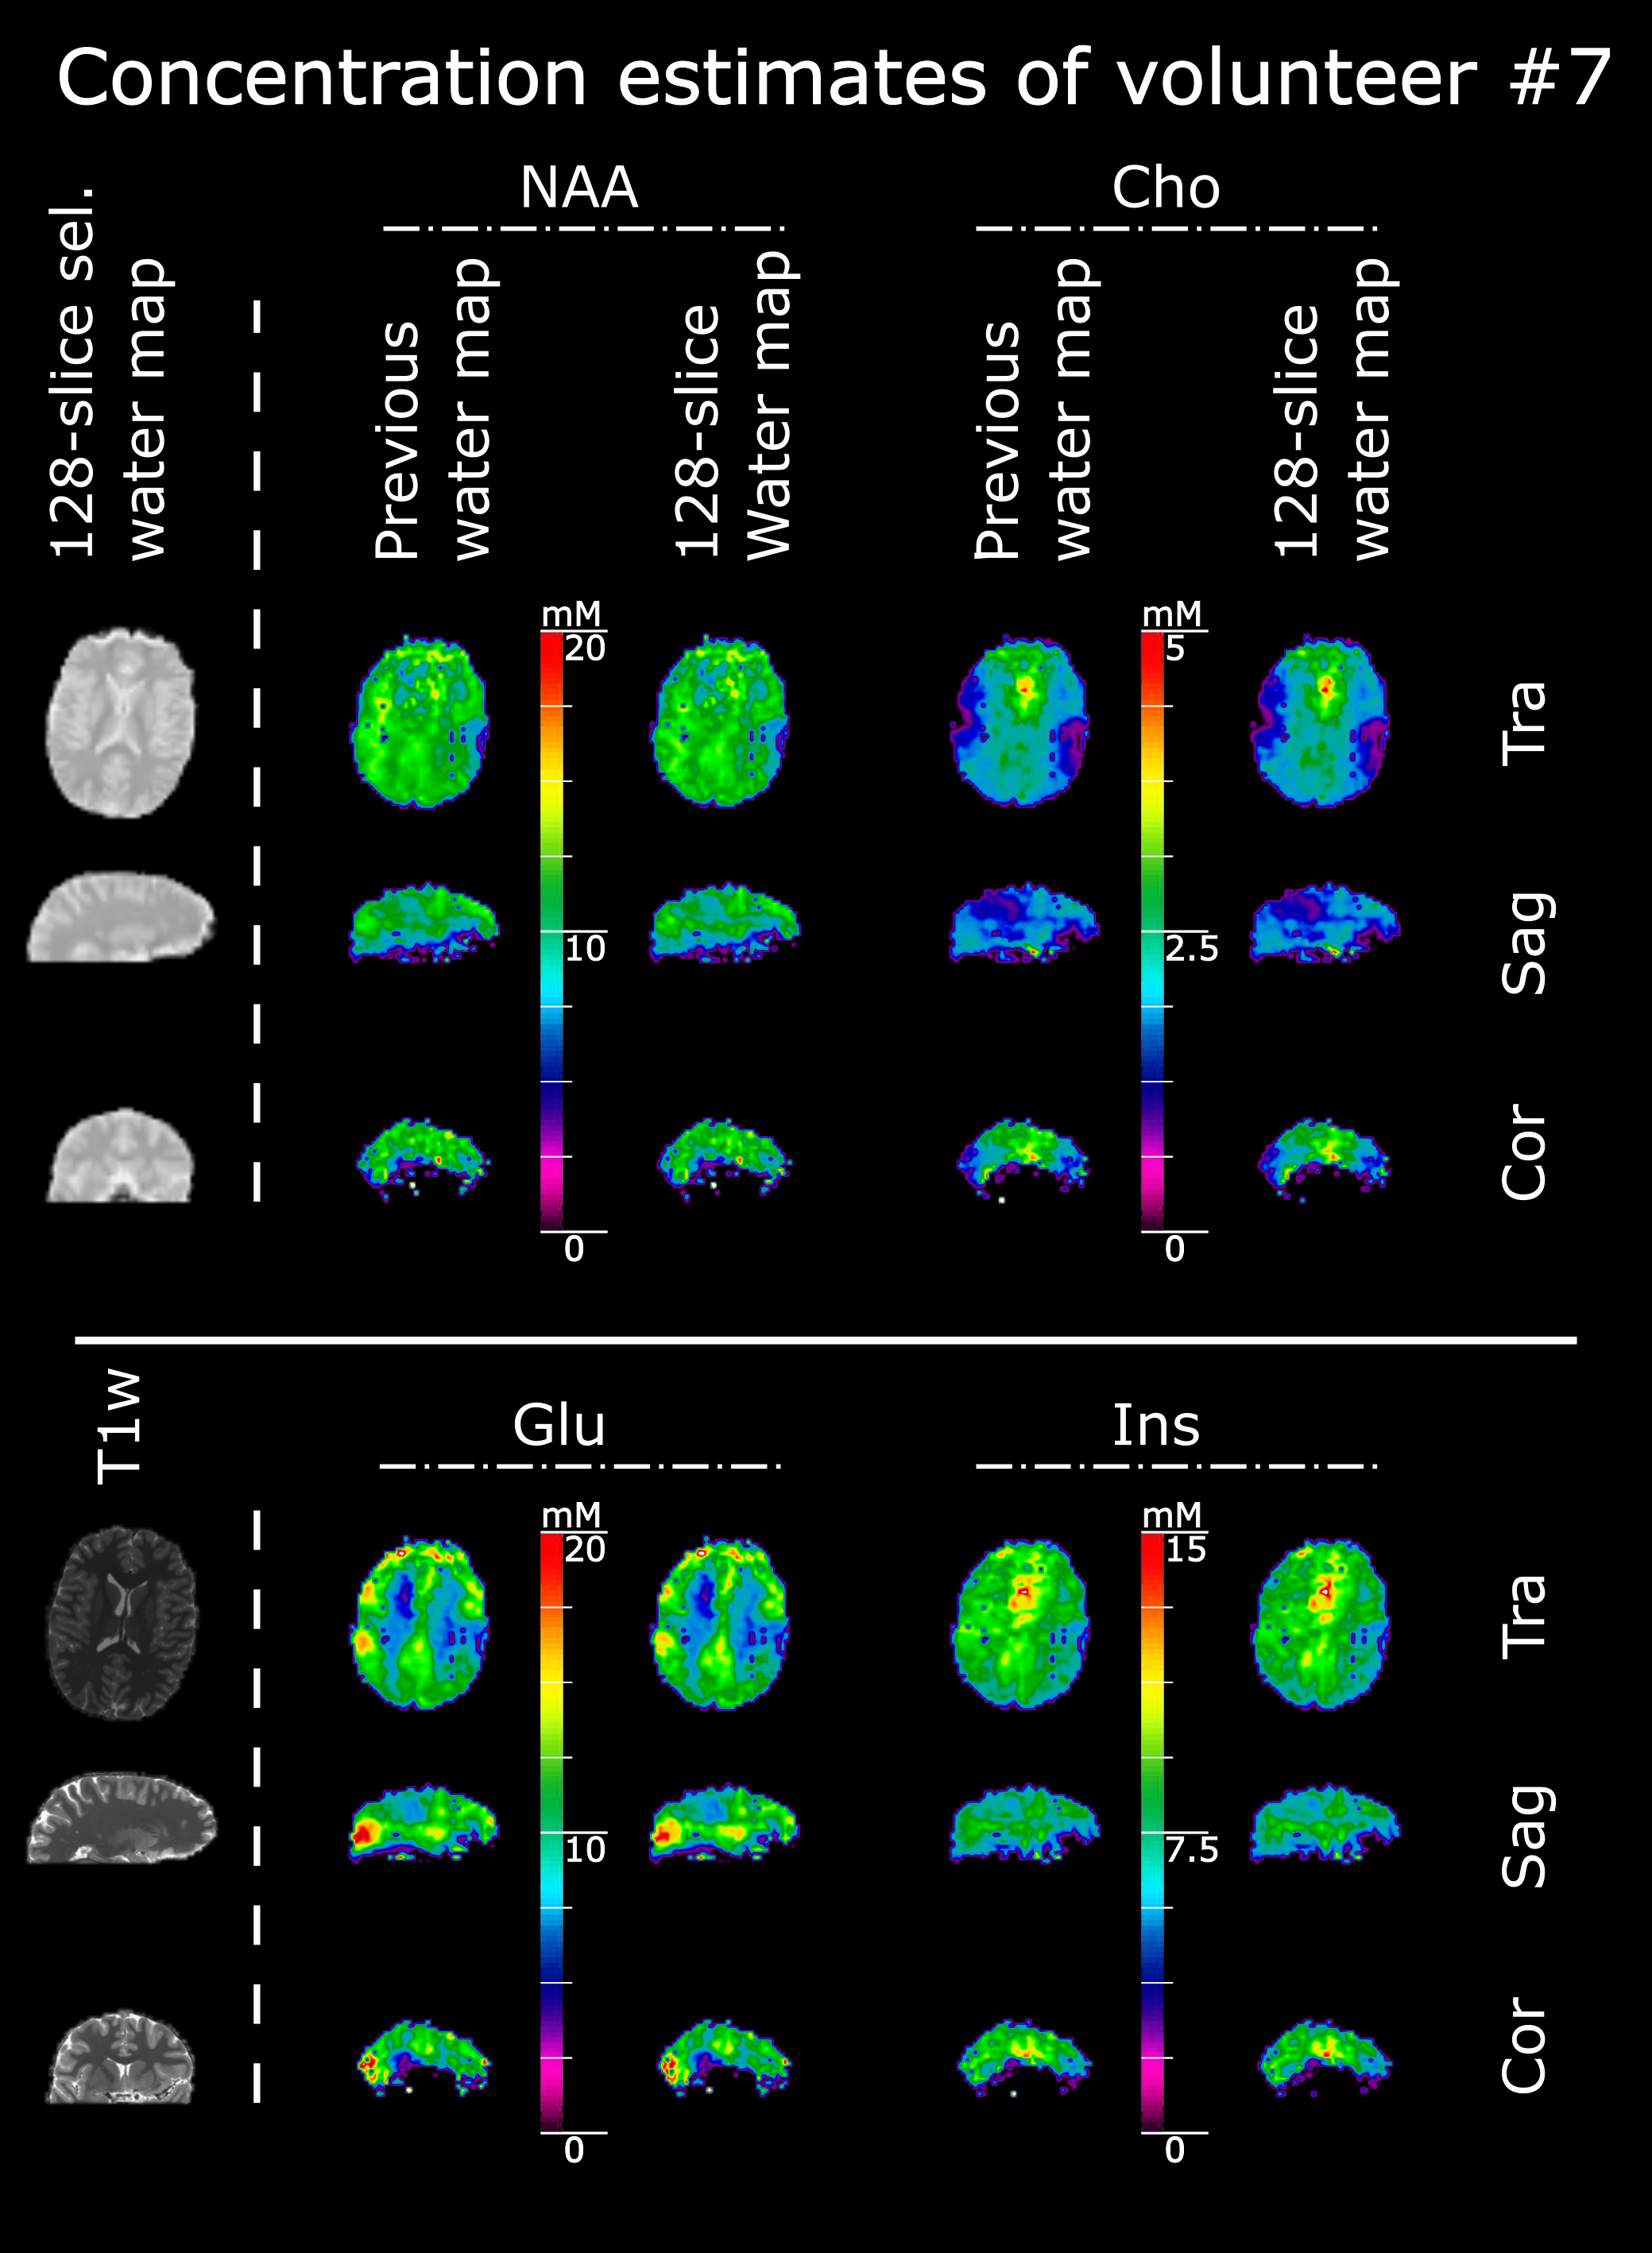
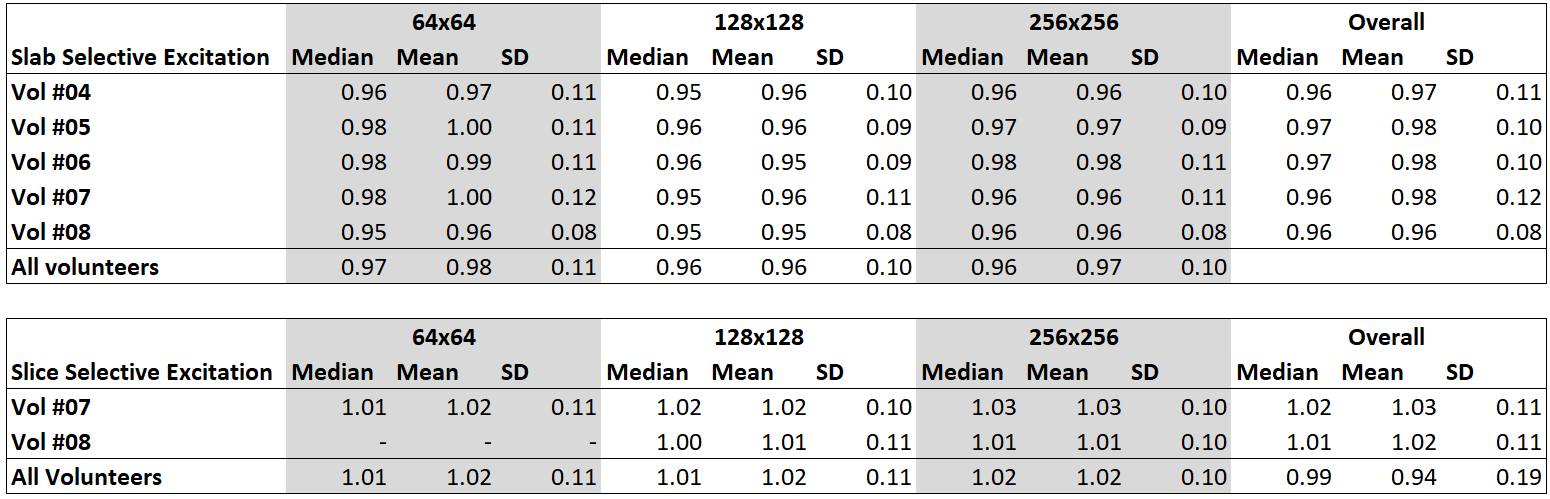
1) We found that at least a resolution of 128×128 is required to get an acceptable separation of the GM/WM peaks, and further increasing the resolution had a better resolving effect on the peaks and decreased the partial volume effects (Fig.2). Matching the excitation modes with B1 maps improved results as well. 2) The water map derived from the PD images are in high agreement with the former strategy, besides it includes CSF (Fig.3). The water map ratio distribution shows variance as low as 10% (See Tbl.1) 3) Consequently, the concentration estimate maps for both methods also show good correspondence (Fig.4).Discussion and Conclusion
Overall, we find great agreement between the water concentration and metabolite concentration estimate maps of the two approaches. The higher resolution PD maps perform better, as they reduce the impact of ringing artifacts, and provide more accurate transitions dealing with the partial volume effects.While our preliminary results are promising, increasing the study cohort is necessary for a thorough analysis of the robustness of our approach and precision of our water maps, especially now that we have identified promising ME-GRE acquisition parameters. Parallel transmit systems and improved shims will help to generally improve MRSI quality.
After having confirmed our method in volunteers, we want to move on towards glioma patients, where we could advance beyond the necessity of ratio maps that conflate different metabolic trends in one image.
Acknowledgements
This study was supported by the Austrian Science Fund (FWF) project KLI 1089.
References
[1] Hingerl L, Strasser B, Moser P, Hangel G, Motyka S, Heckova E, Gruber S, Trattnig S, Bogner W. Clinical High-Resolution 3D-MR Spectroscopic Imaging of the Human Brain at 7 T. Invest Radiol. 2020 Apr;55(4):239-248. doi: 10.1097/RLI.0000000000000626. PMID: 31855587.
[2] Hangel, G, Spurny-Dworak, B, Lazen, P, et al. Inter-subject stability and regional concentration estimates of 3D-FID-MRSI in the human brain at 7 T. NMR in Biomedicine. 2021; 34(12):e4596. https://doi.org/10.1002/nbm.4596
[3] Gasparovic, C., Song, T., Devier, D., Bockholt, H.J., Caprihan, A., Mullins, P.G., Posse, S., Jung, R.E. and Morrison, L.A. (2006), Use of tissue water as a concentration reference for proton spectroscopic imaging. Magn. Reson. Med., 55: 1219-1226. https://doi.org/10.1002/mrm.20901
[4] Tofts P. Proton Density of Tissue Water. In: Tofts P, editor. Quantitative MRI of the Brain. Chichester: John Wiley & Sons; 2003. Chapter 4. Available from: http://www.paul-tofts-phd.org.uk/CV/reprints/A14_c04_pd.pdf. Accessed 04.11.2023.
[5] Tabelow, K., Balteau, E., Ashburner, J., Callaghan, M.F., Draganski, B., Helms, G., Kherif, F., Leutritz, T., Lutti, A., Phillips, C., Reimer, E., Ruthotto, L., Seif, M., Weiskopf, N., Ziegler, G., Mohammadi, S.(2019), hMRI – A toolbox for quantitative MRI in neuroscience and clinical research. NeuroImage. 2019;194:191-210. https://doi.org/10.1016/j.neuroimage.2019.01.029
[6] Nikolaus ,W., John, S., Guy, W., Marta, C., Becky, I., Roger, T., Cinly, O., Edward, B., Antoine, L. (2013), Quantitative multi-parameter mapping of R1, PD*, MT, and R2* at 3T: a multi-center validation. Front Neurosci. 2013;7:95. https://doi.org/10.3389/fnins.2013.00095
[7] Gasparovic, C., Song, T., Devier, D., Bockholt, H.J., Caprihan, A., Mullins, P.G., Posse, S., Jung, R.E. and Morrison, L.A. (2006), Use of tissue water as a concentration reference for proton spectroscopic imaging. Magn. Reson. Med., 55: 1219-1226. https://doi.org/10.1002/mrm.20901
[8] Volz S, Nöth U, Jurcoane A, Ziemann U, Hattingen E, Deichmann R. Quantitative proton density mapping: correcting the receiver sensitivity bias via pseudo proton densities. NeuroImage. 2012;63(1):540-552. doi:10.1016/j.neuroimage.2012.06.076.
Figures
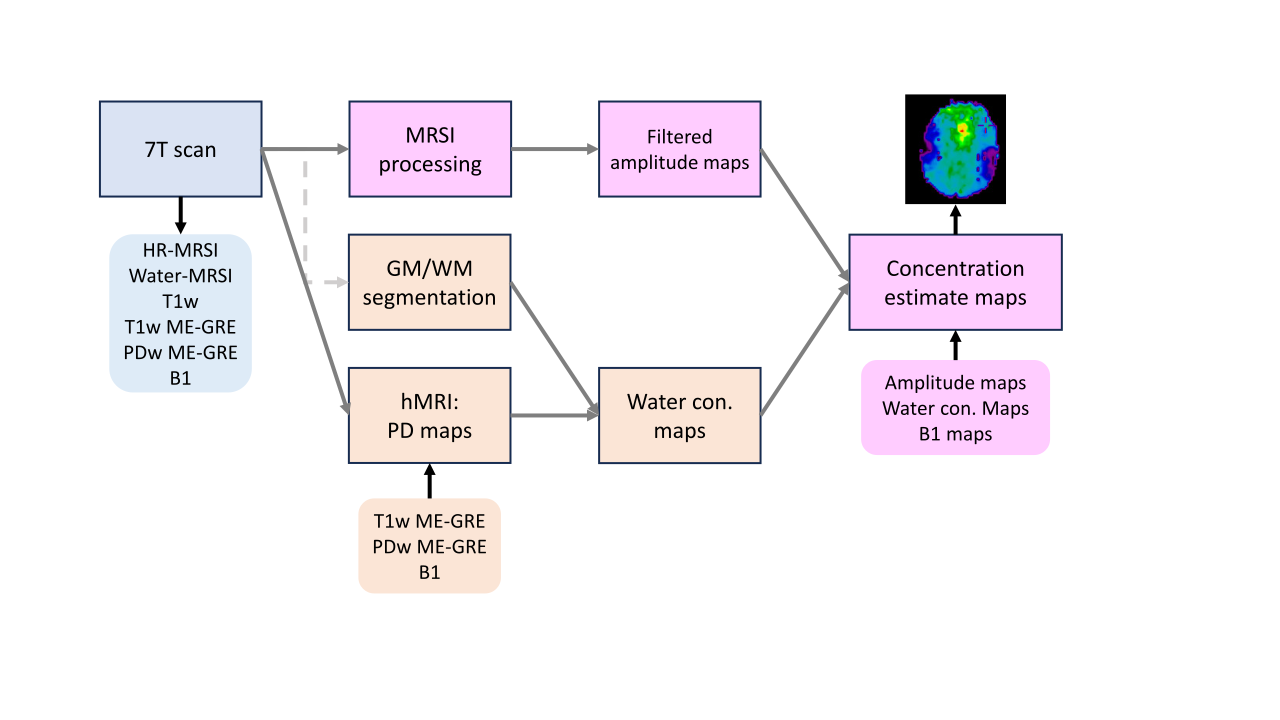
Figure 1: Flowchart representation of our processing pipeline, from acquisition to resulting tissue water reference-based concentration estimate maps.
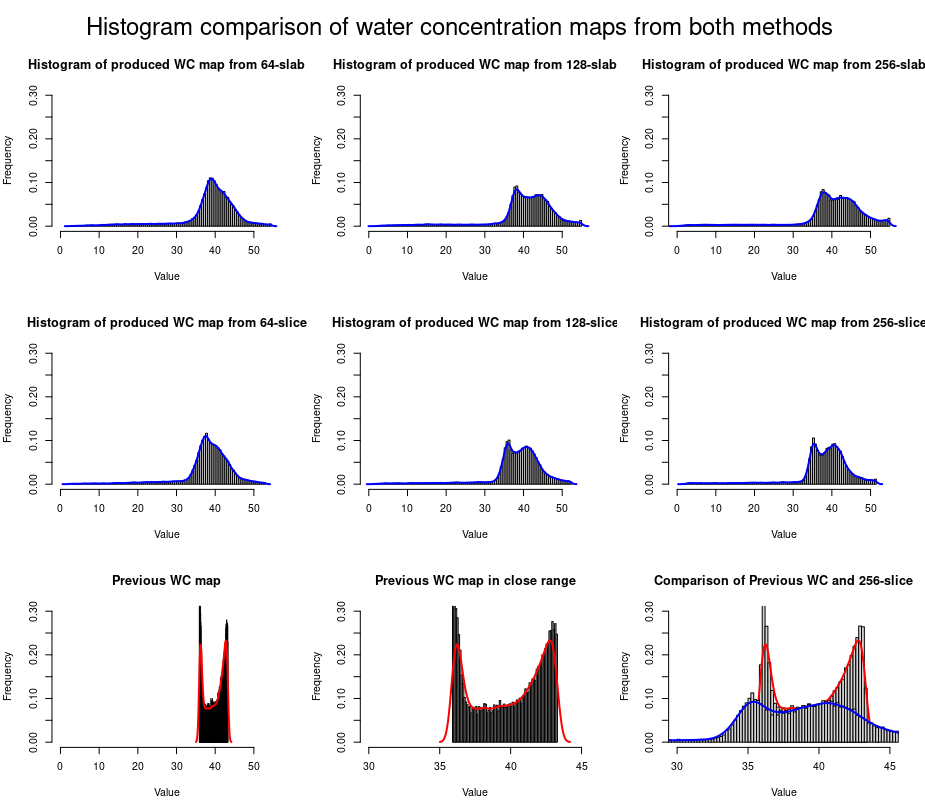
Figure 2: Examples of the resulting histograms of the calculated PD maps for different ME-GRE settings. At higher resolutions, and therefore better separation of GM and WM compartments, we see these compartments reflected in the histograms. Still,, compared to the previous approach, differences are clearly discernible and need deeper investigation.