4692
Playing with k-space lines: downsampling through deep learning to improve clinical sensitivity of diffusion imaging1Department of Brain & Behavioral Sciences, University of Pavia, Pavia, Italy, 2NMR Research Unit, Queen Square MS Centre, Department of Neuroinflammation, UCL Queen Square Institute of Neurology, Faculty of Brain Sciences, University College London, London, United Kingdom, 3Department of Medical Physics and Biomedical Engineering, Centre for Medical Image Computing (CMIC), University College London, London, United Kingdom, 4Digital Neuroscience Centre, IRCCS Mondino Foundation, Pavia, Italy, 5Radiomics Group, Vall d’Hebron Institute of Oncology, Vall d’Hebron Barcelona Hospital Campus, Barcelona, Spain, 6Neurology-Neuroimmunology Department Multiple Sclerosis Centre of Catalonia (Cemcat), Vall d’Hebron Barcelona Hospital Campus, Barcelona, Spain
Synopsis
Keywords: AI/ML Image Reconstruction, Neuro, k-space, clinical sensitivity
Motivation: The long acquisition time of diffusion-weighted (DW) imaging hinders its adoption in the clinic for studying pathological microstructural changes in vivo.
Goal(s): The goal of this study was to reduce these long acquisition times by performing downsampling in k-space while maintaining clinical sensitivity.
Approach: Deep learning was used to transform k-space data to DW images. Experiments were performed eliminating 30% of k-space lines using different methods.
Results: DW images obtained with k-space down-sampling showed a reduction in artefacts, while fractional anisotropy images fitted from the network output appeared to have increased clinical sensitivity.
Impact: This work paves the way for the design of acquisition strategies for fast diffusion-imaging. Through deep learning, it was possible to downsample k-space data in several ways, while obtaining a reduction in artefacts, with a potential increase in clinical sensitivity.
Introduction
To reduce the acquisition time of diffusion-weighted (DW) imaging one can start from the k-space, which has high redundancy. The idea here is to substitute the Fourier transform operation1,2 and start from k-space to obtain the corresponding DW images through deep learning. Downsampling k-space, we aimed to reduce the acquisition time by at least 30%, obtaining images similar to those reconstructed using the entire k-space data.We optimised a previously proposed T1-T2-weighted image reconstruction network for the specific case of DW data3. One of the challenges was that DW imaging can produce substantially different contrasts depending on the diffusion weighting applied; while mathematical models can be fitted to DW data to obtain tissue microstructure maps4. Here, the automated transform by manifold approximation (AUTOMAP)5 network was adapted and optimised for the k-space reconstruction task giving as input the DW k-space data and obtaining as output the corresponding magnitude image. In this way, it may be possible to downsample k-space, reducing acquisition time, and obtaining DW images similar to the ones reconstructed from the entire k-space data.
Methods
Subjects: 18 healthy controls (HC, 13 females, age 55.2±9.4 years), 41 multiple sclerosis patients (MS, 25 female, age 58.5±7 years). 18 MS subjects were rescanned a second time, 18 months after baseline.MRI acquisition: 3T Philips Ingenia CX scanner. The DW protocol included a spin-echo EPI sequence with TR/TE=6287/96 ms, b=0/1000/2000/2800 s/mm2 (3/20/20/36 repeats for each b-value, respectively); spatial resolution=2x2x2 mm3, matrix size=112x112x72.
Network design: The 77 samples were divided into: 53 for training, 12 for validation and 12 for testing. In each set there were both HC and MS subjects. Only 23 DW volumes (b-value=0-1000 s/mm2)6 for each acquisition were considered. After normalizing k-space data, the real and imaginary parts were provided as 2 separate input channels to the network. The network output aimed to match the ground truth (GT), which was set to be the magnitude image corresponding to the input k-space data. We adapted the AUTOMAP architecture5 (Fig.1) and used TensorFlow7. In order to reduce the number of parameters and the training time, k-space data were resized from a 112x112 to a 64x64 matrix (from_64_to_64). The following data augmentation was applied on-the-fly8: images were randomly rotated a multiple of 90° and were scaled in intensity by a random value.
Network applications: Four experiments were carried out (Fig.2): from_64_to_112 (B), zero_fill (C), delete_rows (D), and mixed_downsampling (E). In the case of asymmetric downsampling, 30% of k-space lines were deleted from different k-space positions in ways that could be easily implemented in pulse sequence design.
Quantitative evaluation: To compare network output and GT, image intensities were normalized to eliminate scaling factors. Root Mean Square Error (RMSE), Mean Absolute Error (MAE) and the Structural Similarity Index (SSIM)9 calculated over the brain were chosen as performance metrics.
Fractional anisotropy (FA) maps were calculated from both the GT and the network output to assess whether the network could reproduce the data with the correct diffusion encoding as FA images should be comparable in terms of intensity, regardless of the scalar intensity of the DW images used as input to fit the diffusion tensor. The performance metrics were calculated also for the FA images.
Sensitivity to pathology: For each test subject with lesions, we created boxplots of the FA of the normal appearing white matter (NAWM) (i.e., white matter (WM) excluding lesions) FA, and of the WM lesions to compare their distributions.
Results
Fig.3 shows the input, the GT and the network output for the various experiments performed. Fig.4 shows the performance metrics calculated on DW images and FA using test subjects. Boxplots of NAWM and lesional WM FA are shown in Fig.5, demonstrating an improved significant difference (p<0.000) between tissue types when using network DW.Discussion
The optimised AUTOMAP network proposed here was able to capture the relationship between k-space and DW images, even when performing experiments using reduced k-space data (Fig.3-4). The network DW images and the subsequently calculated FA were less noisy than the original ones (Fig.4) and showed sharper details. Moreover, the network DW images (Fig.5) tremendously improved clinical sensitivity as shown by the statistically significant difference in FA10. The greater ability to detect pathological changes of the FA maps obtained from network-produced DW images can be attributed to the sharper, and less noisy FA images produced by the network. Further studies are required to determine in a larger cohort whether reconstructing DW images with the network increases clinical sensitivity, by assessing statistical correlations between clinical scores and FA calculated from network-produced DW images.Acknowledgements
CGWK receives funding from Horizon2020 (Research and Innovation Action Grants Human Brain Project 945539 (SGA3)), BRC (#BRC704/CAP/CGW), MRC (#MR/S026088/1), Ataxia UK. FP receives funding from H2020 Research and Innovation Action Grants Human Brain Project (#785907, 945539 SGA2, SGA3). RS receives funding from the BRC (BRC1130/HEI/RS/11041). FG receives the support of a fellowship from "la Caixa" Foundation (ID 100010434). The fellowship code is “LCF/BQ/PR22/11920010”.References
1. Mezrich, R. A perspective on k-space. Radiology 199, 874–875 (1995).
2. Dale, B., Brown, M. and Semelka, R. MRI basic principles and applications. Wiley
3. Le Bihan, D., Turner, R., Douek, P. & Patronas, N. Diffusion MR Imaging: Clinical Applications. Am. J. Roentgenol. 159, 591–599 (1992).
4. Jones, D. K. Diffusion MRI: Theory, Methods, and Applications. (Oxford University Press, 2011). doi:10.1017/CBO9781107415324.004
5. Zhu, B., Liu, J. Z., Cauley, S. F., Rosen, B. R. & Rosen, M. S. Image reconstruction by domain-transform manifold learning. Nat. Publ. Gr. (2018). doi:10.1038/nature25988
6. Hasan, K. M., Alexander, A. L. & Narayana, P. A. Does Fractional Anisotropy Have Better Noise Immunity Characteristics Than Relative Anisotropy in Diffusion Tensor MRI? An Analytical Approach. Magn. Reson. Med. 51, 413–417 (2004).
7. Abadi, M. et al. TensorFlow: Large-Scale Machine Learning on Heterogeneous Distributed System. Netw. Comput. Neural Syst. 16, 121–138 (2005).
8. Tang, Z. et al. OnlineAugment: Online Data Augmentation with Less Domain Knowledge. Lect. Notes Comput. Sci. (including Subser. Lect. Notes Artif. Intell. Lect. Notes Bioinformatics) 12352 LNCS, 313–329 (2020).
9. Wang, Z., Bovik, A. C., Sheikh, H. R. & Simoncelli, E. P. Image quality assessment: From error visibility to structural similarity. IEEE Trans. Image Process. 13, 600–612 (2004).
10. Filippi, M. et al. Microstructural magnetic resonance imaging of cortical lesions in multiple sclerosis. Mult. Scler. J. 19, 418–426 (2013)
Figures
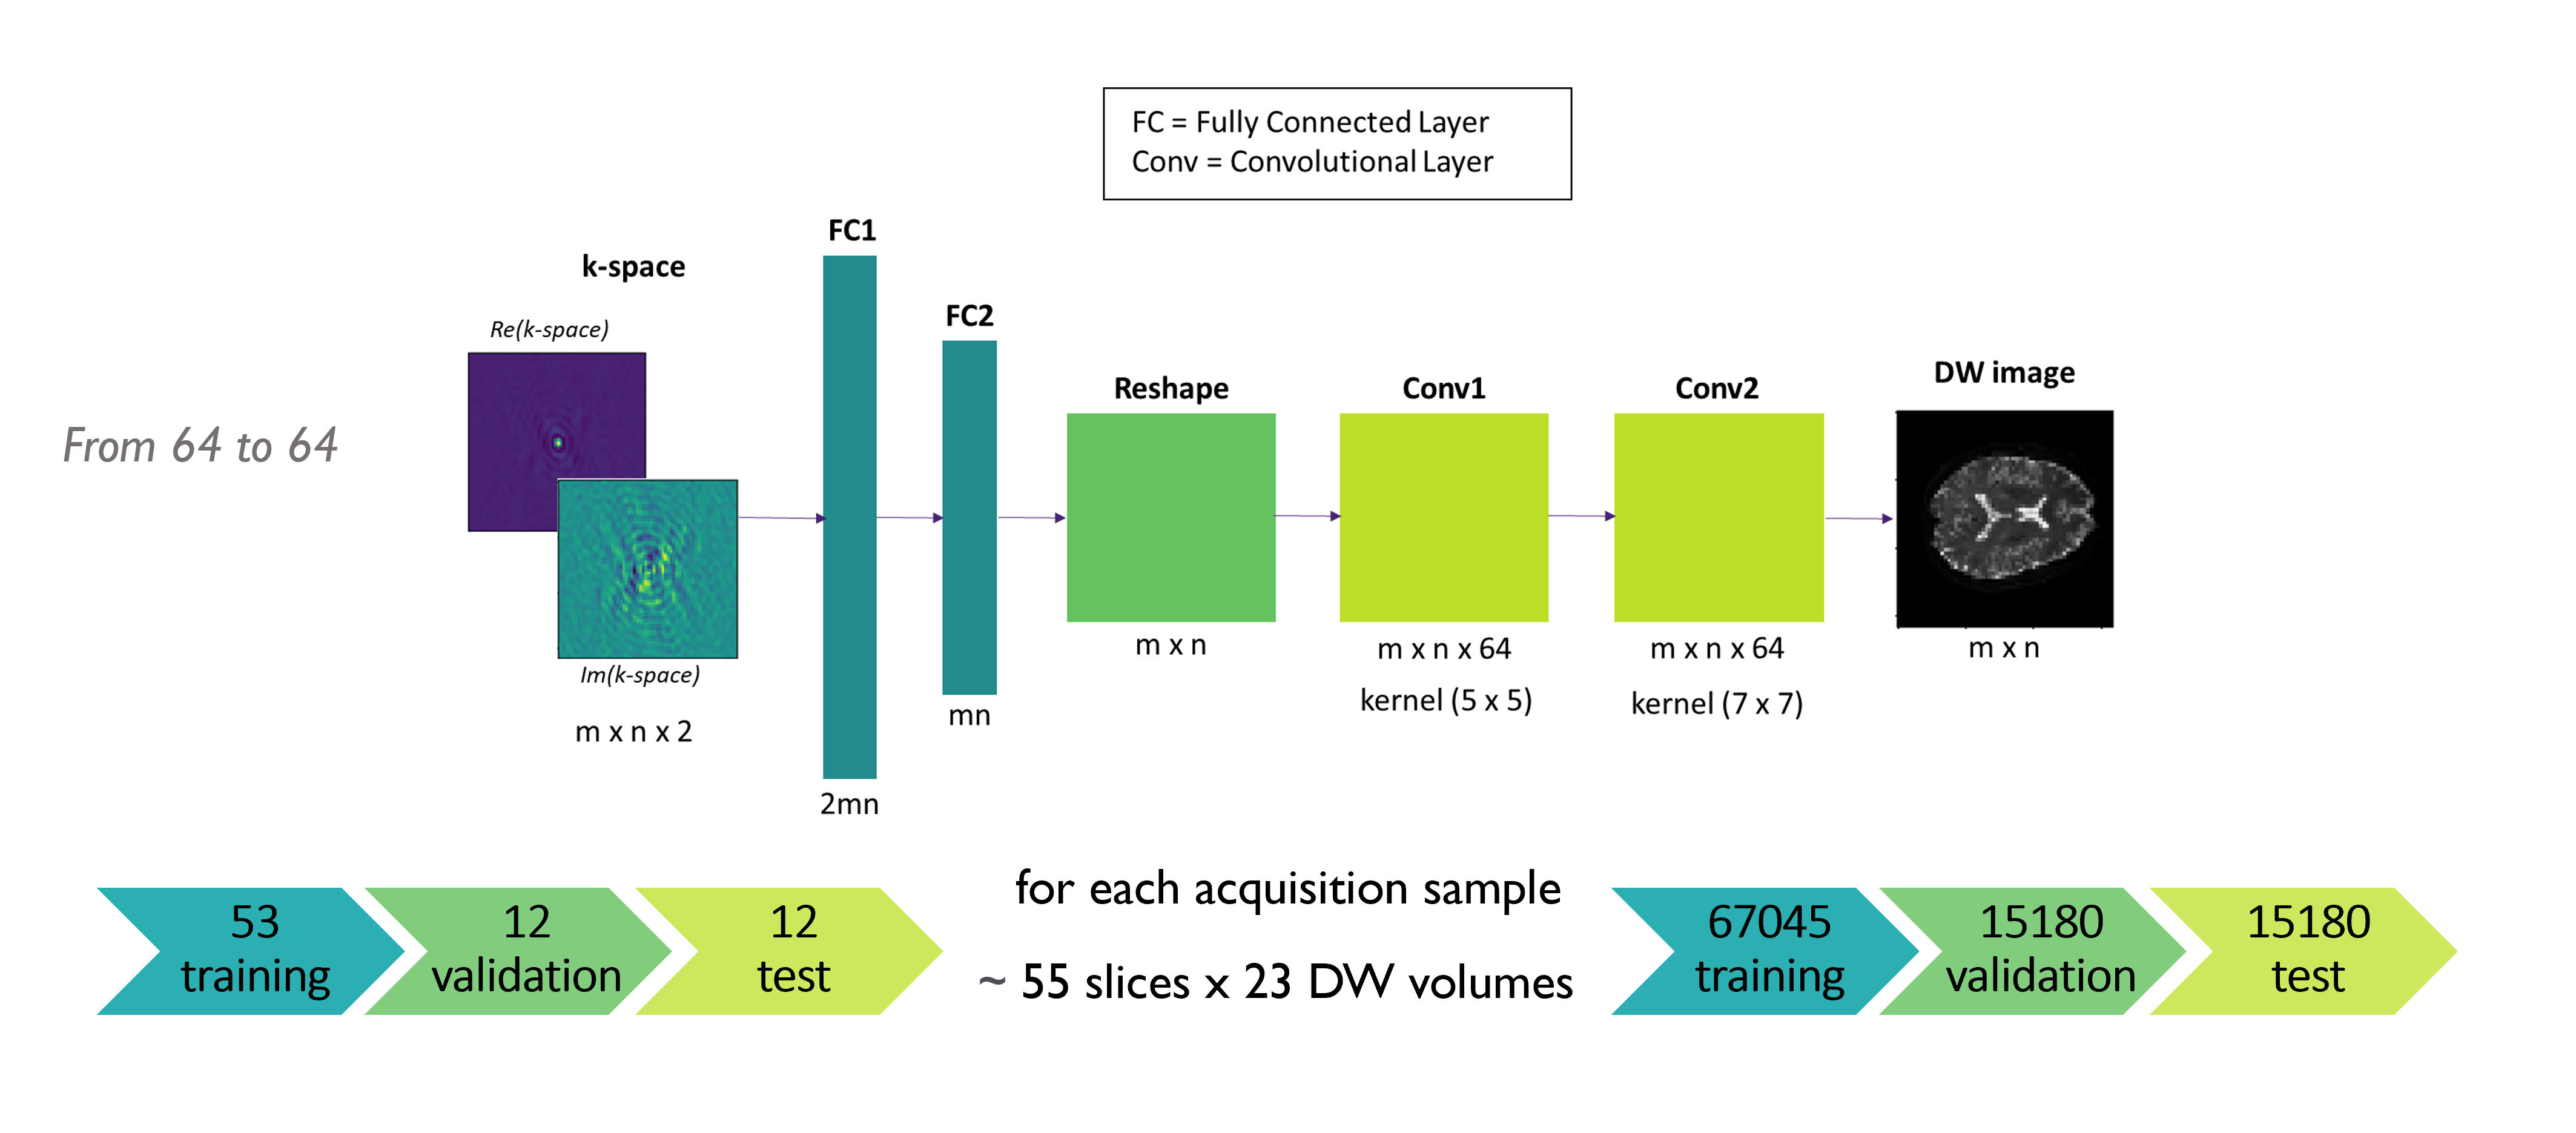
Fig.1: Architecture of the network. The inputs were the real and imaginary parts of the k-space data and the output was the associated magnitude image. Only diffusion weighted (DW) volumes with b-value equal to 0 or 1000 s/mm2 were considered, therefore 23 volumes were used for each acquisition sample. The number of volumes was limited, using the most commonly acquired b-values, in order to reduce the amount of data and consequently the training time and computational requirements.
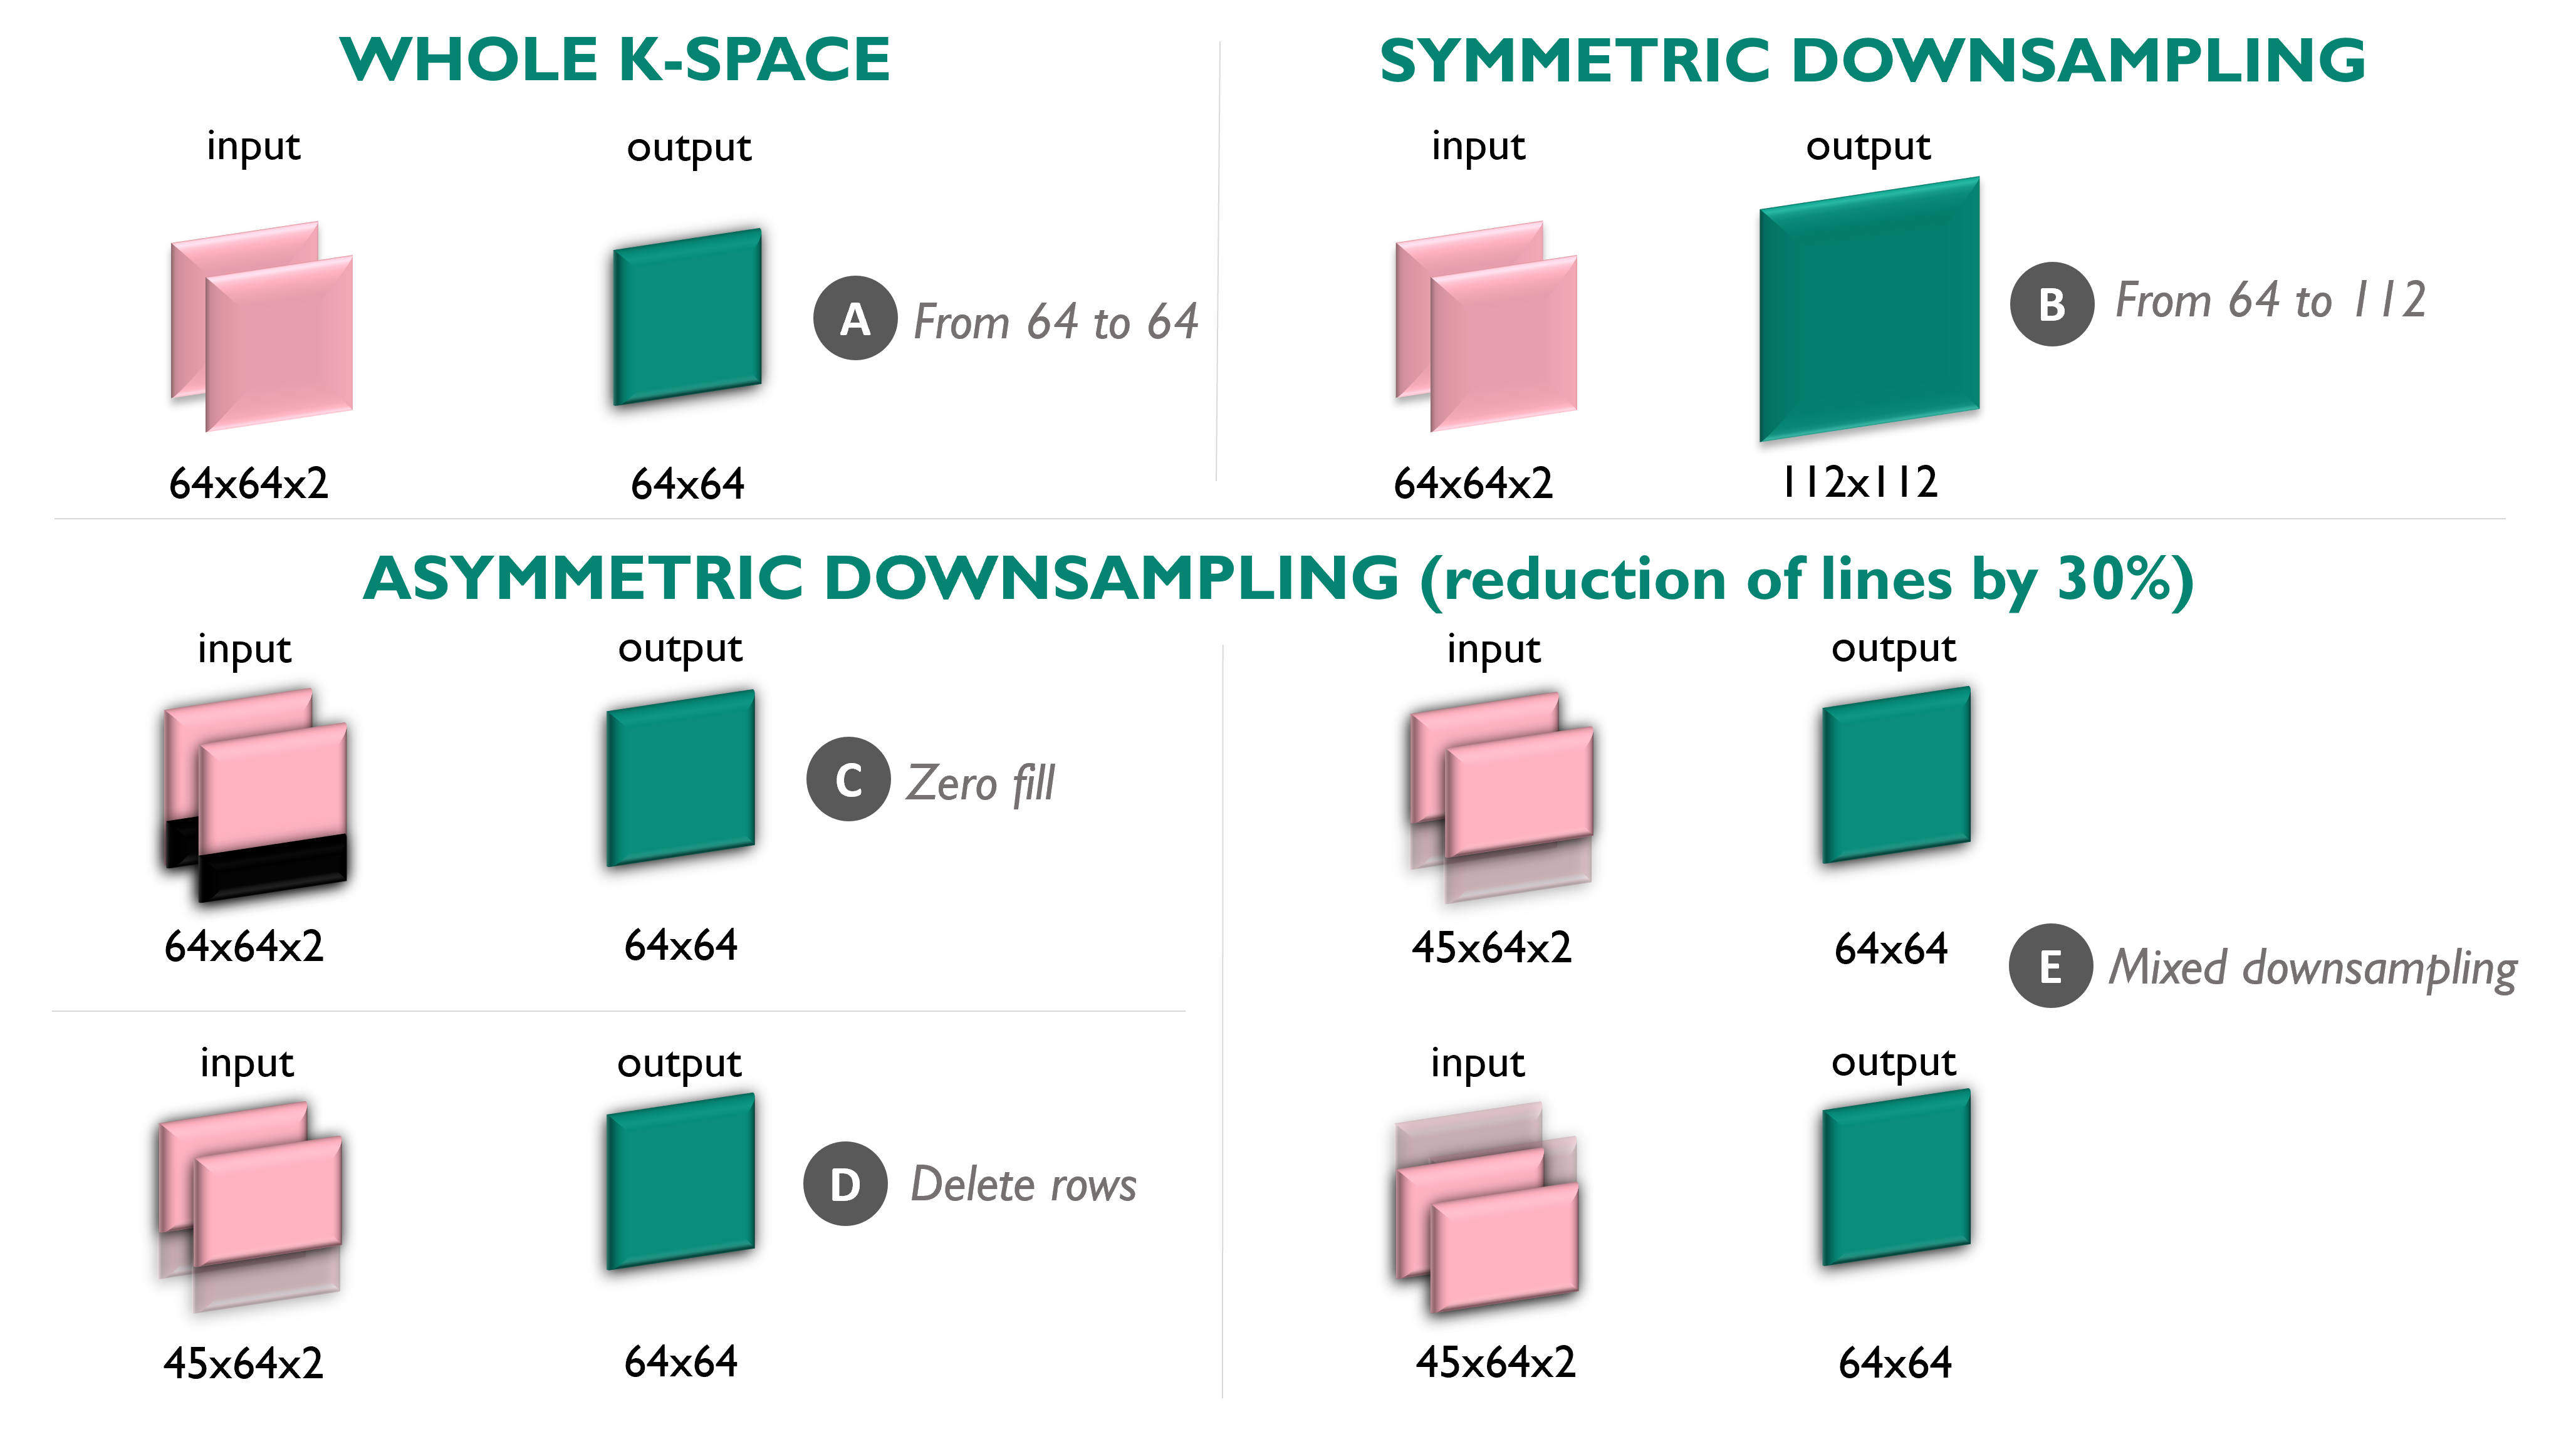
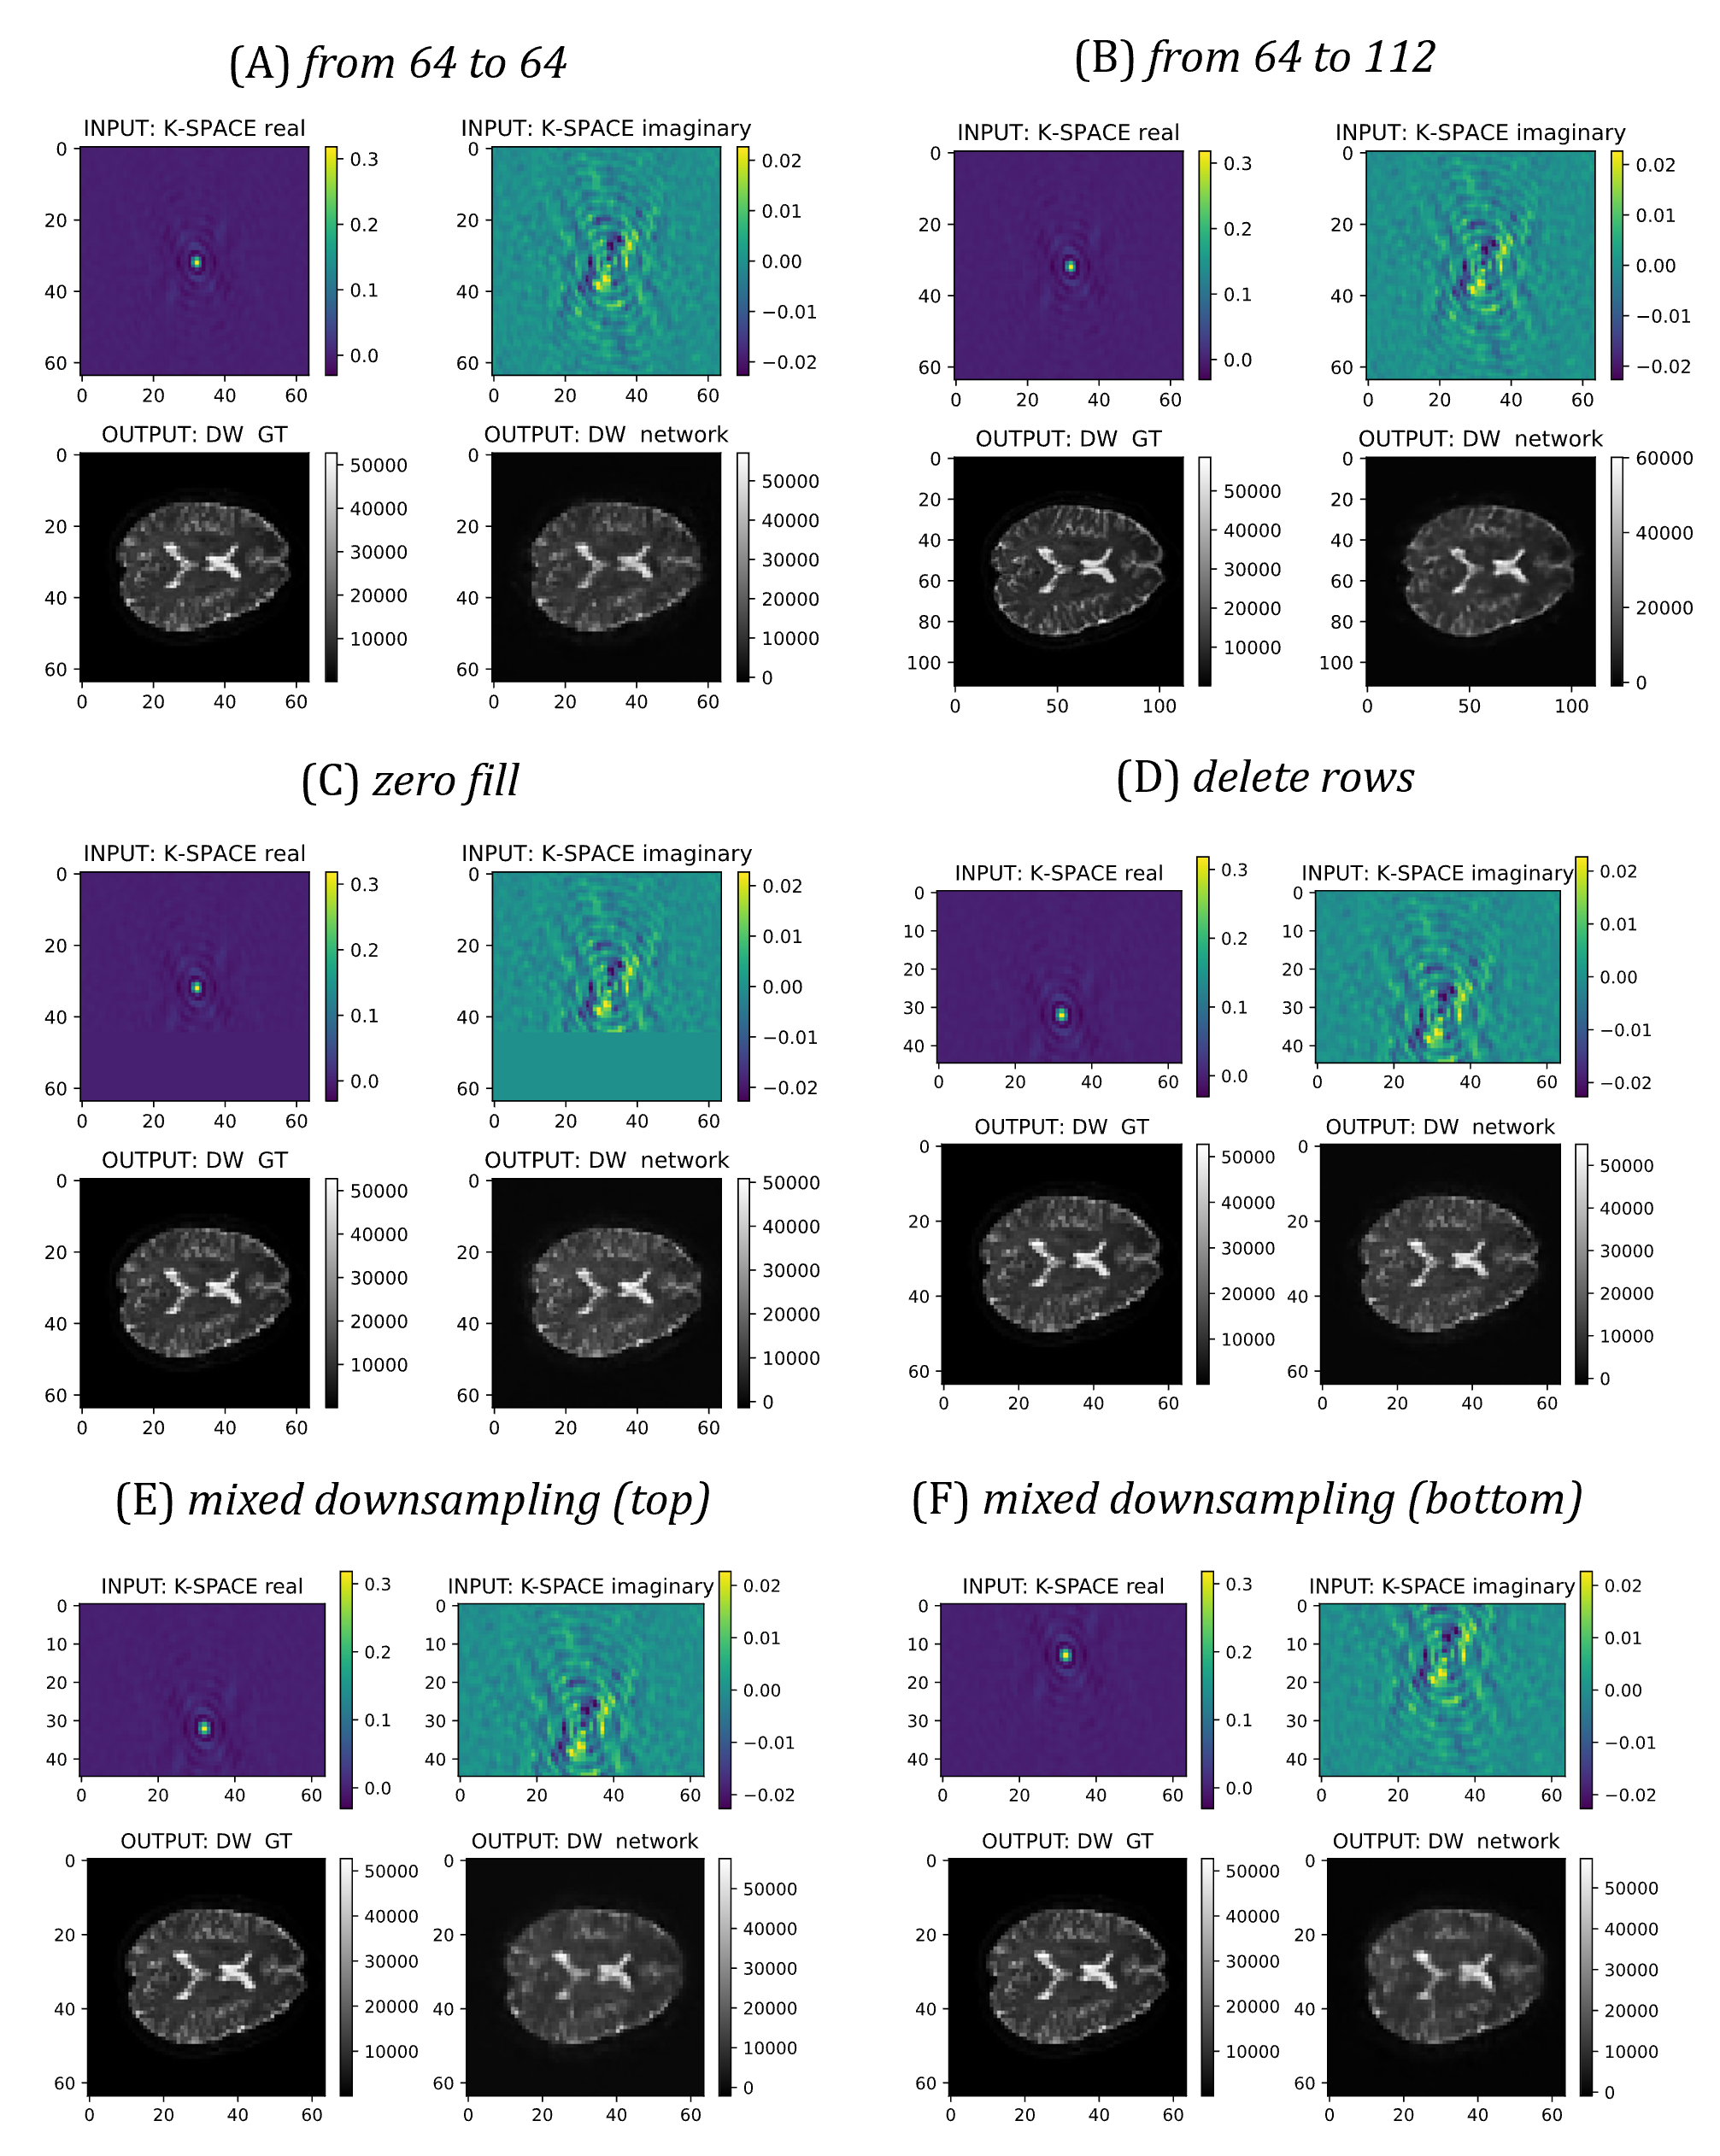
Fig.3: Each different experiment is shown in quadrants from (A) to (F). In each quadrant, the first row shows the input to the network: on the left the real part and on the right the imaginary part of k-space; the second row shows the magnitude of diffusion weighted (DW) images: on the left the ground truth (GT) (desired output) and on the right the output of the network.
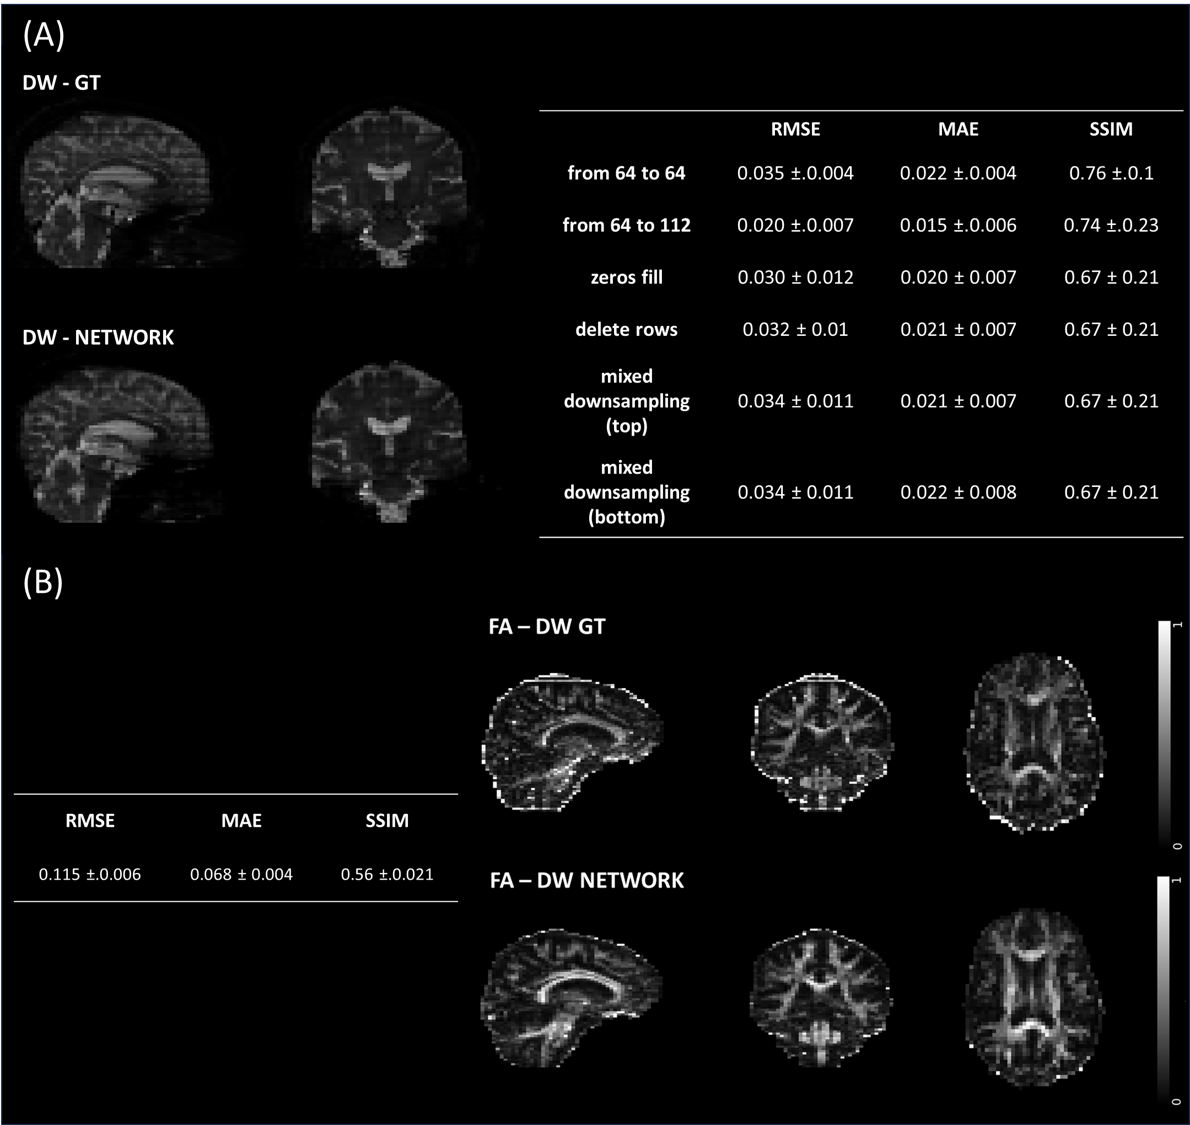
Fig.4: (A) For a test subject, the first row shows ground truth (GT) diffusion weighted (DW) images containing artifacts; the second row shows DW images obtained with the network with a reduction in artefacts. The table reports the performance metrics calculated on test subjects for each experiment. (B) The table reports the performance metrics between the Fractional Anisotropy (FA) calculated from DW GT images and the FA calculated from the network DW images. The first row shows, for a test subject, FA calculated from GT DW images, while the second row shows FA calculated from network DW.
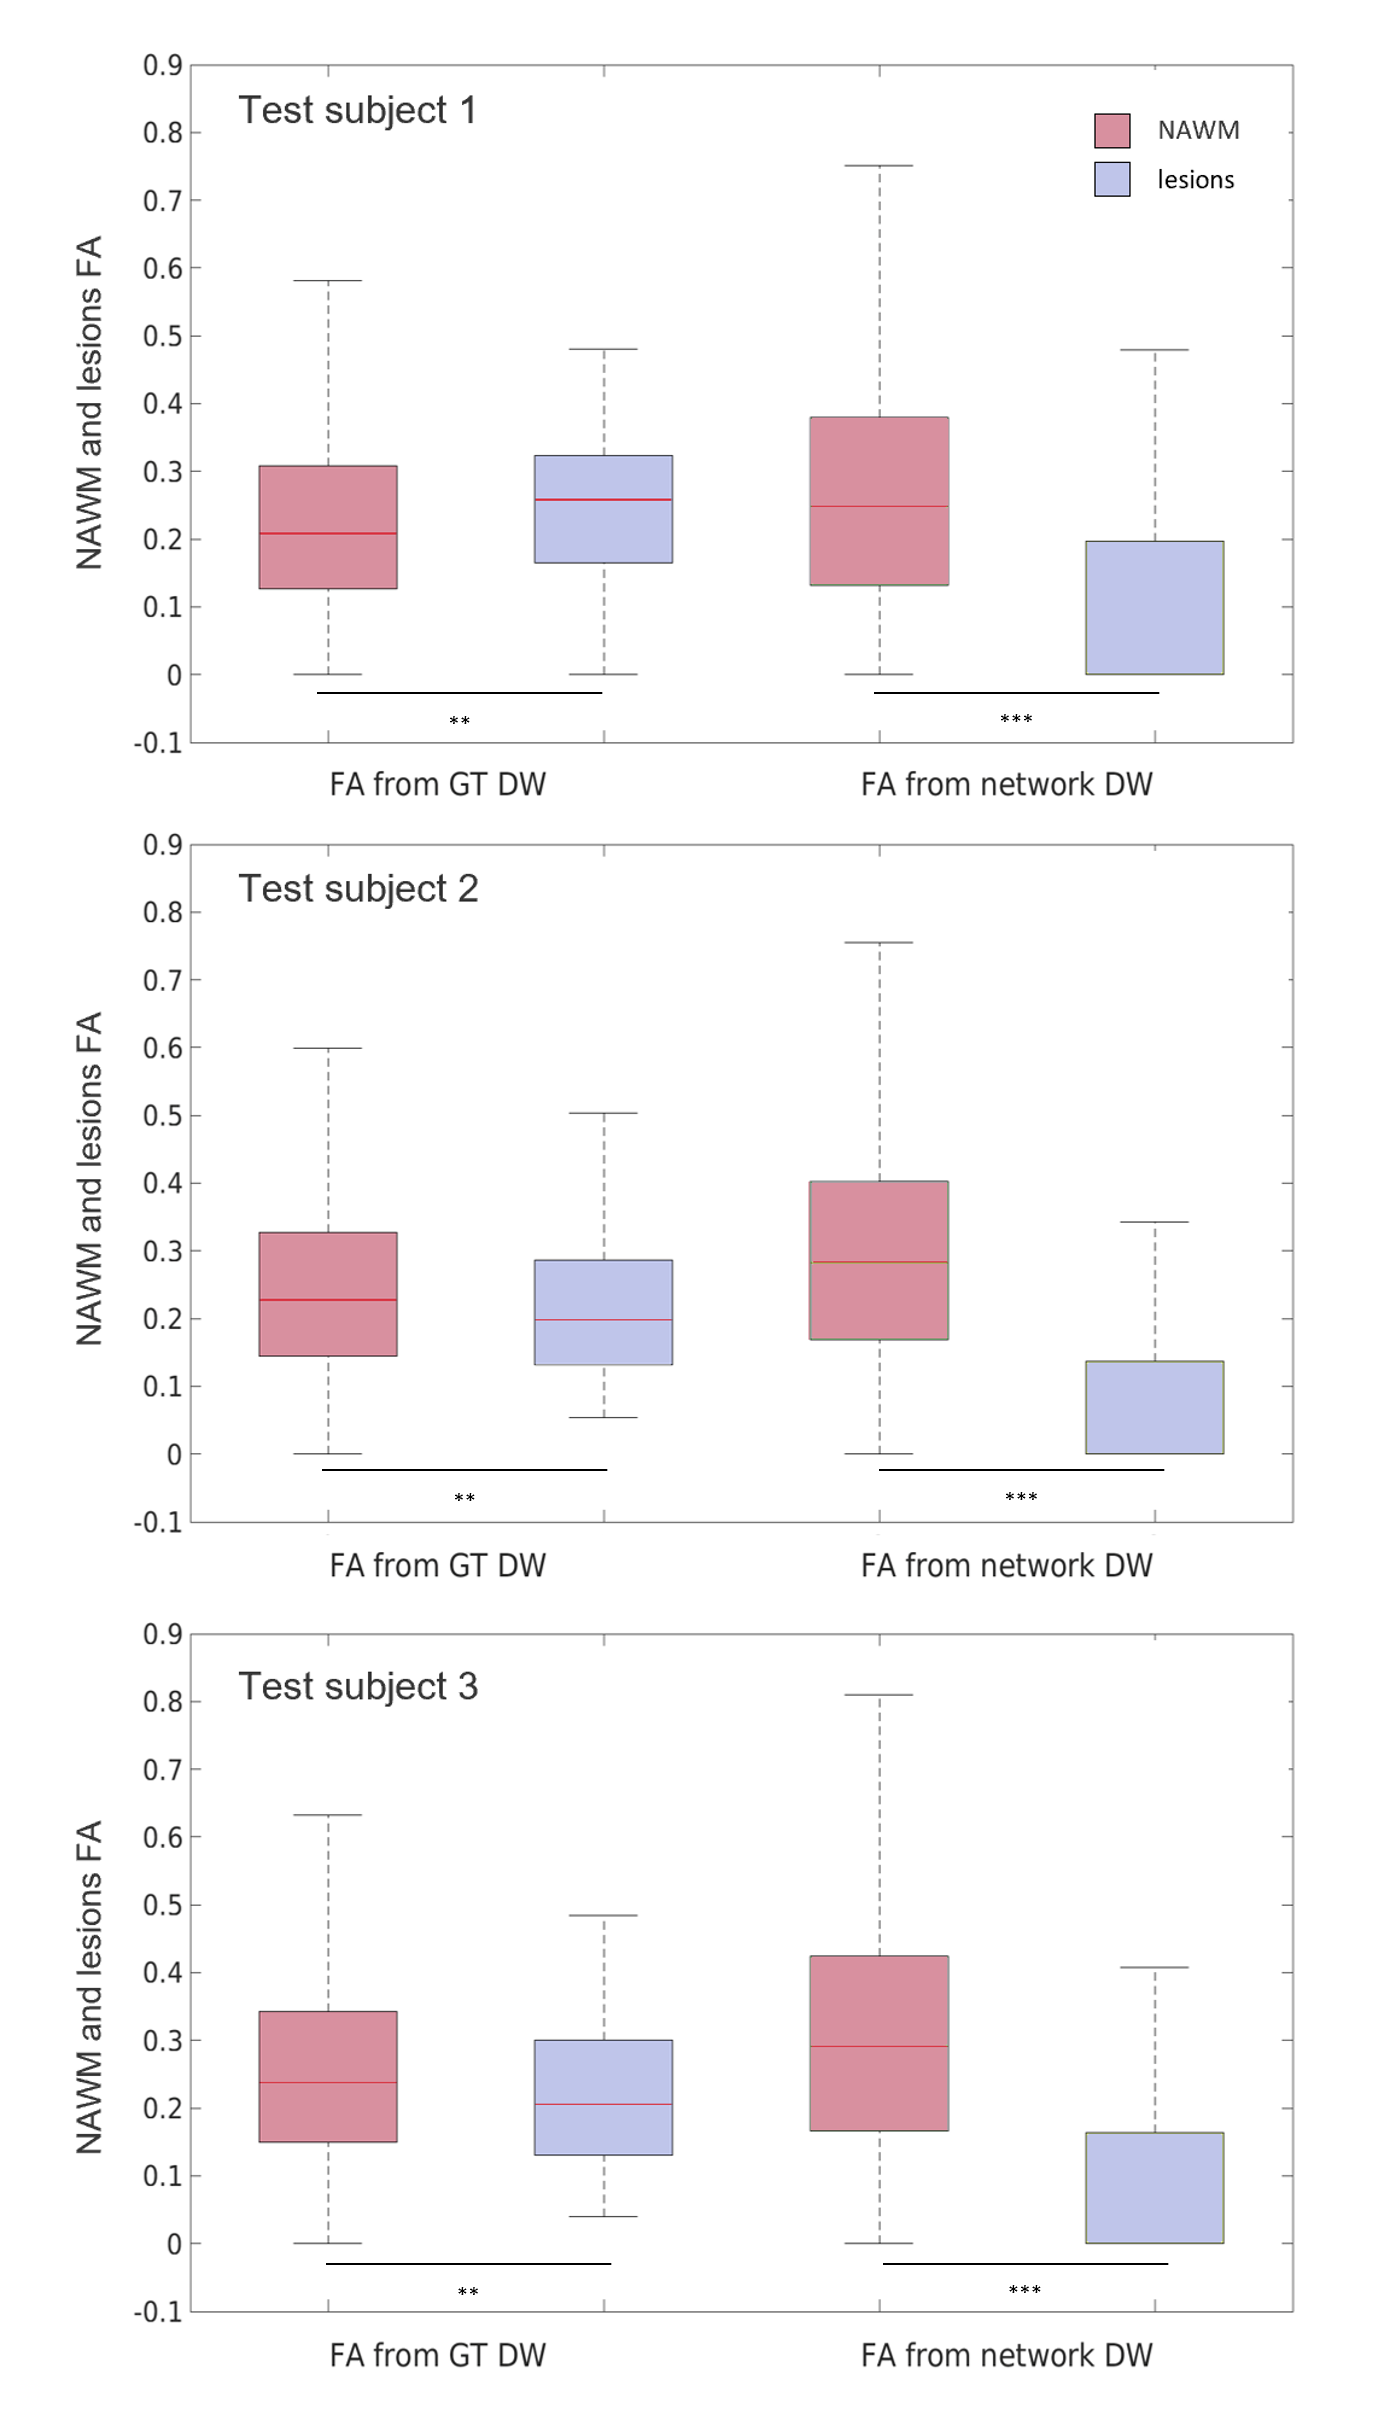
Fig.5: The boxplots show the fractional anisotropy (FA) of the normal appearing white matter (NAWM) and the FA of lesions for three test subjects with WM lesions. The first two boxplots refer to the FA calculated from the ground truth (GT) diffusion weighted (DW) images and the other two refer to the FA calculated from the network-produced DW images. Asterisks indicate statistical significance (** p<0.01, *** p<0.000).