4682
Principal Component Analysis Reconstruction Improves Visualization of Multivolume MR Spectroscopic Imaging at 1.5 T1Advanced Imaging Research, Inc., Cleveland, OH, United States, 2Molecular Imaging Section, Radiology, Perelman School of Medicine, University of Pennsylvania, Philadelphia, PA, United States, 3Britton Chance Laboratory of Redox Imaging, Radiology, Perelman School of Medicine, University of Pennsylvania, Philadelphia, PA, United States
Synopsis
Keywords: Software Tools, Data Processing, principal component analysis
Motivation: We address the critical problem of the low signal-to-noise ratio (SNR) of in vivo MR spectroscopic imaging (MRSI) at 1.5 tesla using principal component analysis (PCA).
Goal(s): We seek to improve the translatability of MRSI acquired in 1.5T clinical scanners by improving data visualization using PCA reconstruction (PCAR).
Approach: We initially corrected for spectral phase and frequency variations in multivolume 31P and 1H MRSI data noninvasively acquired at 1.5 T from human subjects and subsequently used PCAR.
Results: We validate the improvement of the MRSI data after PCAR by demonstrating signals that were not distinguishable in the original datasets.
Impact: Principal component analysis reconstruction (PCAR) improves the accuracy to assess spectral signals from multivolume 31P and 1H MR spectroscopic imaging data acquired on highly accessible 1.5T clinical scanners, increasing their potential to become noninvasive metabolic biomarkers of human diseases.
Introduction
Principal component analysis (PCA) offers a systematic approach to reduce the dimensionality of large sets of repetitive data while retaining critical information.1-3 By transforming the original data into a new set of orthogonal variables, known as principal components (PCs), PCA enables the extraction of essential features, improves data visualization, and aids in identifying subtle data variations. On the other hand, in vivo magnetic resonance spectroscopic imaging (MRSI) is a noninvasive imaging modality that provides valuable insights into critical information about the metabolic composition of tissues and organs.4,5 However, the MRSI’s translation to the medical arena has been challenging due to the vast amount of spectral data generated and the difficulty of assessing the spectral signals due to the technology’s intrinsic insensitivity. In this work, we explored using PCA to improve the interpretability and analysis accuracy of multivolume MRSI acquired at 1.5T from human subjects, aiming at increasing the potential of translating the methodology to the clinical realm.Materials & Methods
Using proprietary dual-tuned (1H/31P) RF coils, a stringent B0-field shimming, maximizing the 31P signal strength by 1H-irradiation, and employing the chemical shift imaging (CSI) algorithm for optimal localization, we noninvasively obtained 3D 31P-MRSI data from brains and cancer masses of human subjects, at 1.5T.6 We also acquired 1H MRSI from the brains of patients with amyotrophic lateral sclerosis (ALS). Using our proprietary software 3DiCSI, we processed the spectral data, visualized its spatial distribution, and minimized the frequency, phase, and line-shape variations using principal component analysis (PCA).7 We subsequently used PCA reconstruction of the spectra to improve the signal-to-noise ratio (SNR),1 correct the baseline, and reduce the contribution of tissues surrounding the region of interest.2,3Results
Figure 1 shows an extracted voxel from a 3D 31P MRSI dataset acquired from the brain of a healthy volunteer. Spectrum A was extracted from the original dataset, while spectrum B is the PCA-reconstructed spectrum. The comparison of both spectra shows a substantial increase in the SNR after PCAR. The arrow marking the upfield shoulder of αATP marks the region of the NAD indices, visible in both panels but significantly improved by PCAR.Figure 2 depicts the results of a 2D 1H MRSI study obtained from the brain of a patient with ALS. Although never described before, the reconstructed spectrum in panel B demonstrates the presence of lactate. The signal of this metabolite is inverted due to the echo time utilized for the acquisition. Like Figure 1, this study shows a significant improvement in SNR that allows visualizing signals at lower concentrations. Although the presence of lactate is striking, the glutamate/glutamine and taurine signals are also easily visualized in the reconstructed spectrum (B).
Figure 3 shows the results of a 3D 31P MRSI dataset acquired from the femoral region of a patient with lymphoma. The figure shows two voxels from this dataset, one mostly embedded in the tumor mass (panels A-C) and one primarily embedded in muscle (panels D-F). In this study, PCA showed two principal components with distinct spectral patterns. One PC showed a "tumor pattern" (i.e., PCr absence with a prominent phosphomonoester [PME] signal), similar to the one we have reported when a voxel is centered in a large tumor mass.8 The other showed a "muscle pattern" (i.e., mainly a large phosphocreatine [PCr] signal).
Interestingly, PCAR showed a more substantial SNR improvement on voxels where the muscle pattern was prominent. This is patent in the spectrum shown in panels D-F that has the largest muscle contribution (compare panels B vs. E). Furthermore, given that most of the signals from muscle appeared in one principal component, we reconstructed the dataset without it (panels C and F), thus canceling almost entirely the muscle signals in the dataset. In this way, the small but important muscle contribution on the voxel situated mainly in the tumor is wholly canceled (panel B vs C), while the voxel located adjacent to the tumor with a large muscle contribution, now demonstrates tumor signals previously obscured by the strong muscle contribution in this voxel (panel E vs. panel F).
Discussion & Conclusions
We investigated the feasibility of using principal component analysis to reconstruct multivolume 1H and 31P datasets acquired in vivo from human subjects. As reported previously, the PCAR approach improves the SNR of the dataset. Significantly, using this method to enhance the visualization of spectral signals from in vivo studies acquired on highly accessible 1.5T clinical scanners will potentially facilitate the translation of the methodology to the medical arena.Acknowledgements
This work was supported by US NIH Grants R01CA118559 and R21CA152858 (PI: F. Arias-Mendoza) for the data acquisition and US NIH Grant R44MH122273 and R44AG085817 (PI: R. Srinivasan) for the data analysis.References
1. Abdoli A, Stoyanova R, Maudsley AA. Denoising of MR spectroscopic imaging data using statistical selection of principal components. MAGMA. 2016;29(6):811-22. Epub 20160603. doi: 10.1007/s10334-016-0566-z. PubMed PMID: 27260664; PMCID: PMC5699222.
2. Stoyanova R, Brown TR. NMR spectral quantitation by principal component analysis. NMR Biomed. 2001;14(4):271-7. PubMed PMID: 11410945.
3. Stoyanova R, Brown TR. NMR spectral quantitation by principal component analysis. III. A generalized procedure for determination of lineshape variations. J Magn Reson. 2002;154(2):163-75. PubMed PMID: 11846573.
4. Arias-Mendoza F. In vivo magnetic resonance spectroscopy in the evaluation of mitochondrial disorders. Mitochondrion. 2004;4(5-6):491-501. Epub 20040930. doi: 10.1016/j.mito.2004.07.034. PubMed PMID: 16120408.
5. Arias-Mendoza F, Brown TR. In vivo measurement of phosphorous markers of disease. Dis Markers. 2003;19(2-3):49-68. doi: 10.1155/2004/419095. PubMed PMID: 15096705; PMCID: PMC3851420.
6. Vigneron DB, Nelson SJ, Murphy-Boesch J, Kelley DA, Kessler HB, Brown TR, Taylor JS. Chemical shift imaging of human brain: axial, sagittal, and coronal P-31 metabolite images. Radiology. 1990;177(3):643-9. PubMed PMID: 2243963.
7. Zhao Q, Patriotis P, Arias-Mendoza F, Stoyanova R, Brown TR. An interactive software for 3D chemical shift imaging data analysis and real time spectral localization and quantification. Proc Experimental NMR Conference; Asilomar, CA, USA. p. 1262004. p. 126.
8. Arias-Mendoza F, Payne GS, Zakian KL, Schwarz AJ, Stubbs M, Stoyanova R, Ballon D, Howe FA, Koutcher JA, Leach MO, Griffiths JR, Heerschap A, Glickson JD, Nelson SJ, Evelhoch JL, Charles HC, Brown TR. In vivo 31P MR spectral patterns and reproducibility in cancer patients studied in a multi-institutional trial. NMR Biomed. 2006;19(4):504-12. doi: 10.1002/nbm.1057. PubMed PMID: 16763965.
Figures
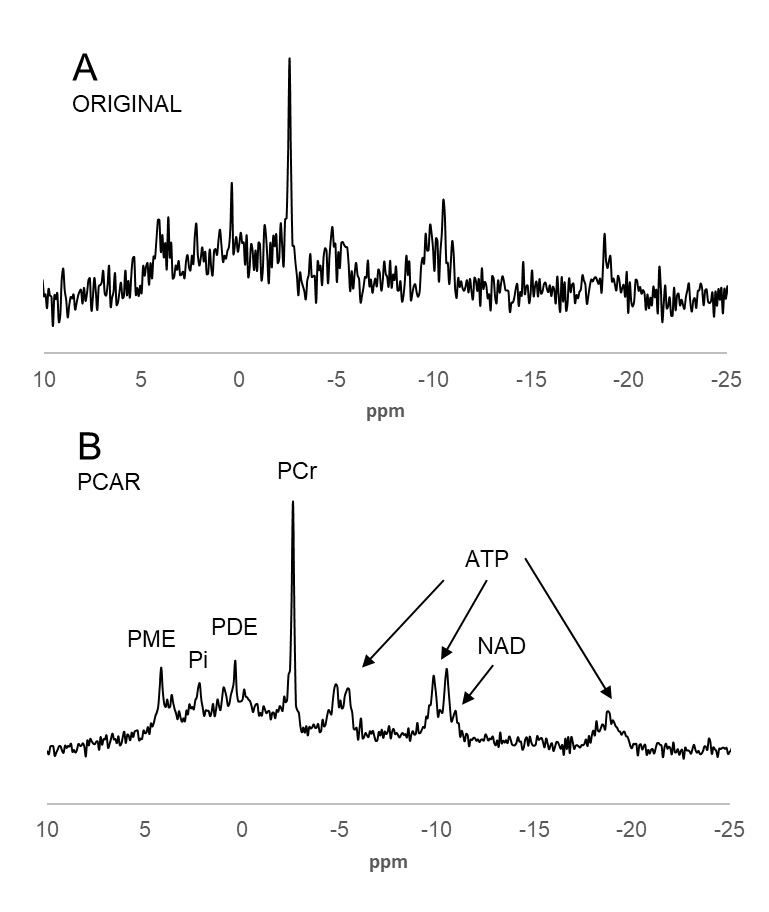
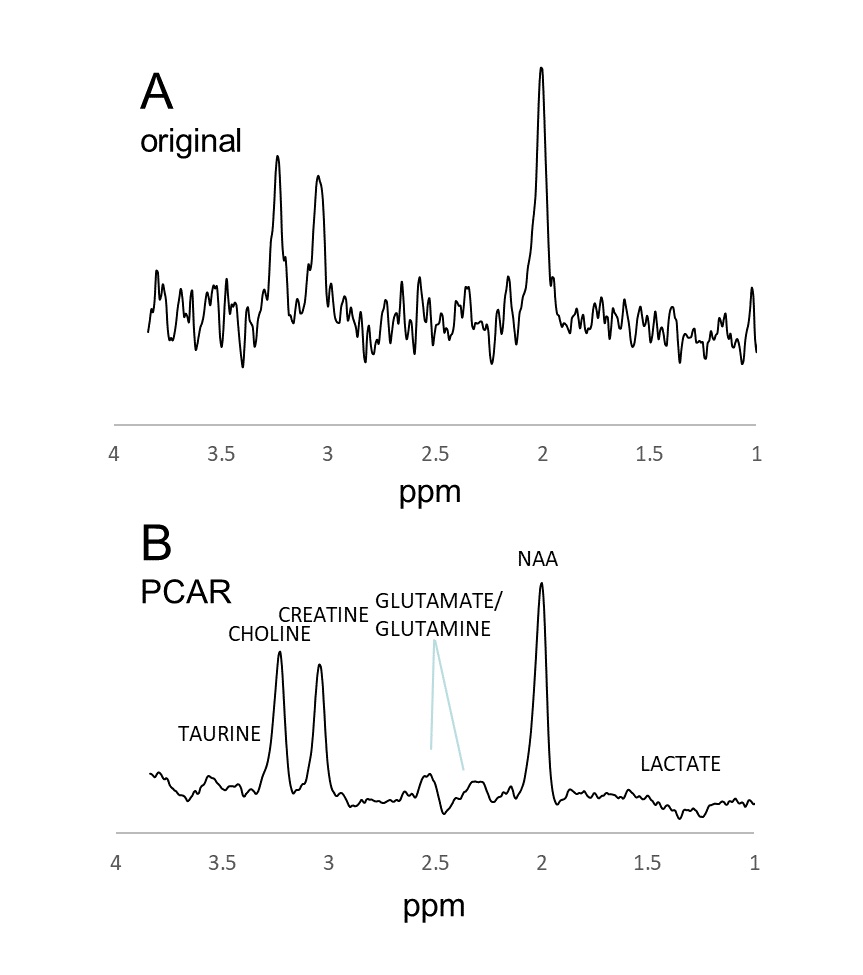
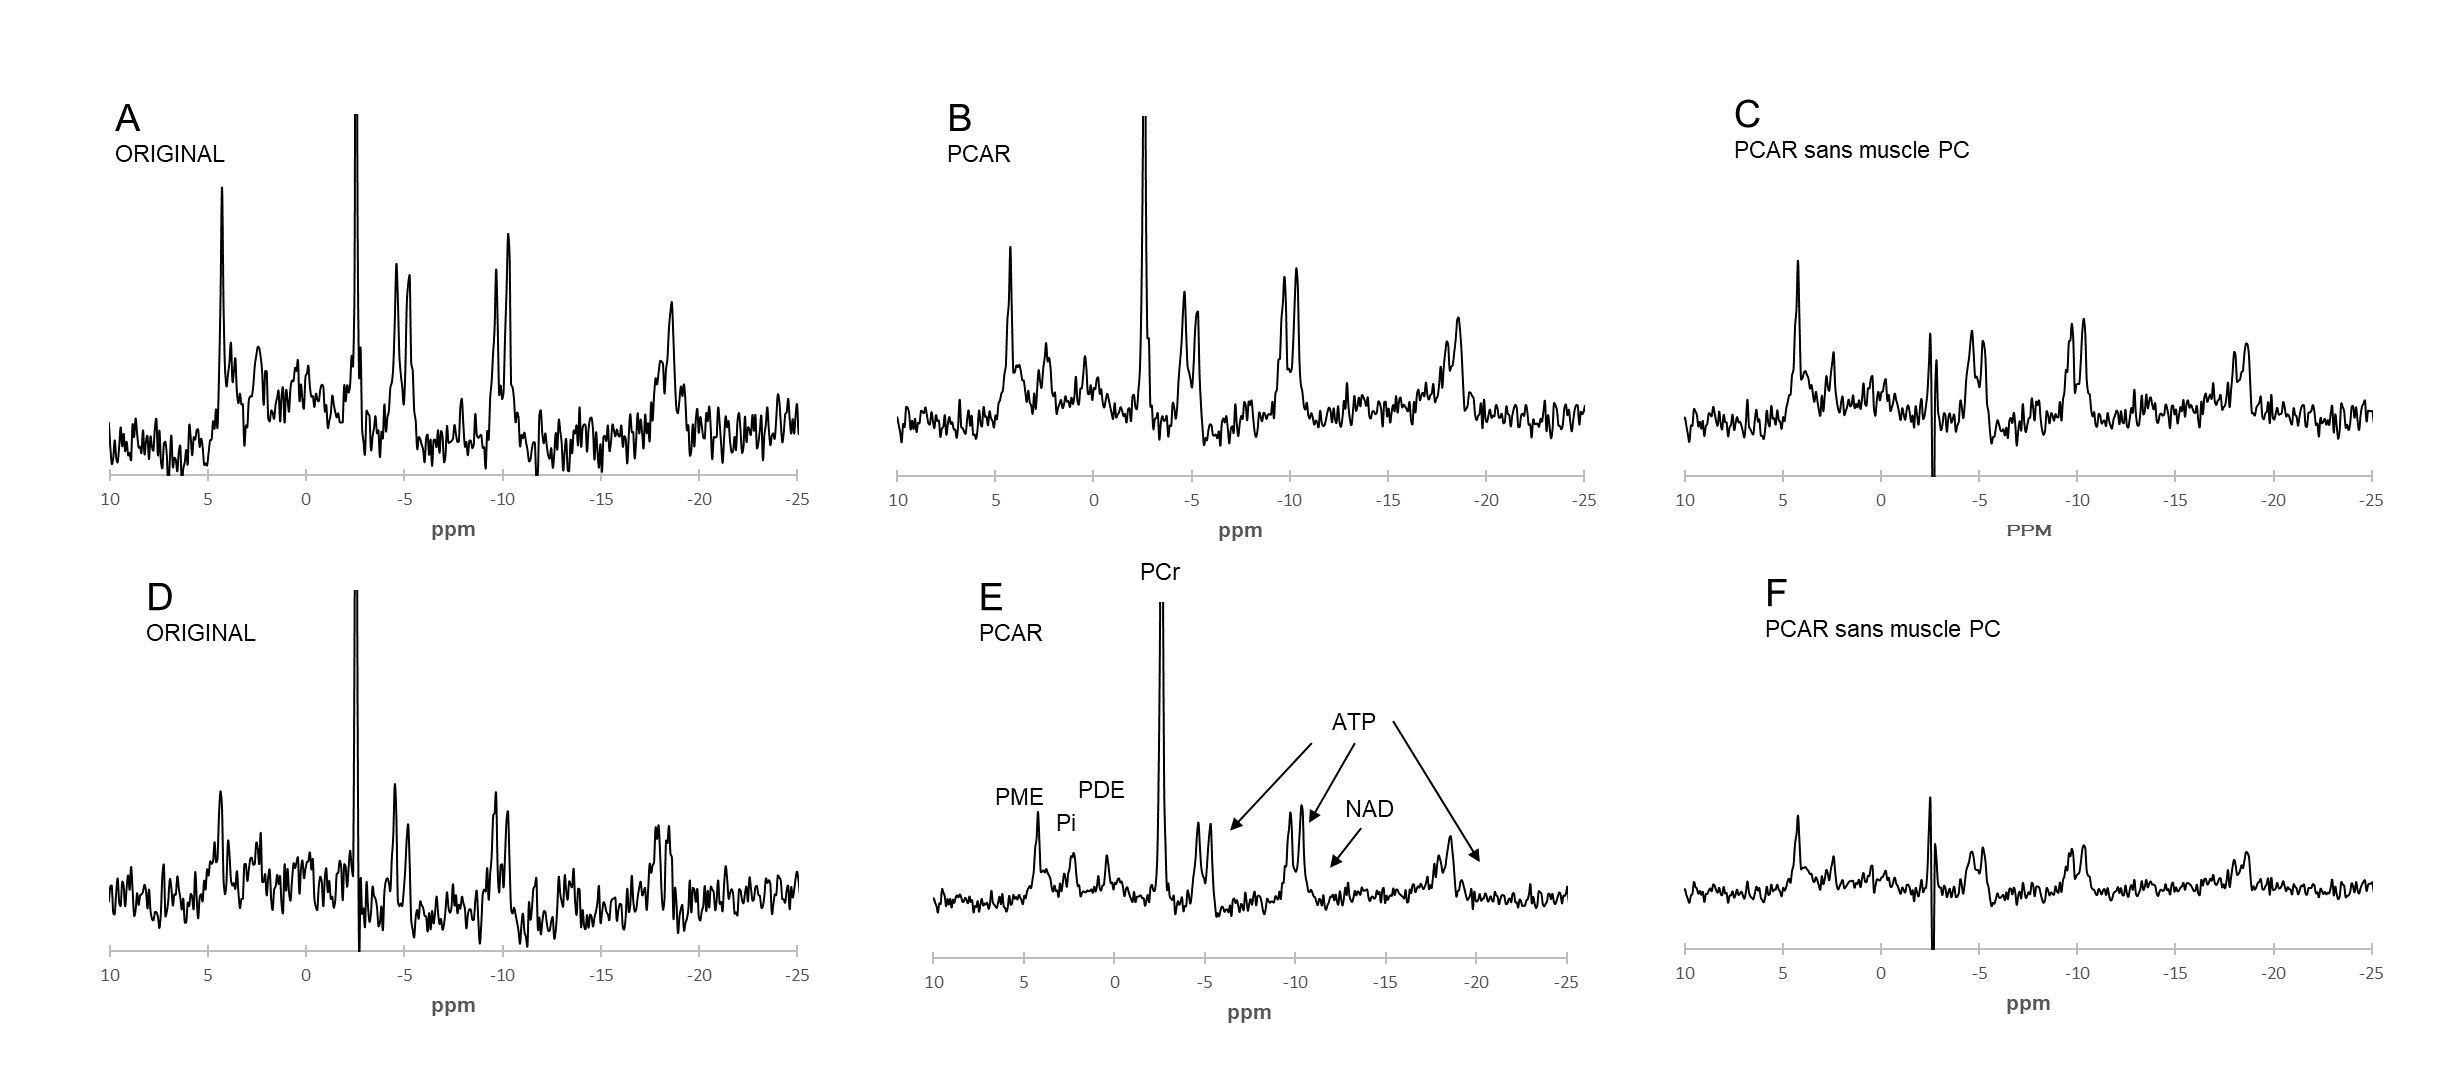
Figure 3. Extracted spectra from a 31P MRSI dataset acquired from the left femoral region of a patient with lymphoma. Assignments are in figure 2. Spectra A-C are from a voxel primarily included in a tumor mass, while spectra D-F are from an adjacent voxel almost wholly included in muscle. Panels A and D show the original spectra, while B and E show the reconstructed spectra using the same procedure as in Figures 1 and 2. The spectra in panels C and F were reconstructed without the PC, which included the most muscle signals. PCr is clipped to show the quality of the rest of the signals.