4678
Bloch simulation of geometric distortion around air bubbles acquired with a 7 T MRI system1MRIsimulations Inc., Tokyo, Japan, 2Kyoto University, Kyoto, Japan
Synopsis
Keywords: Software Tools, Simulations
Motivation: To reproduce geometric distortions around air bubbles imaged with a 7 Tesla MRI system using Bloch simulation.
Goal(s): To find a strategy to calculate geometric distortion caused by susceptibility effects in Bloch simulation.
Approach: Inhomogeneous magnetic fields were calculated using summing up magnetic fields generated by magnetic dipoles in the air bubbles in a spherical phantom.
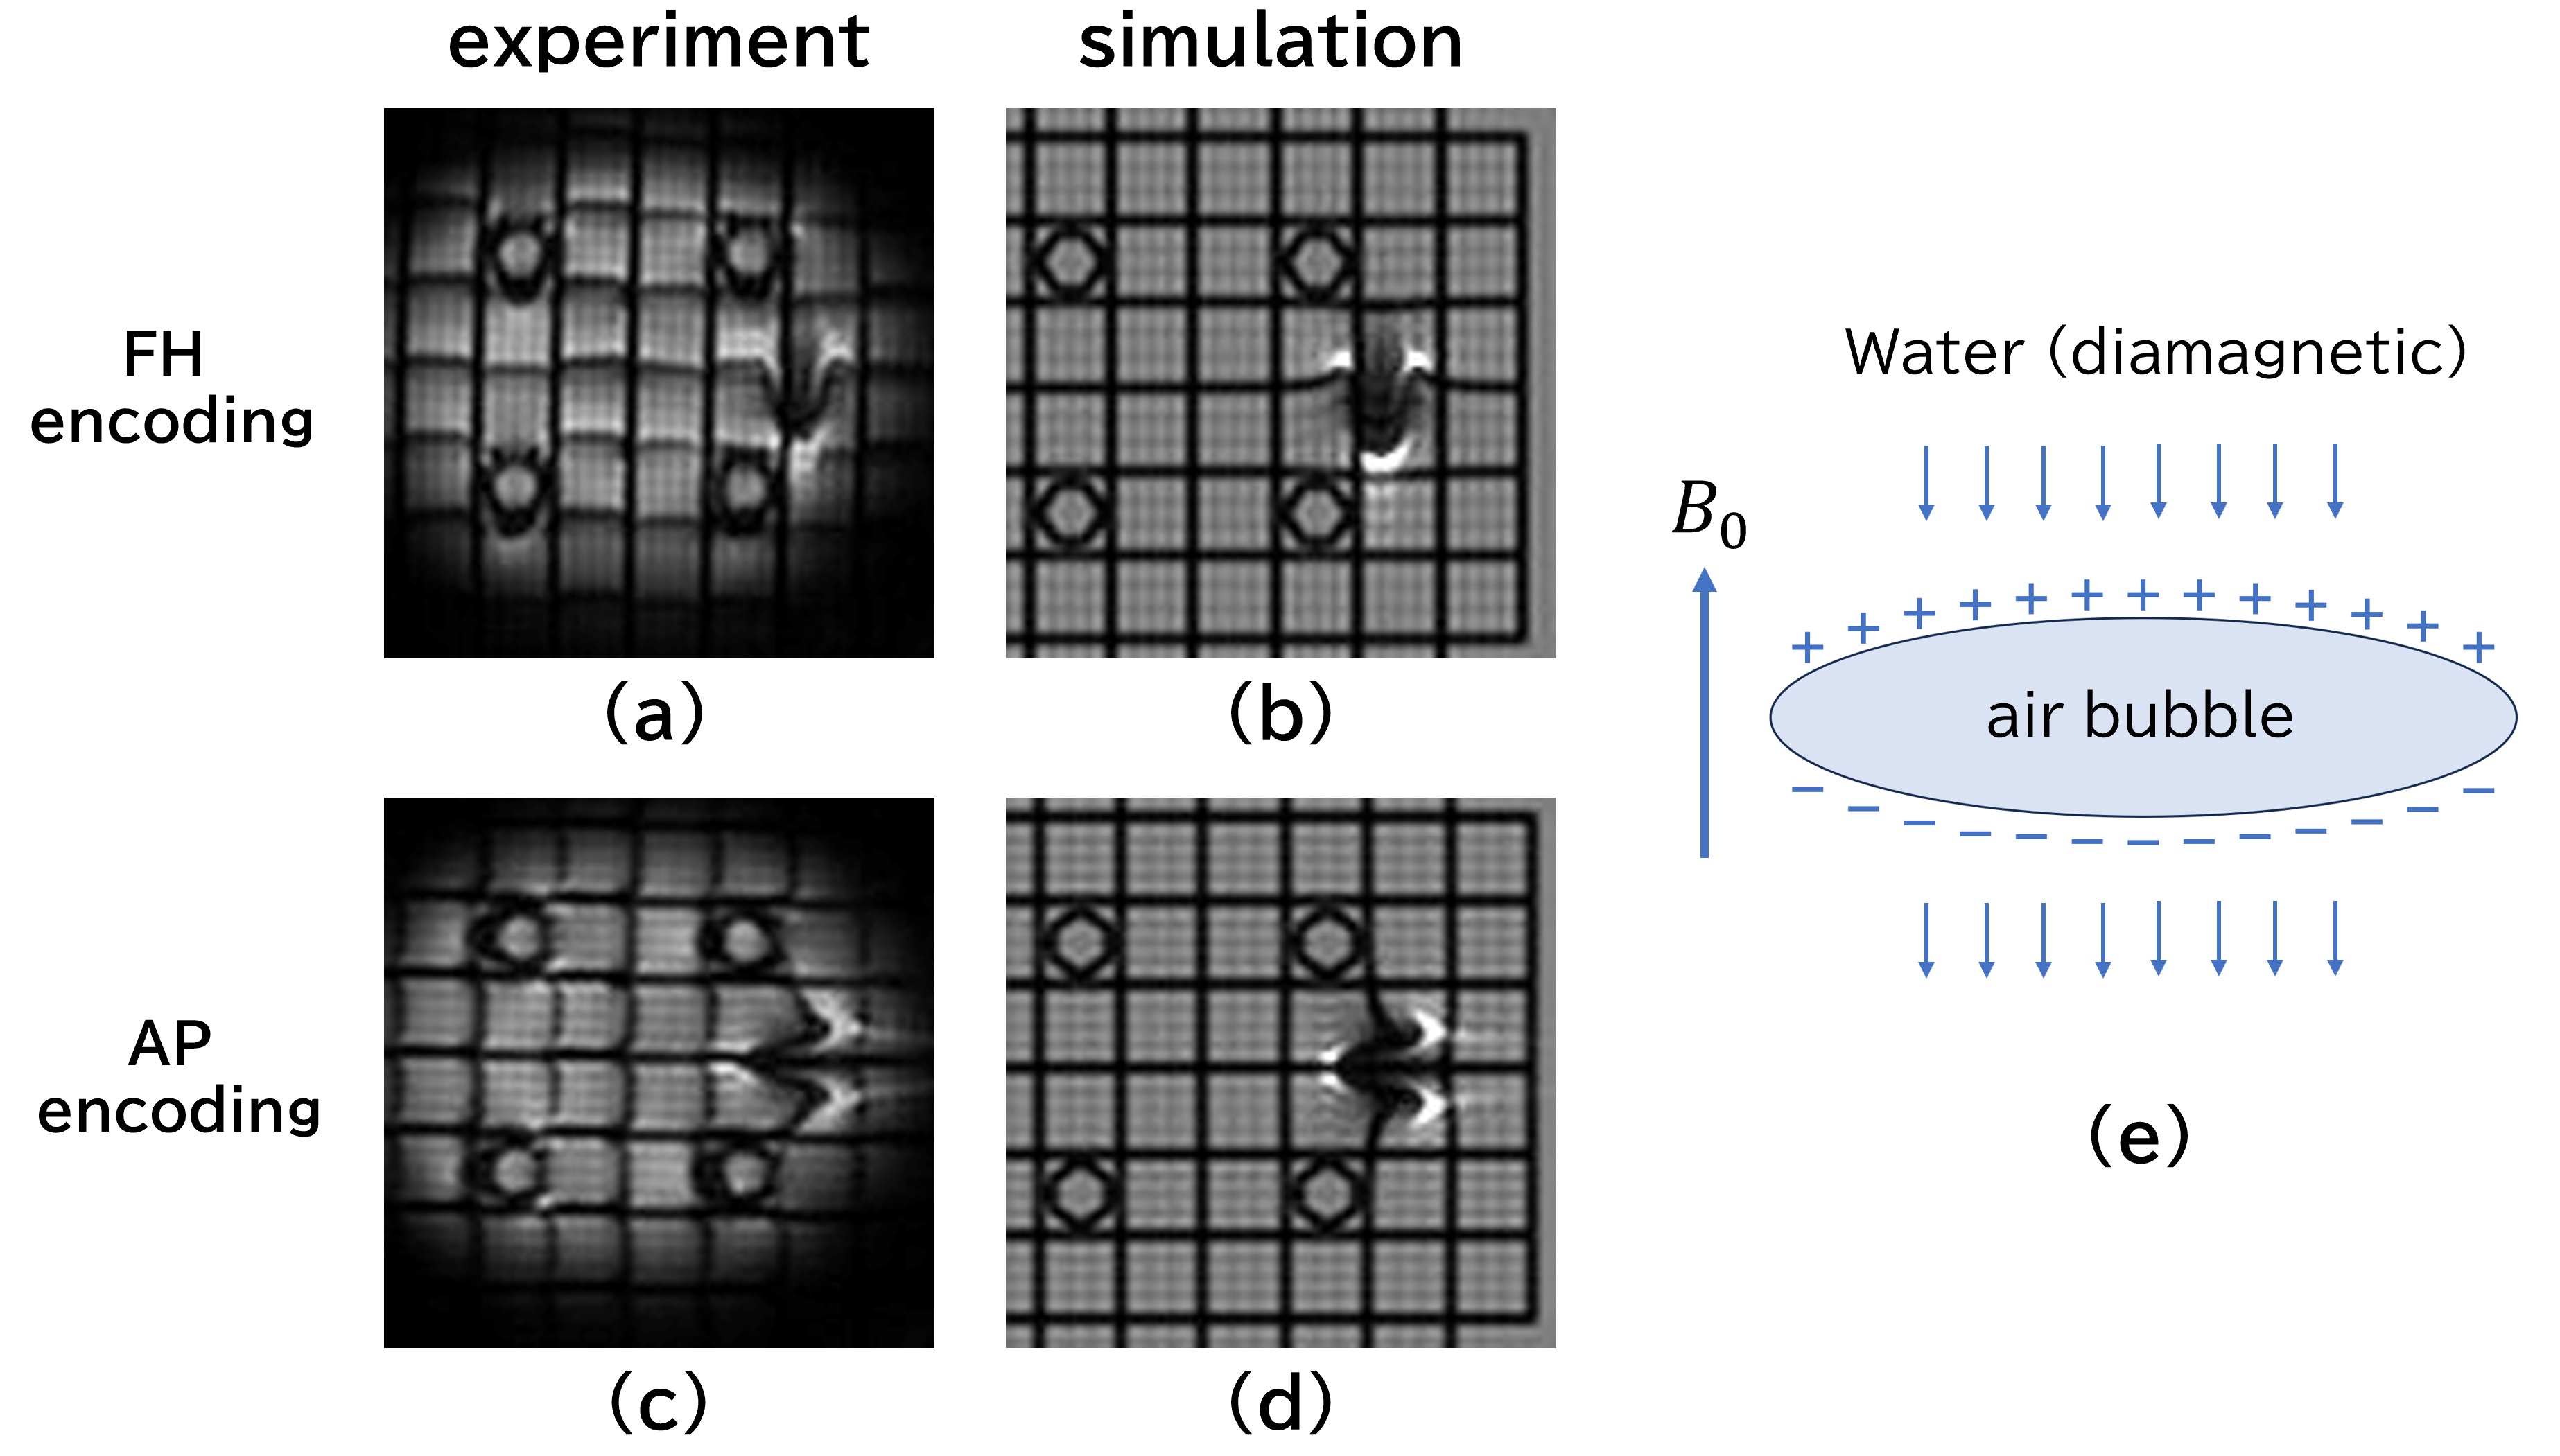
Results: Geometric distortions were reproduced by the Bloch simulations using the inhomogeneous magnetic fields calculated by summation of the magnetic fields generated by the magnetic dipoles in the air bubbles. Bubbles deformed by the strong static magnetic field were observed.
Impact: Geometric distortion around arbitrary shaped air bubbles was reproduced by the Bloch simulation. An air bubble at 7T was found to be deformed by the strong static magnetic field and the large diamagnetic susceptibility of water.
Introduction
MR images of air bubbles have been published in several reports as typical examples of magnetic susceptibility effects1-3. The magnetic susceptibility effects of spherical or cylinder-shaped materials have also been reported as benchmarks for calculations of inhomogeneous magnetic field effects in several Bloch simulators4-8. These examples are for ideal or simple shapes of the materials such as spheres and cylinders, where inhomogeneous magnetic field calculations are straightforward. However, there are no reports of experiments or Bloch simulations for air bubbles with arbitrary shapes. The reasons for this situation are thought to be that it is difficult to create air bubbles with arbitrary shapes, and that calculating the magnetic field distribution around them and the Bloch simulation require a lot of computation time. In this study, a method was developed to calculate the inhomogeneous magnetic field around air bubbles in a spherical phantom, and Bloch simulations were performed to calculate image distortions caused by the inhomogeneous magnetic fields.Materials and methods
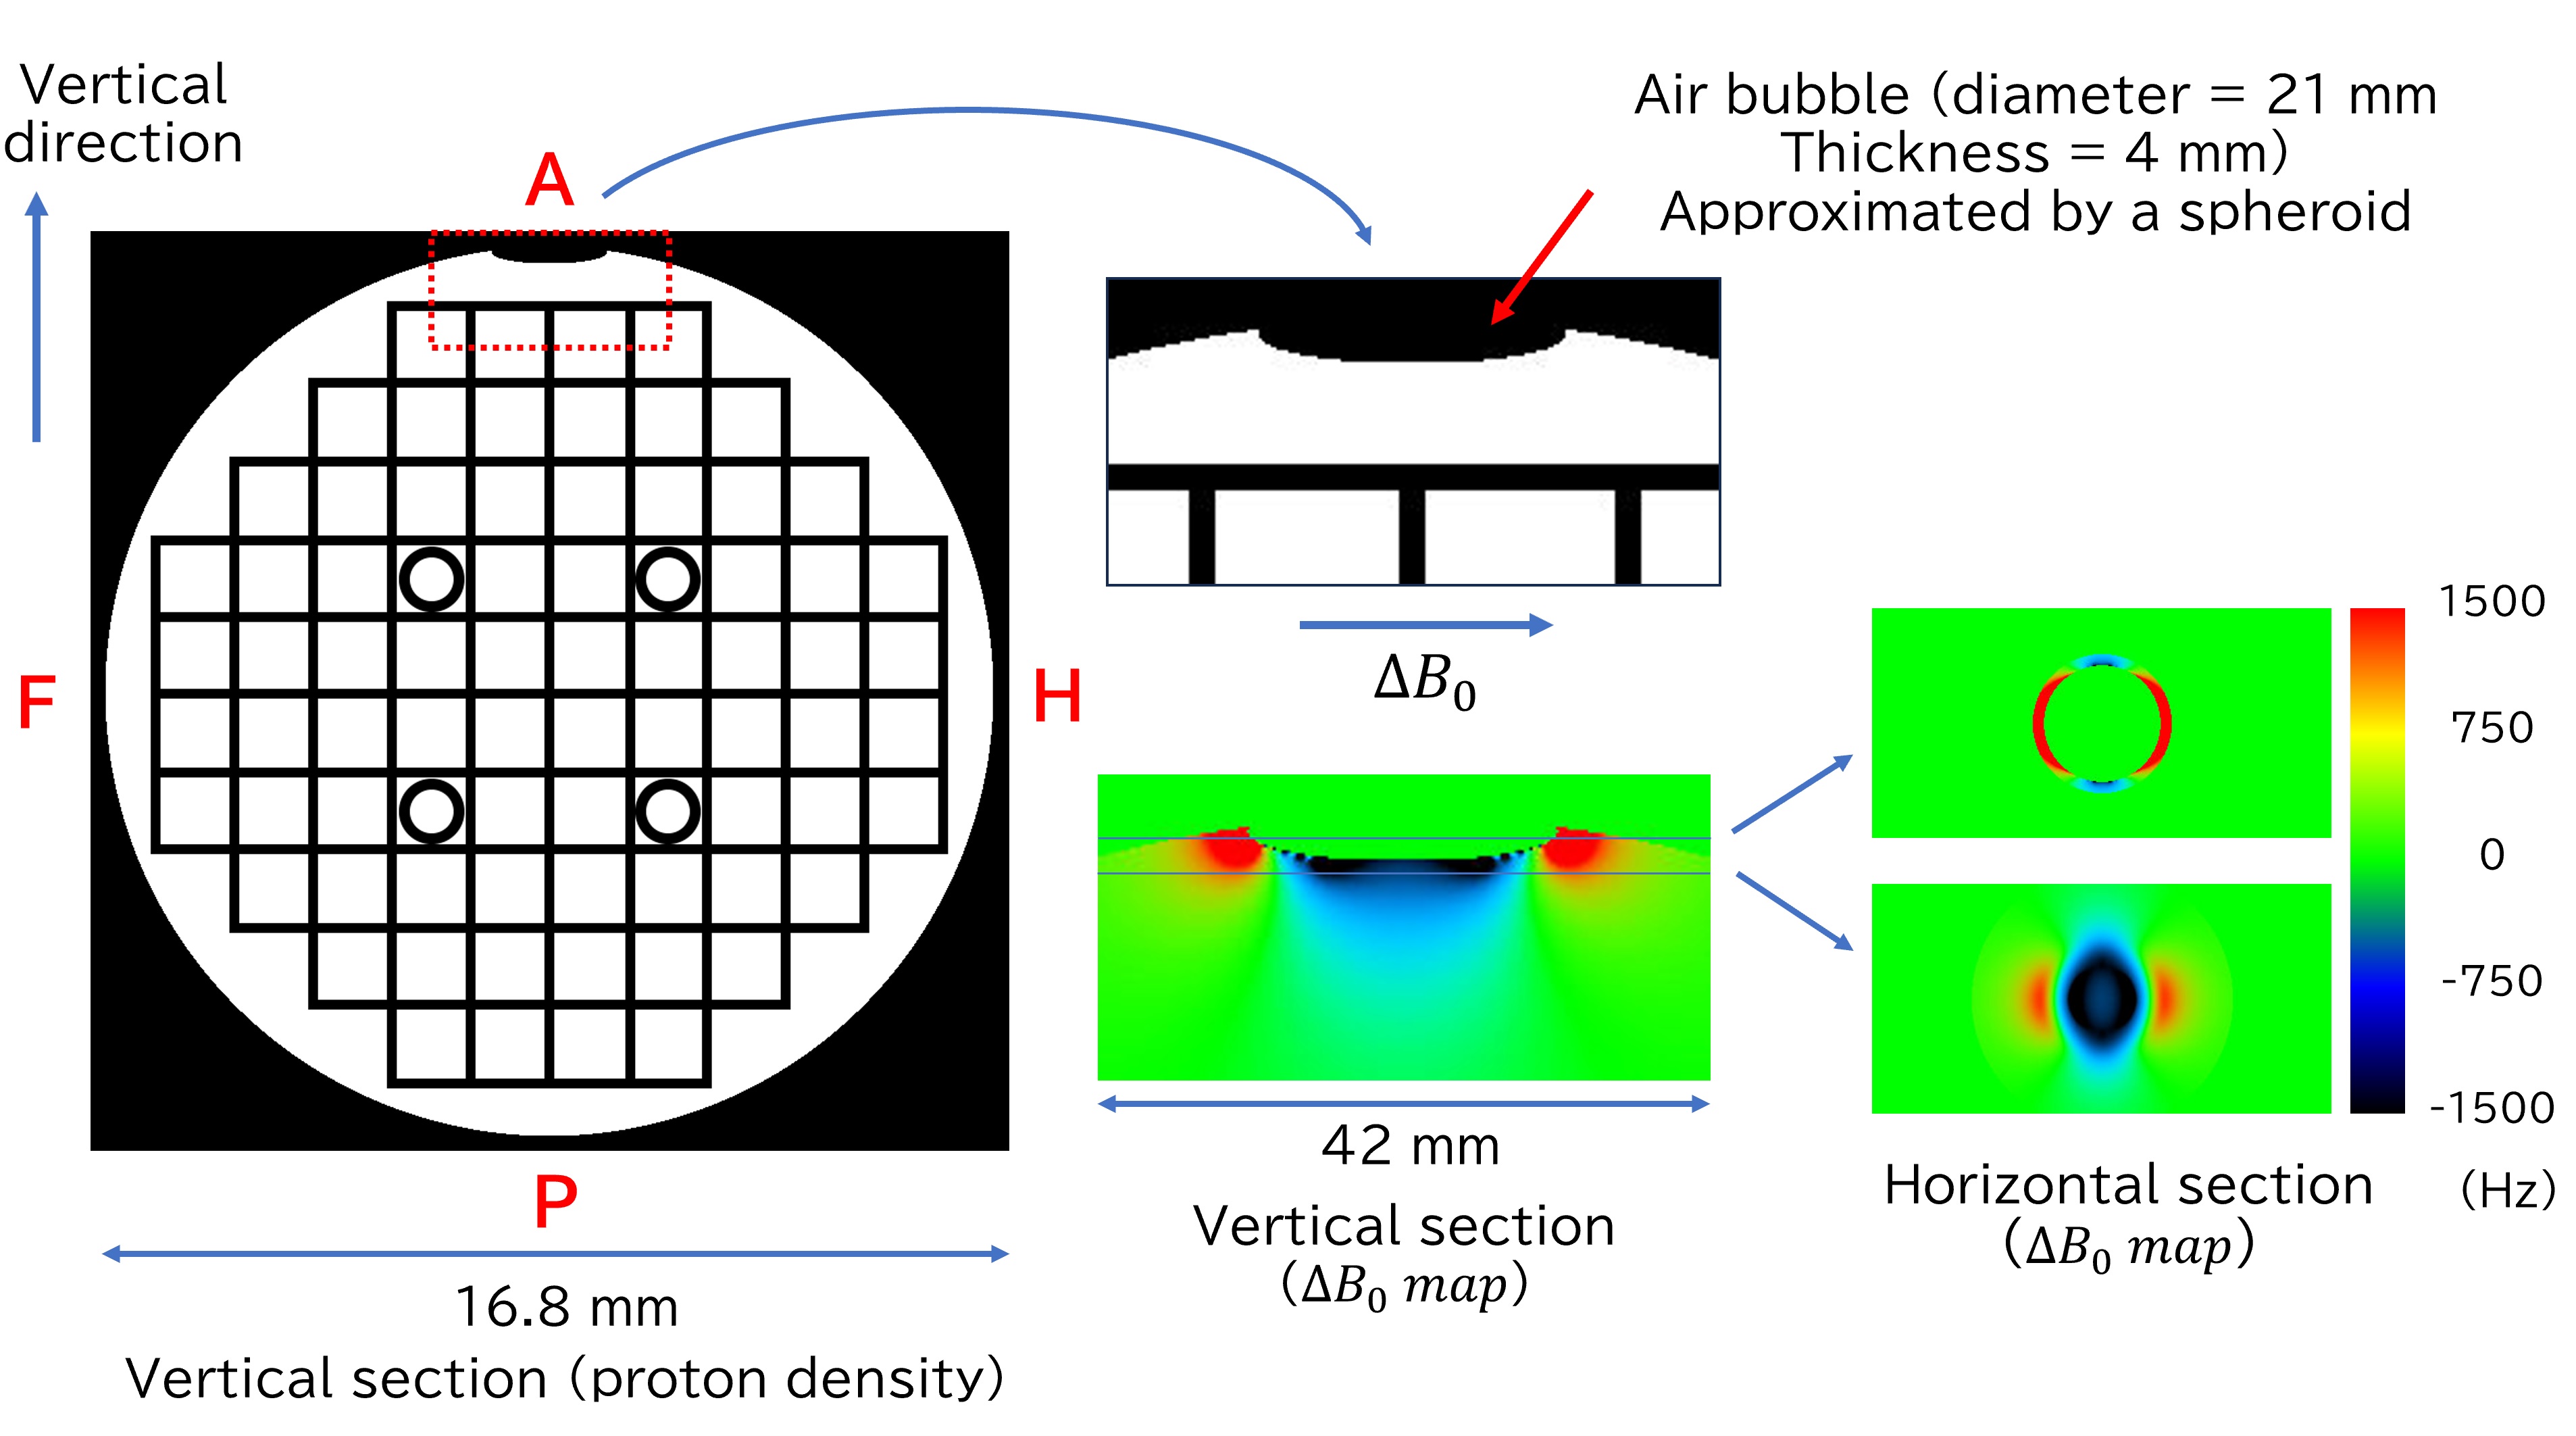
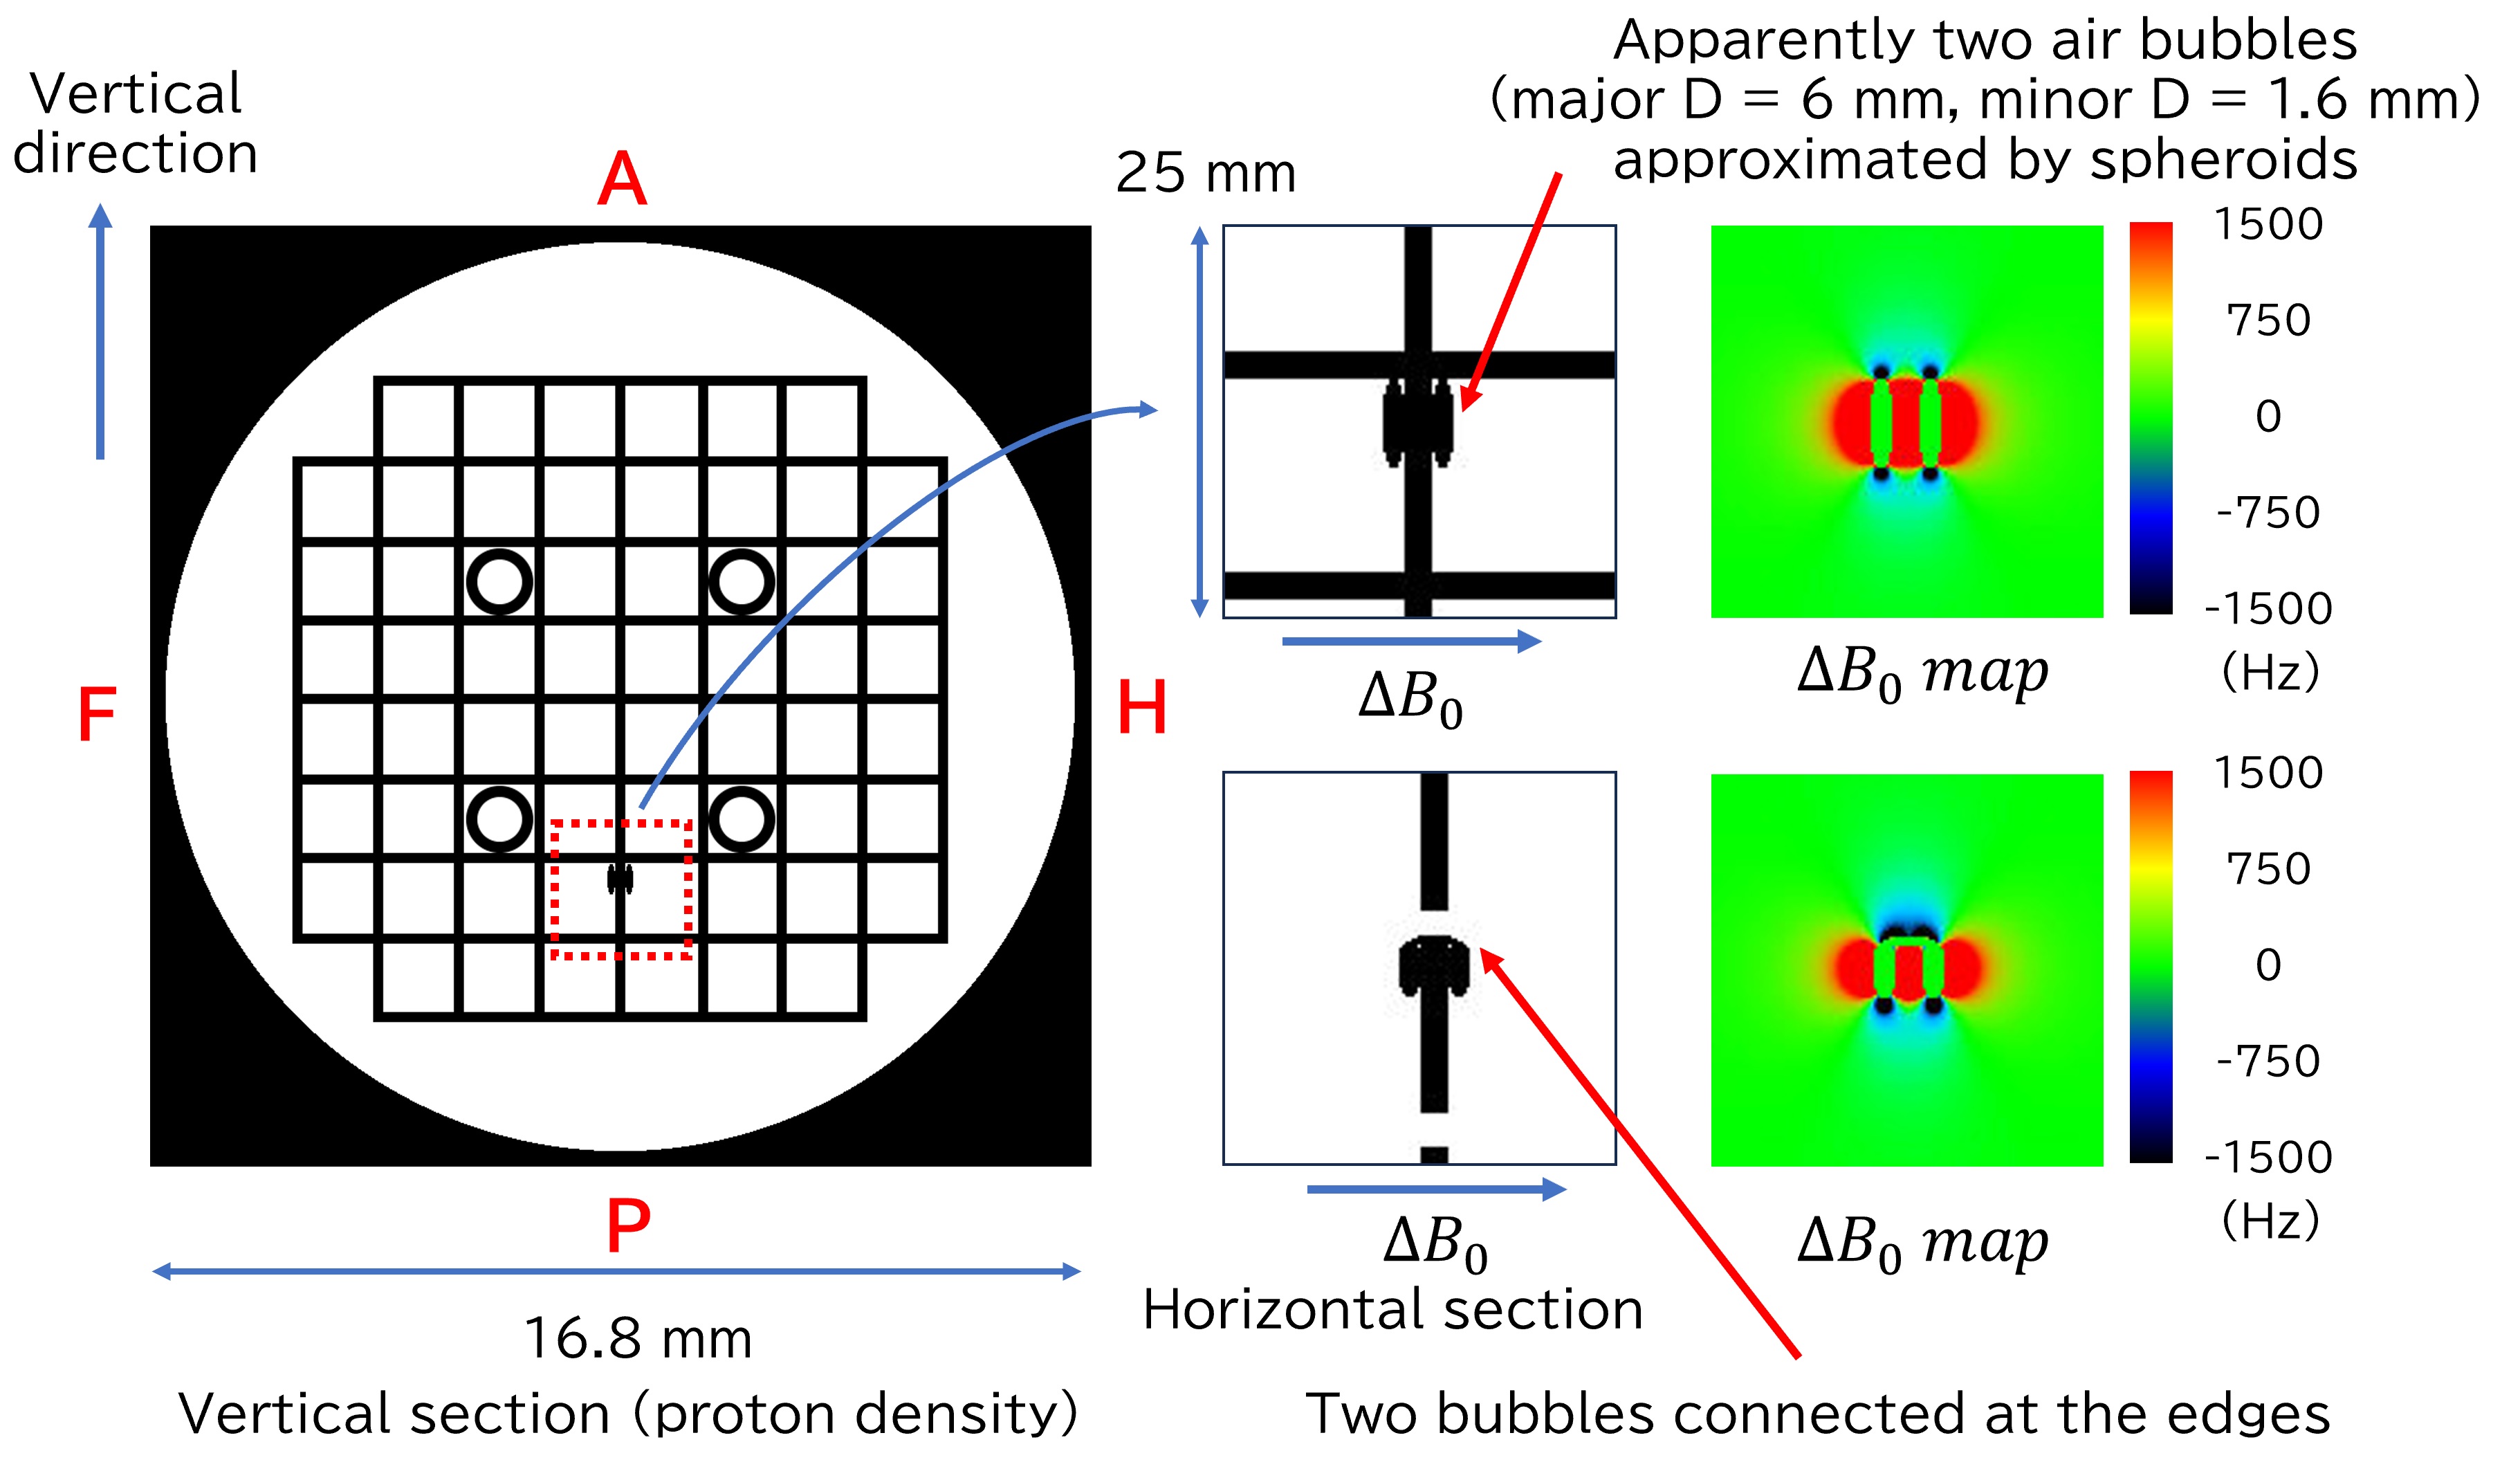
The phantom was an acrylic spherical container (OD = 170 mm , ID = 163 mm) filled with an aqueous NiCl2 solution (8.3 mM), in which a 3D polystyrene lattice was fixed. The 3D lattice was made up of ten 2D lattices with a pitch of 14.5 mm and a height of 10.8 mm, stacked at 13.2 mm intervals. The phantom contained two non-negligible sized bubbles due to accidental factors. One bubble was floating at the top and the other was trapped between the gaps of the 2D lattices (Figs. 1 and 2). The shape of the bubbles was designed or optimized using the MR images acquired in the experiment. The phantom was imaged using an MRI system with a field strength of 6.98 T and a 32-channel head coil. The imaging pulse sequences were MPRAGE (TR = 1760 ms, TE = 3.21 ms, FA = 4°, image matrix = 2563, FOV = (204 mm)3, PBW = 230 Hz) and 2D multislice spin echo EPI (TR = 11800 ms, TE = 79 ms, FA = 90°, slice thickness = 1.5 mm, number of slices = 84, image matrix = 140 × 140, FOV = (210 mm)3, echo spacing = 0.7 ms, PBW = 1623 Hz) sequences. For Bloch simulation, a numerical phantom consisting of proton density, T1 and T2 distributions was created and the inhomogeneous static magnetic field distribution due to the air bubbles (ΔB0 map) was calculated. The ΔB0 map was obtained by summing up the dipole magnetic field in the bubbles, assuming that dipoles of opposite sign to the magnetic susceptibility of the aqueous solution are uniformly distributed, since the diamagnetic field of the spherical phantom is uniform. T1 and T2 for the numerical phantom was constant (200 and 120 ms) over the phantom. In the numerical phantom, the matrix size was 840 × 840 × 210 and the pixel size was (0.1992 mm)3 (Figs. 1 and 2). The pulse sequences used in the simulations were created using the sequence parameters. BlochSolver3 was used for the simulation and the calculations were performed using an RTX 3090 GPU.Results
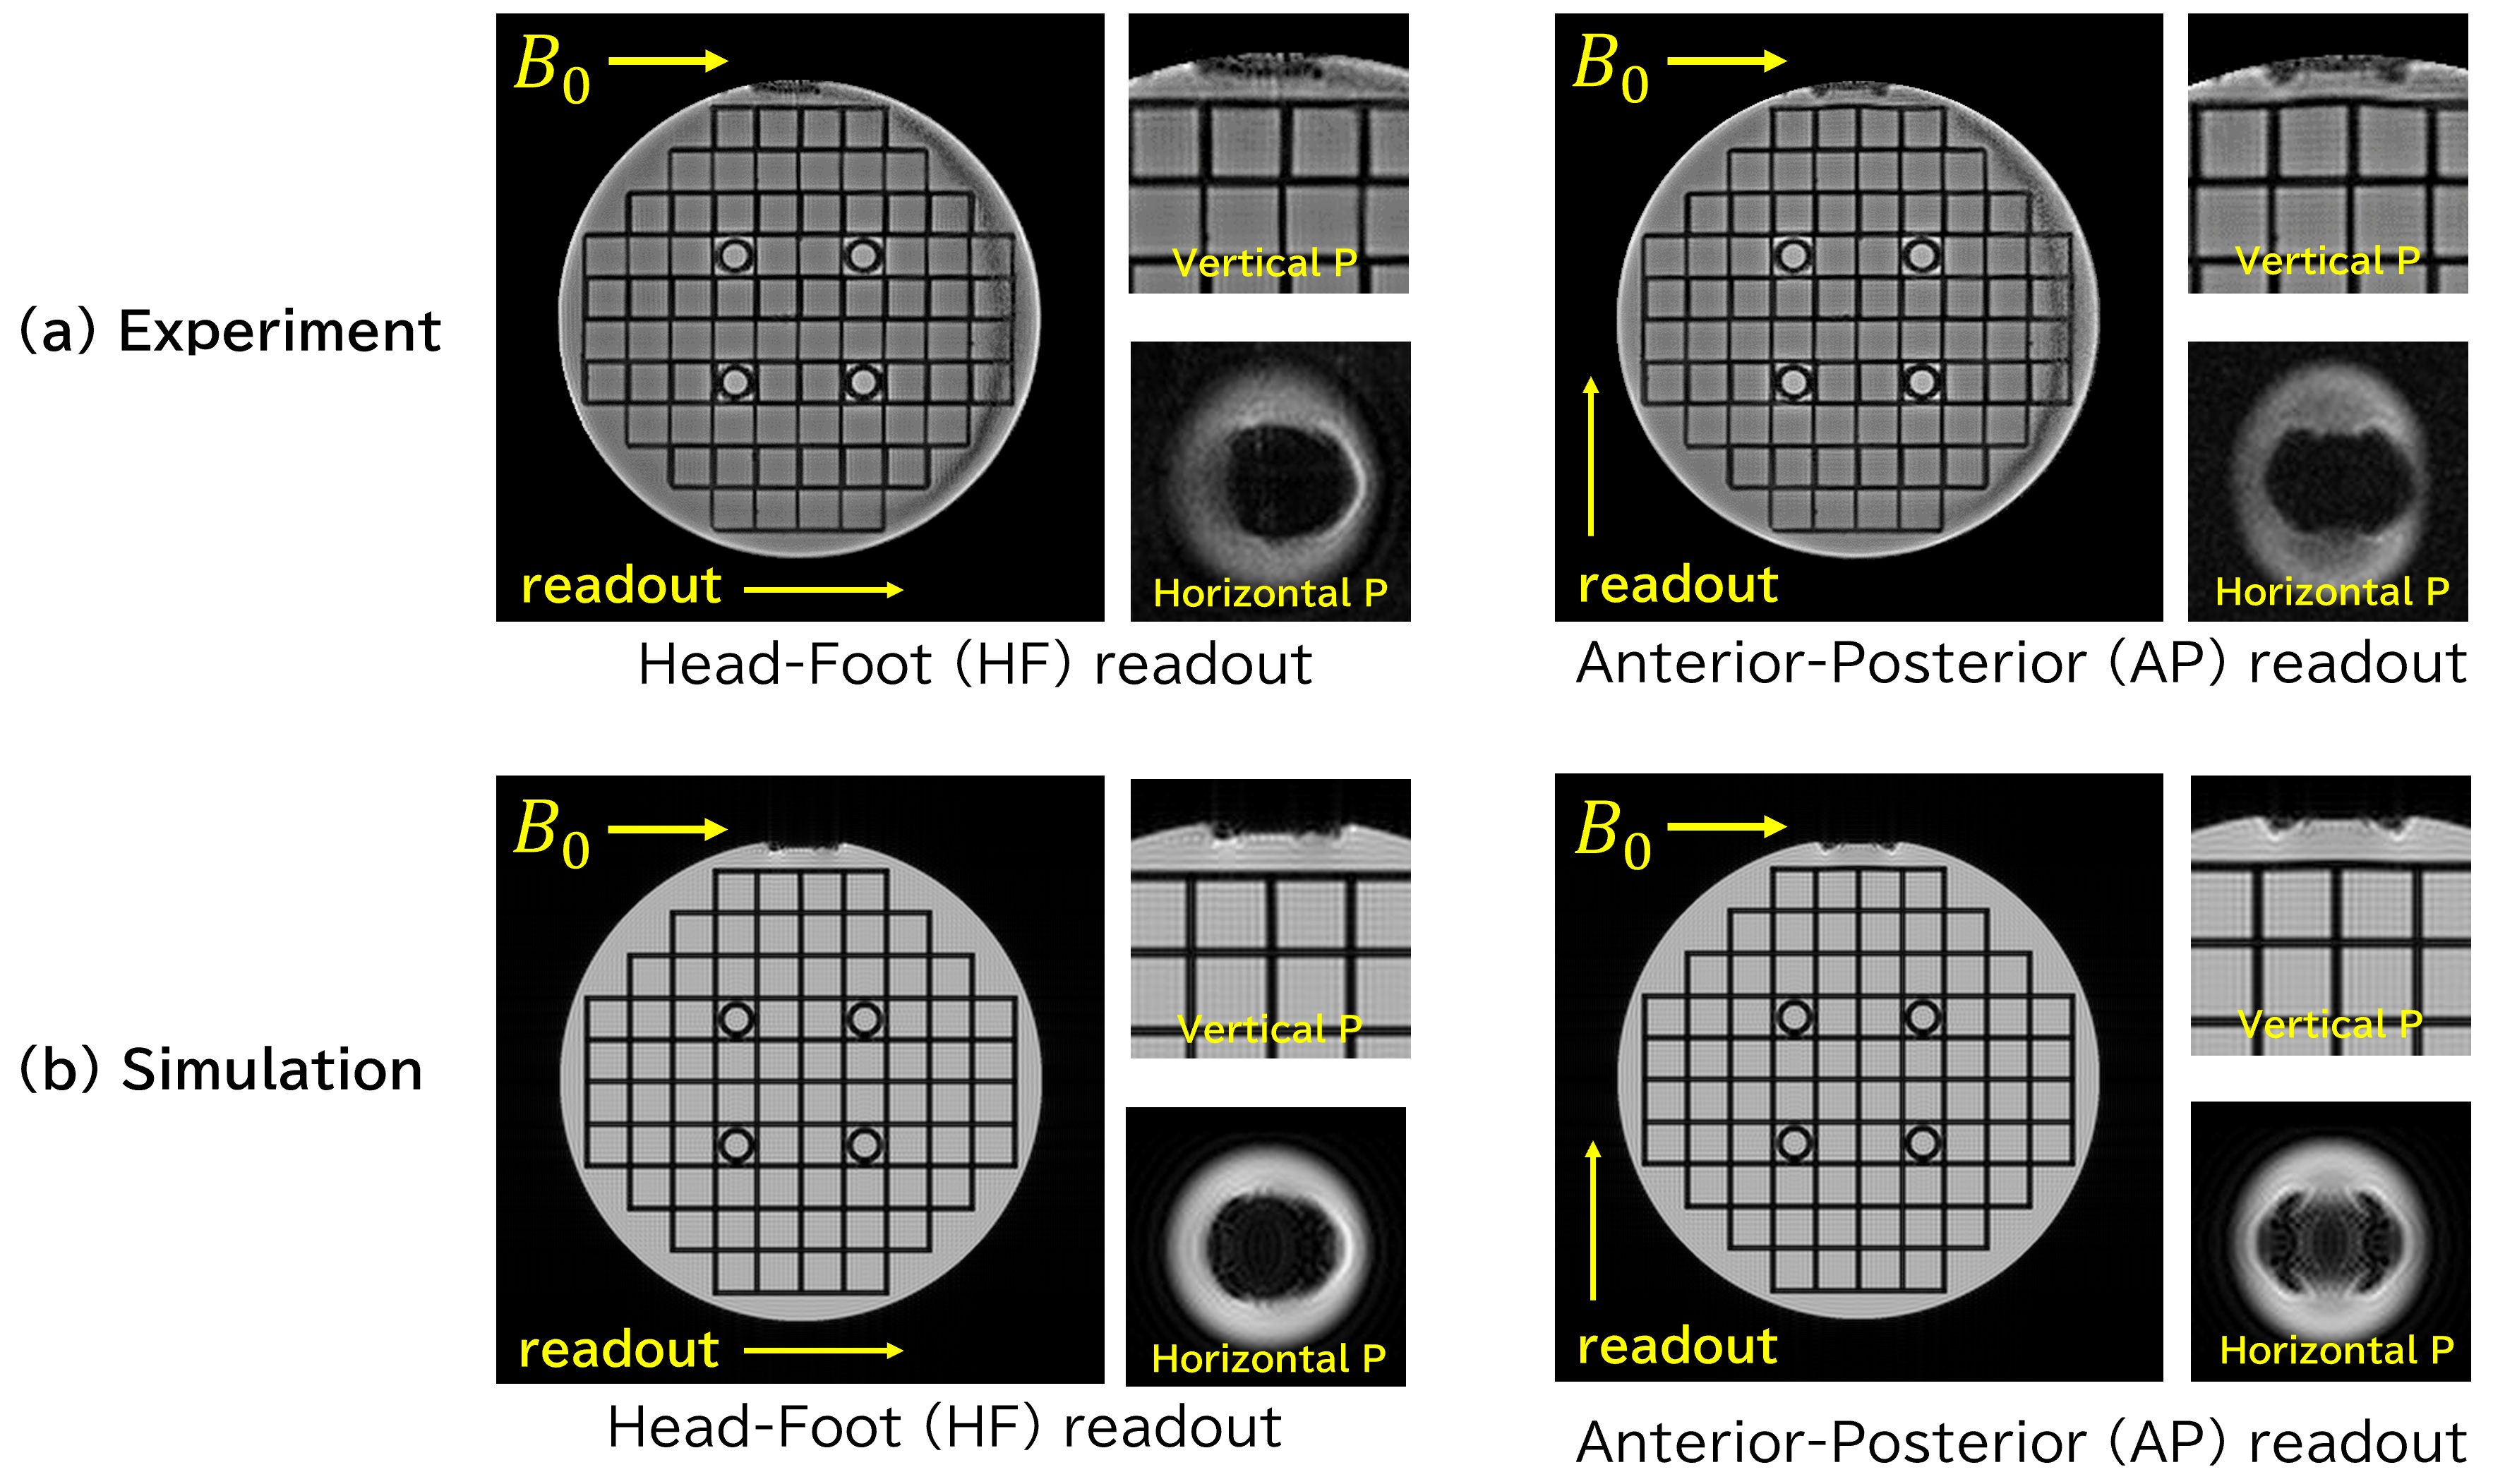
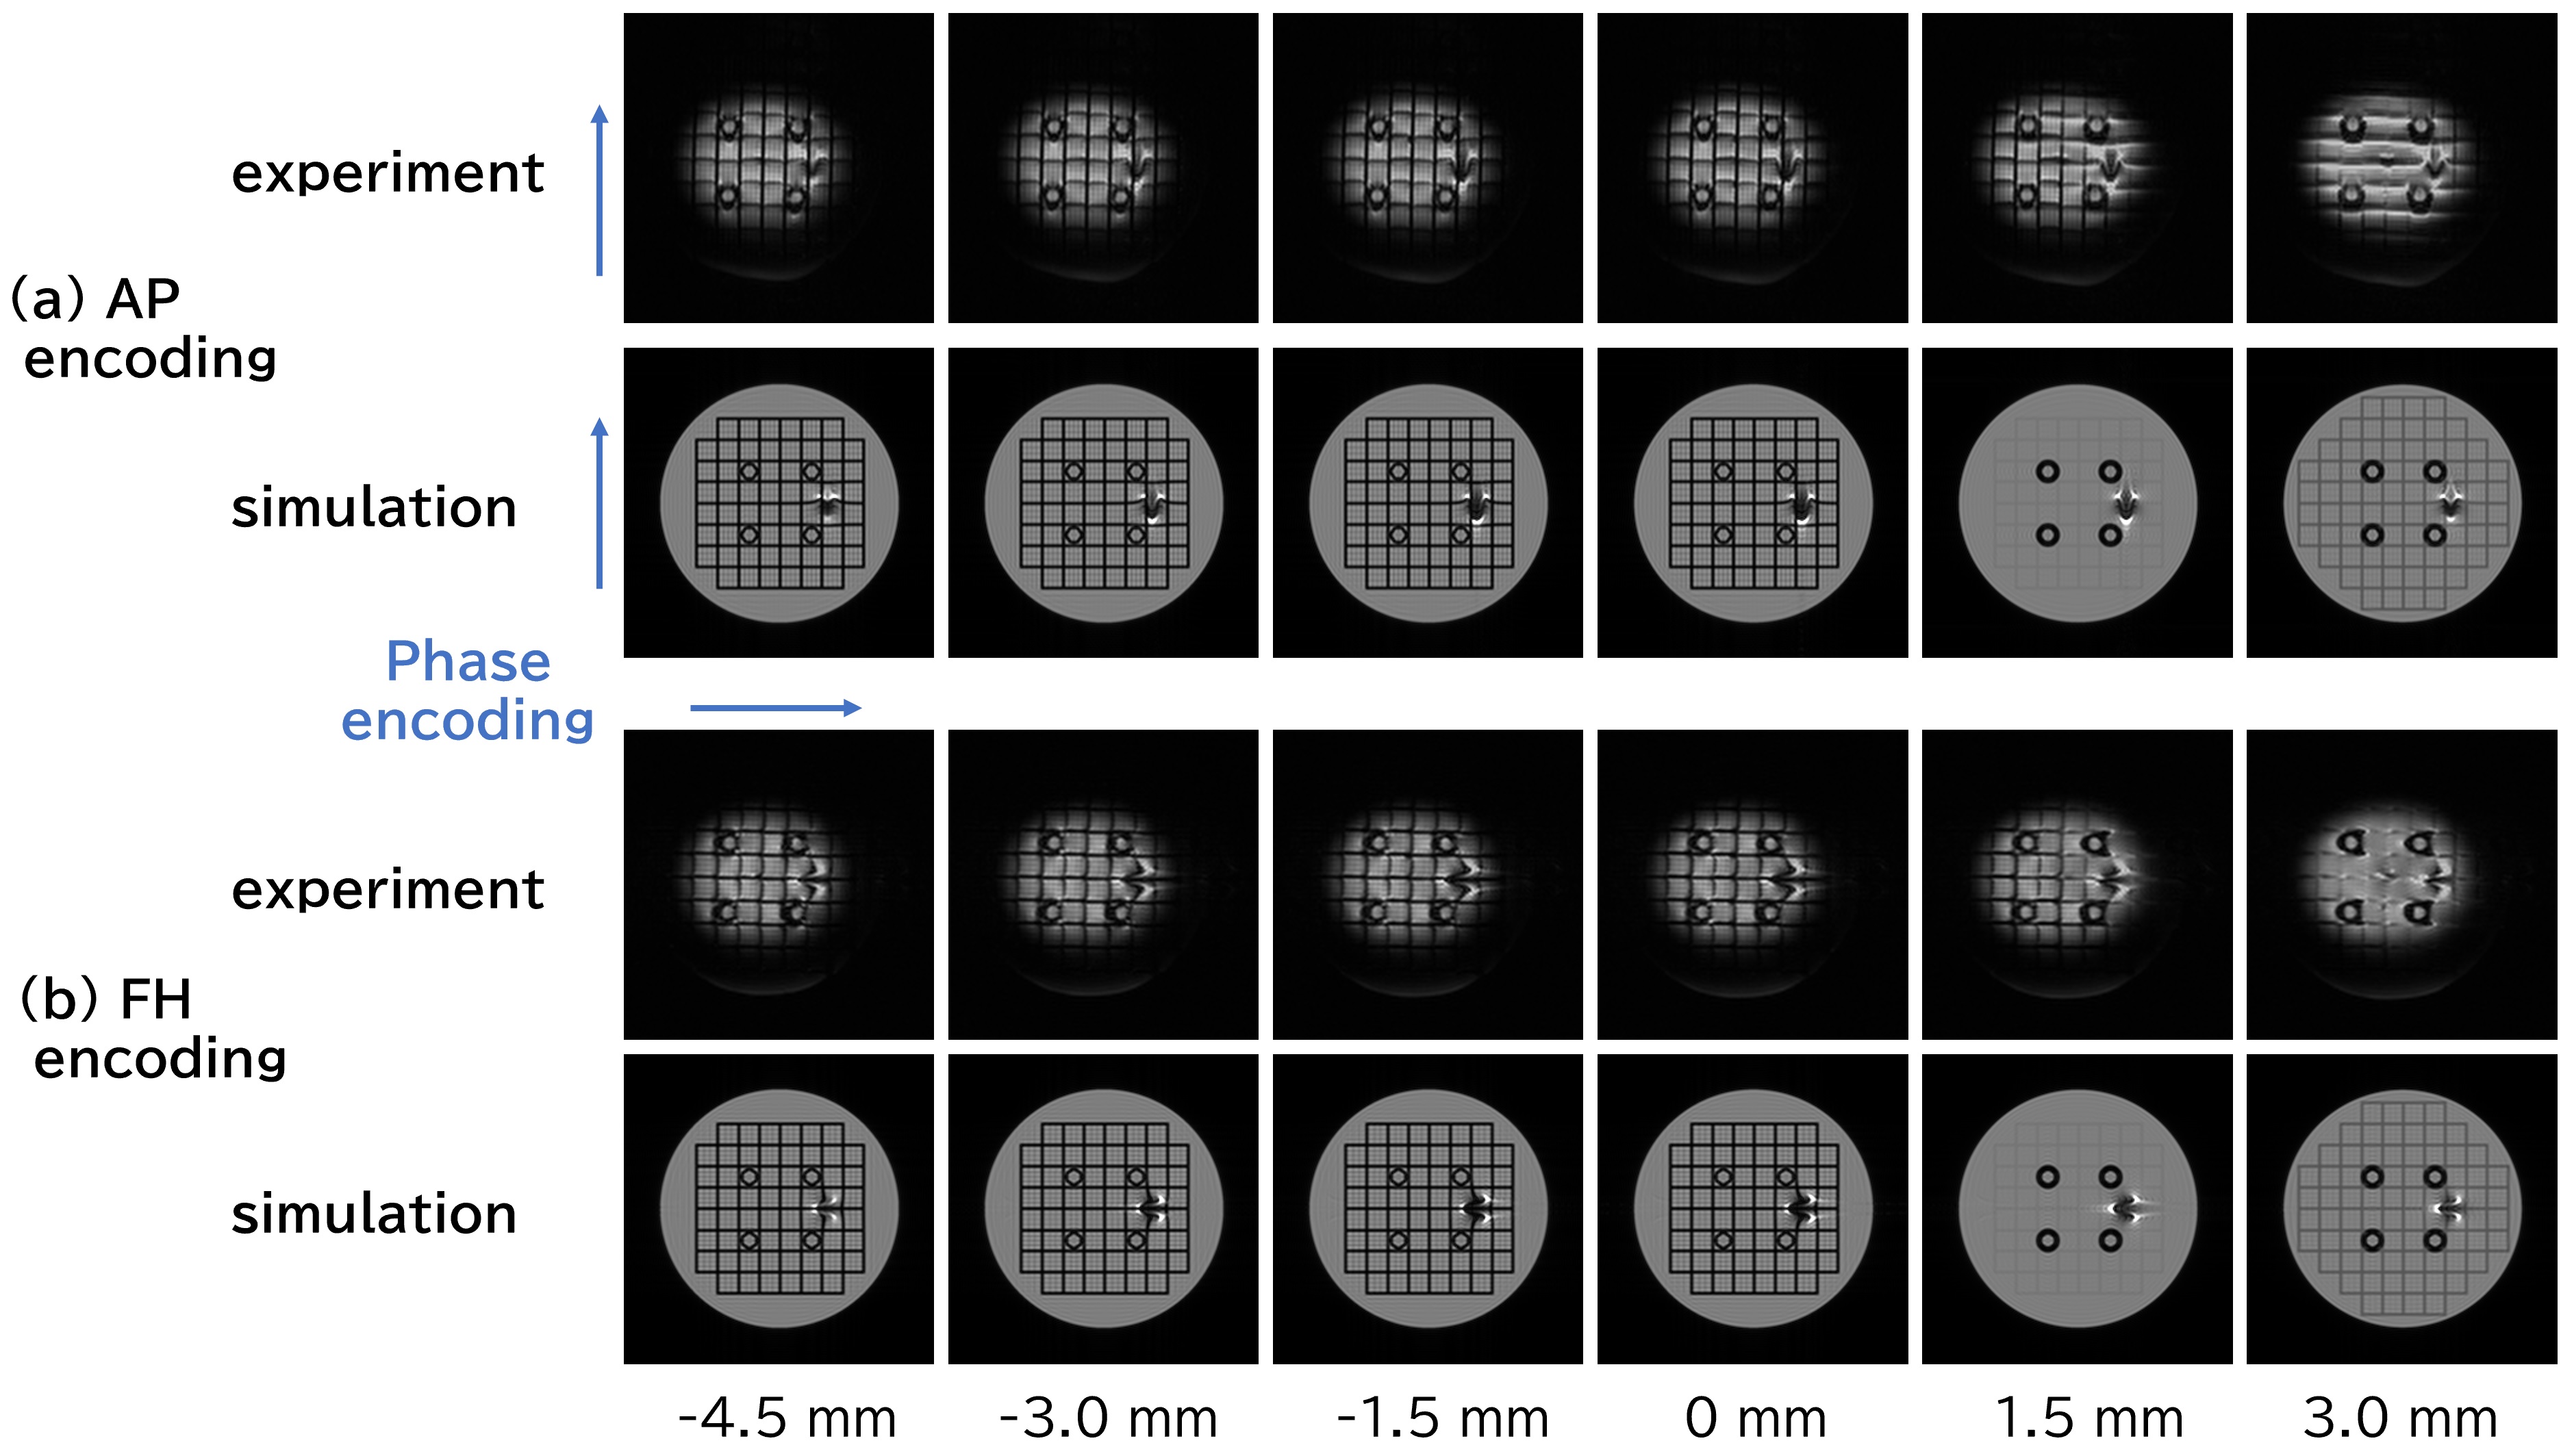
Figures 1 and 2 show the inhomogeneous magnetic fields due to the bubbles. The optimum size for the inner bubble was 6 mm (major axis) × 1.6 mm (minor axis). Figure 3 shows the MPRAGE images of the upper bubbles acquired with the experiment and the Bloch simulation. Figure 4 shows the EPI images acquired with the experiment and simulation of the inner bubble. In EPI, the RF field near the surface of the sphere did not satisfy the spin echo condition, so only the area near the center of the sphere was visualized. Figure 5 shows enlarged EPI images of the inner bubble and the shape of the bubble derived from the EPI images.Discussion
The Bloch simulation reproduced the image distortion around the bubbles almost correctly. The shape of the inner bubble was quite far from spherical. This may be due to the attractive force between the surface magnetic poles generated on the surface of the bubble. However, the calculation of the surface energy and the magnetic energy of the bubble is required to determine whether this is mechanically possible or optimal. This phenomenon may be due to the similar causes as the Moses effect9,10.Conclusion
Geometric distortion around air bubbles in the MR images acquired with a 7T MRI system was correctly reproduced by the Bloch simulation. The Bloch simulation clarified that the inner bubble was deformed from a spherical shape, suggesting that it was due to the strong magnetic field.Acknowledgements
No acknowledgement found.References
1. Lüdeke KM, Röschmann P, Tischler R. Susceptibility artefacts in NMR imaging. Magn Reson Imaging. 1985; 3:329-43.
2. Bakker CJ, Bhagwandien R, Moerland MA, Fuderer M. Susceptibility artifacts in 2DFT spin-echo and gradient-echo imaging: the cylinder model revisited. Magn Reson Imaging. 1993;11(4):539-48.
3. Kose R, Kose K. BlochSolver: A GPU-optimized fast 3D MRI simulator for experimentally compatible pulse sequences. J Magn Reson 2017; 281:51-65.
4. Yoder D A, Zhao Y S, Paschal C B and Fitzpatrick JM. MRI simulator with object-specific field map calculations. Magn Reson Imaging 2004; 22:315–28.
5. Benoit-Cattina H, Collewet G, Belaroussi B, Saint-Jalmes H, Odet C. The SIMRI project: a versatile and interactive MRI simulator. J Magn Reson 2005; 173:97–115.
6. Jochimsen TH, Schäfer A, Bammer R, Moseley ME. Efficient simulation of magnetic resonance imaging with Bloch-Torrey equations using intra-voxel magnetization gradients. J Magn Reson. 2006; 180:29-38.
7. De Guio F, Benoit-Cattin H, Davenel A. Signal decay due to susceptibility-induced intravoxel dephasing on multiple air-filled cylinders: MRI simulations and experiments. MAGMA. 2008; 21:261-71.
8. Latta P, Gruwel ML, Jellús V, Tomanek B. Bloch simulations with intra-voxel spin dephasing. J Magn Reson. 2010; 203:44-51.
9. Sugawara H, Hirota N, Homma T, Ohta M and Kitazawa K. Magnetic field effect on interface profile between immiscible nonmagnetic liquids – enhanced Moses effect. Journal of Applied Physics 1996; 79: 4721–4723.
10. Kitazawa K, Ikezoe Y, Uetake H and Hirota N. Magnetic field effects on water, air and powders. Physica B 2001; 294–295: 709–714.
Figures