4661
MR Sequence Design in the Low Stochastic Regime - Development of a Low-SAR “T2-Weighted” Scan1GE Healthcare, London, United Kingdom, 2Department of Radiology, Oxford University Hospitals, Oxford Centre for Clinical Magnetic Resonance Research, Oxford, United Kingdom, 3GE Healthcare, Waukesha, WI, United States, 4Department of Physiology, Anatomy, and genetics, University of Oxford, Oxford Centre for Clinical Magnetic Resonance Research, Oxford, United Kingdom
Synopsis
Keywords: Acquisition Methods, High-Field MRI
Motivation: The introduction of Machine Learning-based Image Reconstruction ("Deep Learning") offers a fresh opportunity to explore MR parameter space without the restrictive requirement to maximise MR signal.
Goal(s): Demonstrate an application of the Low Stochastic Regime approach using low flip angle refocusing with good SNR and strong tissue contrast.
Approach: Fast Spin Echo (FSE) images were acquired using reduced flip angle refocusing and extended echo train lengths, in combination with Deep Learning-Reconstruction (“DL-Recon”).
Results: Using DL-Recon to effectively weaken the conventional constraint of maximising MR signal, the redesigned sequence produced images with lower RF power deposition but similar contrast to the product CPMG sequence.
Impact: Clinical applications where T2-weighted imaging is SAR-limited.
Introduction
The Machine Learning-based "Deep-Learning Recon" technique radically reduces noise observed in the reconstructed MR image1. In order to optimise SNR, MR sequence design traditionally maximises the generated MR signal. Sometimes the requirements to maximise Contrast-to-Noise Ratio and Signal-to-Noise-Ratio conflict. Working in the "Low Stochastic Regime", where achieving optimum SNR is no longer the primary consideration, this approach provides new opportunities to the MR sequence designer for exploring MR parameter space, by creating MR sequences which have important and useful characteristics which would otherwise be excluded by the maximum SNR constraint.To demonstrate this principle, we designed and implemented an MR sequence which produces images with good tissue contrast and SNR, but has a significantly lower RF power deposition (SAR). A Fast Spin Echo sequence with refocussing pulses reduced from the near-CMPG default (142) to a lower value (50) was tested. Lower refocussing flip angles reduce T2-weighting and increase T1 effects in the MR signal2,3. T2-weighting can then be re-introduced by increasing echo time4. Some T1-weighting will also be introduced - a common practice with 3-Dimensional FSE scans4.
Busse3 described an FSE sequence for reduced SAR and good T2-weighting, but had to compromise the sequence parameters to ensure good SNR. With DL-Recon, we could choose a refocussing flip angle scheme which is sub-optimal for SNR when using conventional image reconstruction schemes, but has lower SAR when the whole echo-train is considered.
Methods
We acquired 3-T (GE Premier, 21-channel Head and Neck coil) Fast Spin Echo images from a EuroSpin phantom5 with the following parameters: matrix=256x256, FOV=24cm, slice thickness=5mm, TR=4000ms, TE=100ms, excitation flip angle=90 degrees . Product SAR and echo-train optimisation schemes were turned off. The number of slices was limited to ensure only one acquisition was needed to obtain full slice coverage for the scan with the highest SAR. Where necessary, Echo Train Length (ETL) was increased to obtain longer echo times. The AutoPreScan routine was used to set Transmit and Receiver Gains for the first standard scan and held constant for subsequent scans. A phase-correction reference calibration was used for each scan.Figure 1 shows the FSE variants acquired in the phantom.
Similar scans were performed in a healthy volunteer with shorter echo times for the reduced flip angle scans (see figure 3 captions). Images were reconstructed with and without the vendor DL-Recon routine, loaded into ITK-SNAP6, and auto-scaled to display contrast.
ROI measurements were made in the phantom for two tubes (red outline) with a range of relaxation times representative of the brain7, and in regions of white and grey matter in the volunteer scans.
For each sequence in the volunteer scan, the 10-second average SAR was recorded. This is a real-time measure of reflected RF power by the scanner’s directional coupler.
Results
Figure 2 shows images for each scan on the EuroSpin gel phantom matrix.The standard FSE scan showed strong contrast between the different gels.
The scan with reduced flip angles and similar TE as the standard scan showed much less contrast between the gels.
The scan with ETL=24, TE=150ms and the scan with ETL=32, TE=200ms both showed contrast comparable to the standard T2-weighted scan.
Volunteer scans generated by DL-Recon were observed to have high SNR. Contrast in the images for the DL-Recon reduced refocus-flip angle scans with ETL=24, TE=132ms and ETL=32, TE=177ms were visually similar to the standard scan with near-CPMG flip angles and TE=100ms (Figure 3).
In the human volunteer, the SAR levels for the standard and reduced refocusing flip angle scans were 0.9 +/-0.1 and 0.3 +/-0.1 W/kg, respectively.
Figure 4 shows the calculated ratios for the phantom and volunteer scans.
Discussion
We exploited the high SNR afforded by DL-Recon to explore alternative approaches to MR sequence design in the "Low Stochastic Regime", where sequence parameter choice is less constrained by SNR. In this way, many new sequence designs could be investigated. With this new approach, we developed an alternative “T2-weighted” sequence with reduced refocussing flip angles with good SNR preserved by DL-Recon and reduced SAR. This contrast has increased T1-weighting2,8 and is observed in 3D-FSE scans4.There is a trade-off to consider when reducing the refocussing flip angles: at low flip angles, SAR may be minimised, but T2-weighting is also reduced, necessitating a longer echo-train, which could increase image blurring.
Characterising the noise distribution of DL-Recon images is beyond the scope of this work; we note that the errors we give in the results of ratio measures were computed by conventional means (square root of sum of square of relative errors), assuming a normal noise distribution.
Acknowledgements
We thank Thierry Guiheneuf and Liz Tunnicliffe for helpful discussions.References
1 S Kiryu, H Akai, K Yasaka, T Tajima, A Kunimatsu, N Yoshioka, M Akahane, O Abe, K Ohtomo. Clinical Impact of Deep Learning Reconstruction in MRI. RadioGraphics Vol. 43, No. 6
2 Hennig J. Multiecho imaging sequences with low refocusing flip angles. J Magn Reson 1988;78:397– 407.
3 RF Busse. Reduced RF Power Without Blurring: Correcting for Modulation of Refocusing Flip Angle in FSE Sequences. Magnetic Resonance in Medicine 51:1031–1037 (2004)
4 RF Busse, H Hariharan, A Vu, and JH Brittain. Fast Spin Echo Sequences With Very Long Echo Trains: Design of Variable Refocusing Flip Angle Schedules and Generation of Clinical T2 Contrast. Magnetic Resonance in Medicine 55:1030 –1037 (2006).
5 Leedstestobjects.com
6 Paul A. Yushkevich, Joseph Piven, Heather Cody Hazlett, Rachel Gimpel Smith, Sean Ho, James C. Gee, and Guido Gerig. User-guided 3D active contour segmentation of anatomical structures: Significantly improved efficiency and reliability. Neuroimage. 2006 Jul 1; 31(3):1116-28.
7 WD Rooney, G Johnson, X Li, ER Cohen, S-G Kim, K Ugurbil, and CS Springer, Jr. Magnetic Field and Tissue Dependencies of Human Brain Longitudinal H2O Relaxation in Vivo. Magnetic Resonance in Medicine 57:308 –318 (2007)
8 Alsop DC. The sensitivity of low flip angle RARE imaging. Magn Reson Med 1997;37:176 –184.
Figures
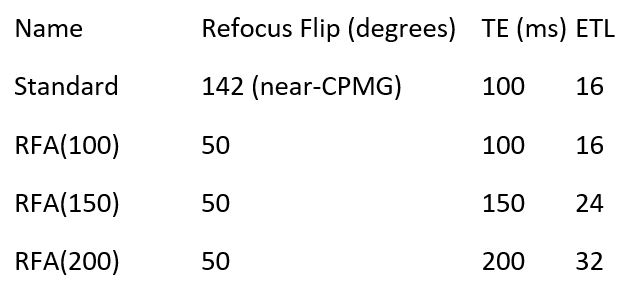
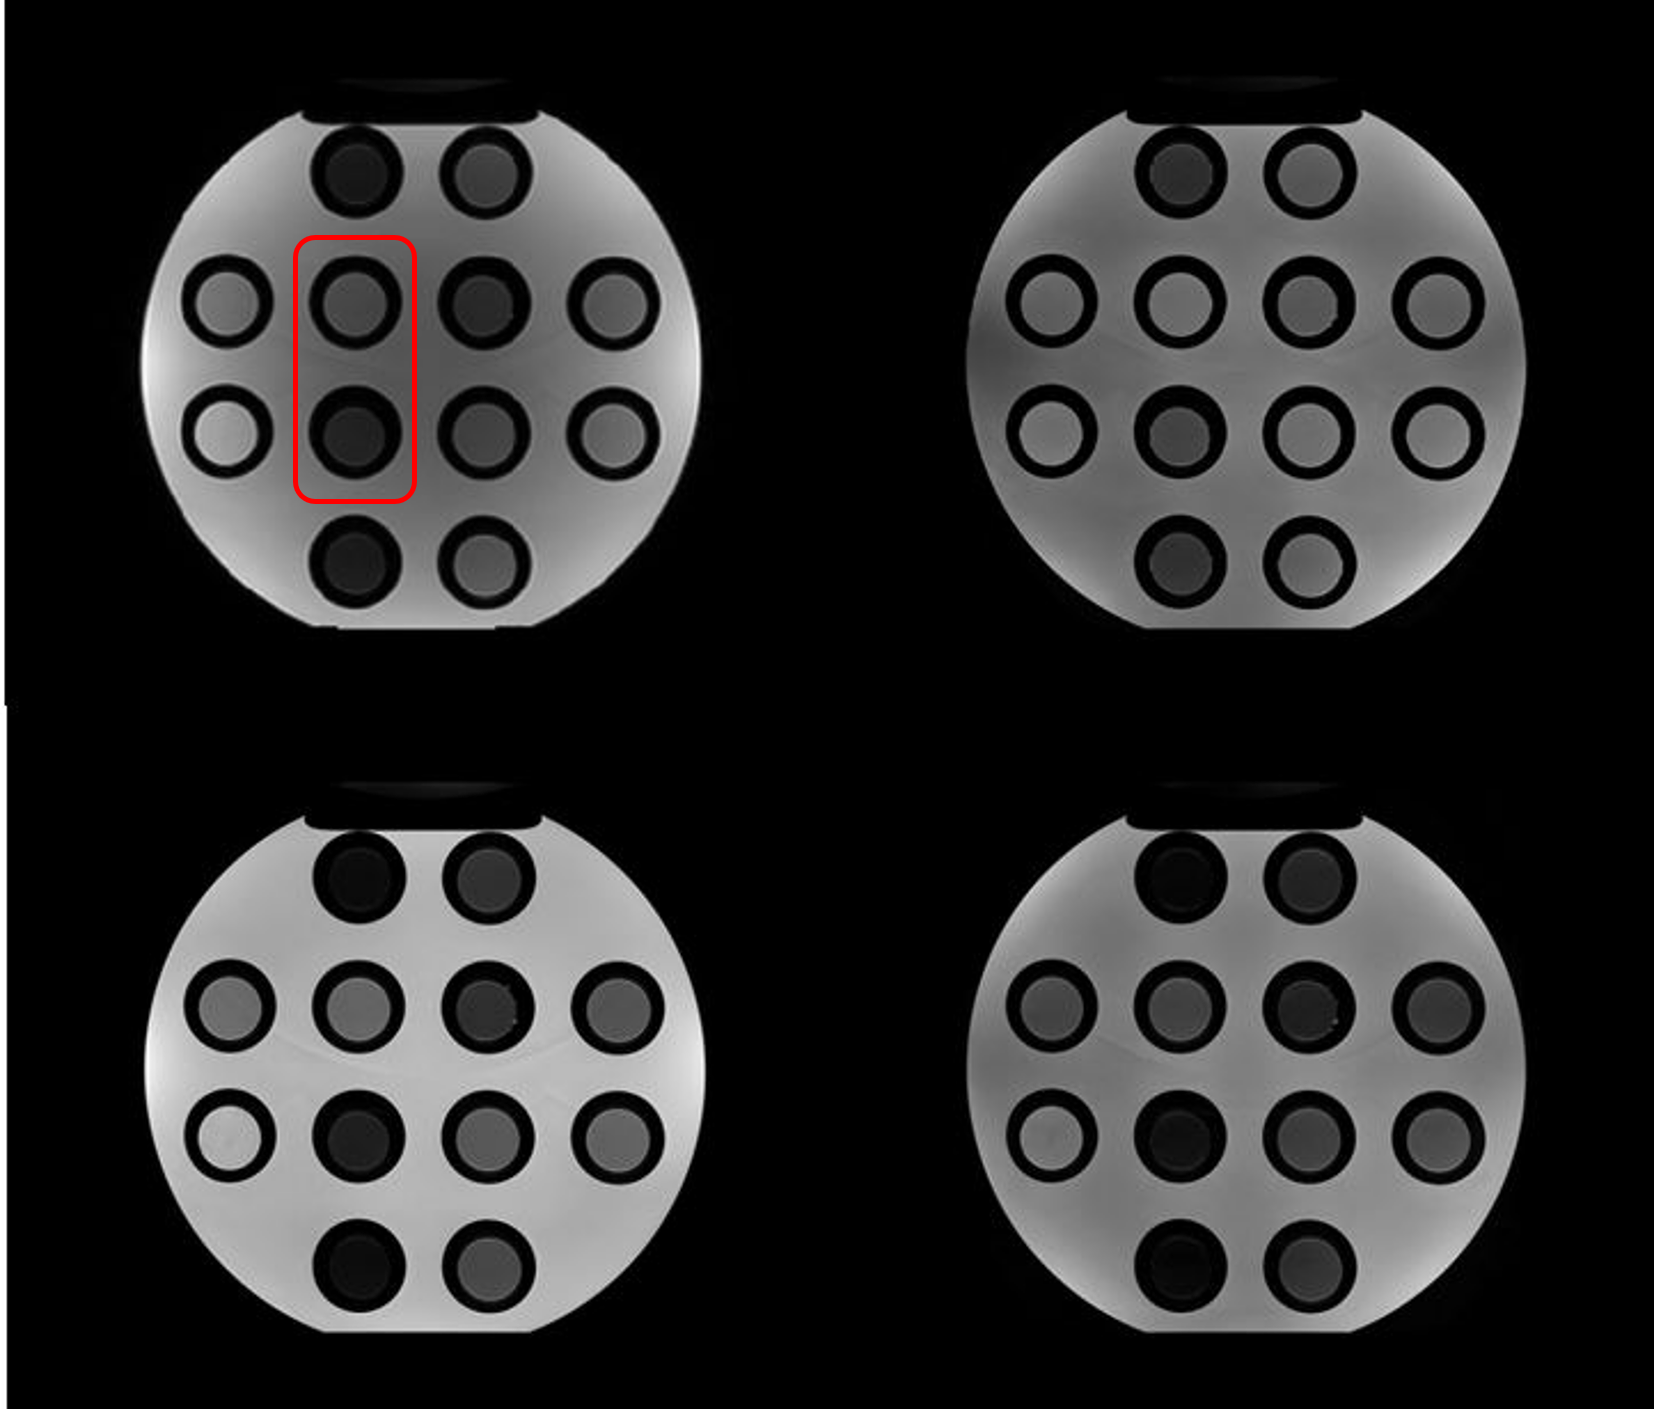
Figure 2 - Gel phantom matrix.
Top left - standard FSE TE 100ms.
Top right - reduced flip FSE, TE 100ms
Bottom left - reduced flip FSE, ETL 24, TE 150ms
Bottom right - reduced flip FSE, ETL 32, TE 200ms
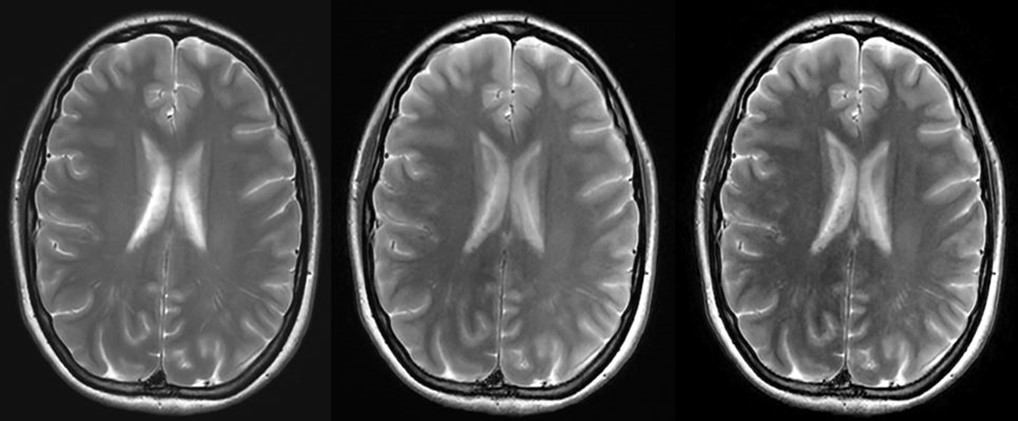
Figure 3 - Human volunteer images.
Left - standard FSE TE 100ms
Middle - reduced flip FSE, ETL 24, TE 132ms
Right - reduced flip FSE, ETL 32, TE 177ms
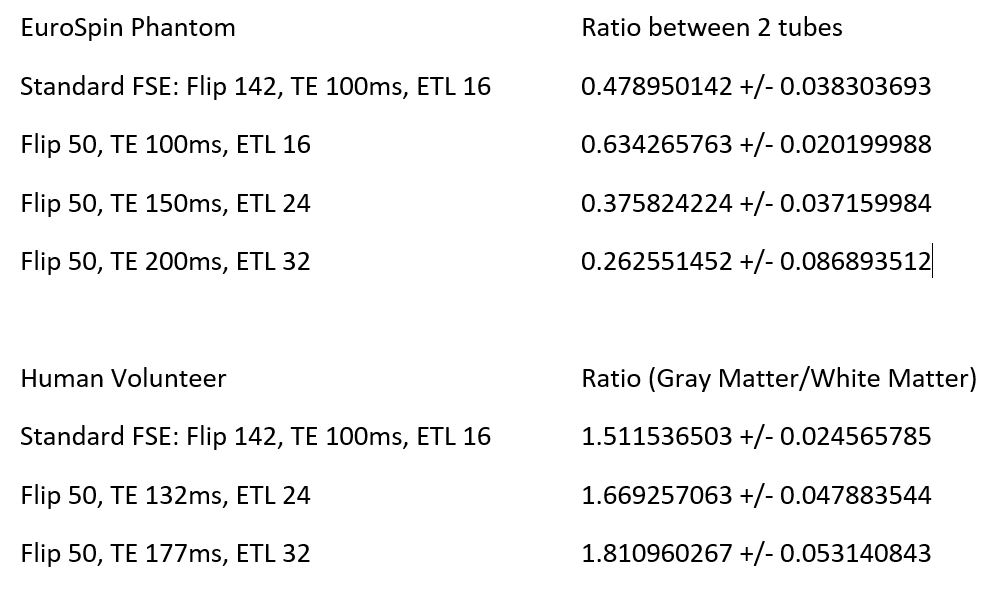
Figure 4 - Measured contrast ratios.
Top - contrast ratios for phantom
Bottom - grey/white matter ratios for human volunteer