4652
Evaluating Pilot Tone Navigator and BioMatrix Sensor for Motion Assessment using Sliding-Window MR Fingerprinting1Biomedical Engineering, Case Western Reserve University, Cleveland, OH, United States, 2Siemens Medical Solution, USA, St. Louis, MO, United States, 3Radiology, Case Western Reserve University, Cleveland, OH, United States
Synopsis
Keywords: Motion Correction, Motion Correction
Motivation: Respiratory monitoring is critical for robust free-breathing MRI and various methods have been developed.
Goal(s): To leverage sliding-window MRF to evaluate the accuracy of respiratory motion assessment obtained from the Pilot Tone (PT) navigator and BioMatrix Sensor and apply to free-breathing abdominal MRF.
Approach: Sliding-window MRF was used to measure respiratory motion with a temporal resolution of 0.5 sec to compare with the respiratory motions acquired using PT navigator and BioMatrix Sensor during in vivo scans.
Results: PT navigator presents slight improvement in monitoring respiratory motion, but MRF maps reconstructed based on the motion waveforms from all these approaches are consistent in quality.
Impact: The knowledge obtained in this study will help design free-breathing abdominal imaging in general and provide critical information in performing quantitative abdominal MRI using MRF.
Introduction
The Pilot Tone (PT) navigator is a relatively new motion monitoring method developed for cardiac and abdominal MR imaging (1). PT transmits a constant radiofrequency signal into the scanner environment to encode physiological motion. Previously we have shown that PT navigators enable free-breathing abdominal MR Fingerprinting (MRF) for both 2D and 3D acquisitions (2). Additionally, respiratory signals can also be extracted directly from the BioMatrix Sensors embedded in the scanner table. The accuracy of respiratory motion measurement between these two approaches has not been extensively evaluated. In this pilot study, we aim to 1) assess the measurement accuracy of the two methods using the body motion waveforms extracted from the sliding-window MRF (SW-MRF) reconstruction; and 2) evaluate their utility towards free-breathing abdominal MRF.Methods
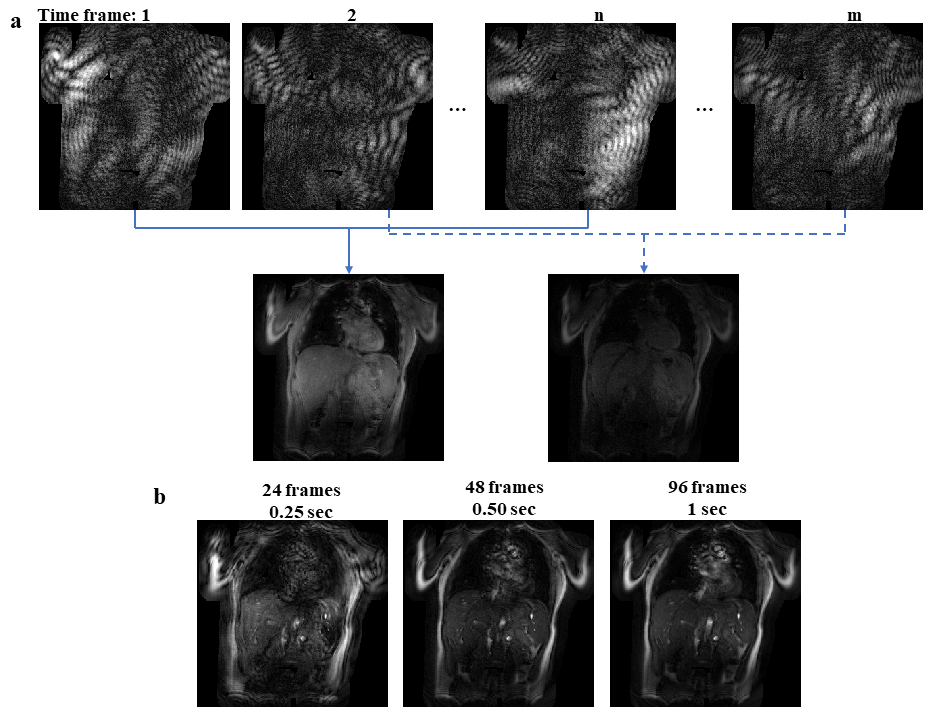
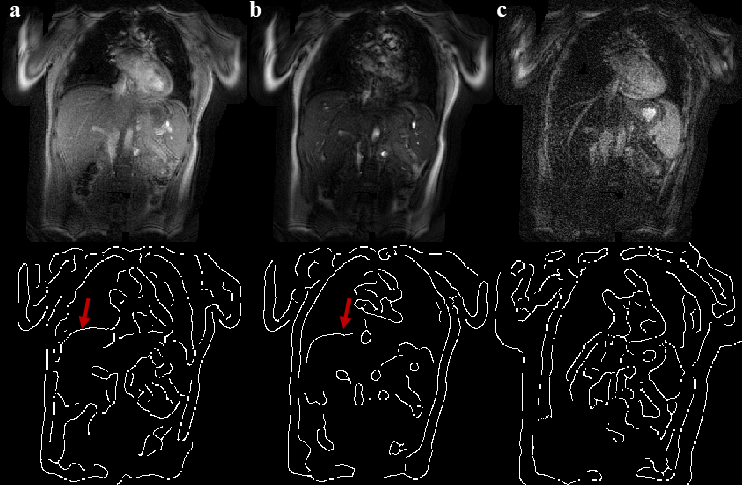
MRI experiments were performed with one normal volunteer on a 3T Siemens scanner (MAGNETOM Vida, Siemens Healthineers, Erlangen, Germany). The subject was instructed to perform normal breathing during the scanning. 2D MRF acquisitions based on the FISP readout were acquired with both the integrated Beat Sensor PT signals and BioMatrix Sensor respiratory signals (Siemens Healthineers) collected simultaneously with the scanner (3-4). The MRF acquisition parameters included: FOV, 45×45 cm2; matrix, 288×288; slice thickness, 5 mm; FA, 1-60°; TR, 10.5 ms. Highly-undersampled spiral readout was applied (R=48) and a total of 1728 MRF time points were acquired in one repetition of 18 sec. A total of 10 repetitions were acquired with 2 sec waiting time between the repetitions. NUFFT of the MRF data for each time frame was first performed offline in MATLAB (version R2023a; Mathworks, Natick, MA). Sliding-window reconstruction (5) using three different numbers of time frames (24, 48, and 96) was then performed to determine an optimal number of time frames to be combined for motion estimation. Based on the yielded image quality and effective temporal resolution (Fig 1), we selected 48 time frames for analysis corresponding to 0.5 sec temporal resolution. Based on the sliding-window reconstructed images, automatic edge detection around the liver dome was performed to measure the respiratory motion (Fig 2). A low-pass filter was first applied to eliminate unwanted noise followed by edge detection with a built-in MATLAB function by looking for local maxima of the gradient of the image (MATLAB R2023a). Due to the low flip angles applied in the MRF acquisition, a small number of SW-MRF images (~5%) do not present sufficient quality for robust liver edge detection. Working off the assumption that very minor respiratory motions are expected to occur in a few TRs (less than 0.1 sec), interpolation using estimated values from neighboring time frames was applied to estimate the respiratory motion in these cases. Respiratory motion from the BioMatrix Sensor was output from the scanner during the measurement. The PT data was processed with the vendor provided custom processing pipeline. PT data embedded in the raw data was first extracted followed by DC component and RF interference removal, respiratory waveform extraction, and low-pass filtering. To evaluate the accuracy of motion monitoring for the PT navigator and BioMatrix Sensor, correlation coefficients were calculated for each repetition using the results from the SW-MRF as the gold-standard. In addition, the utility of these motion waveforms in selecting and binning time frames for free-breathing MRF was also evaluated. MRF T1 and T2 maps at end-inhalation were obtained using 1/3 of data as described in (2).Results
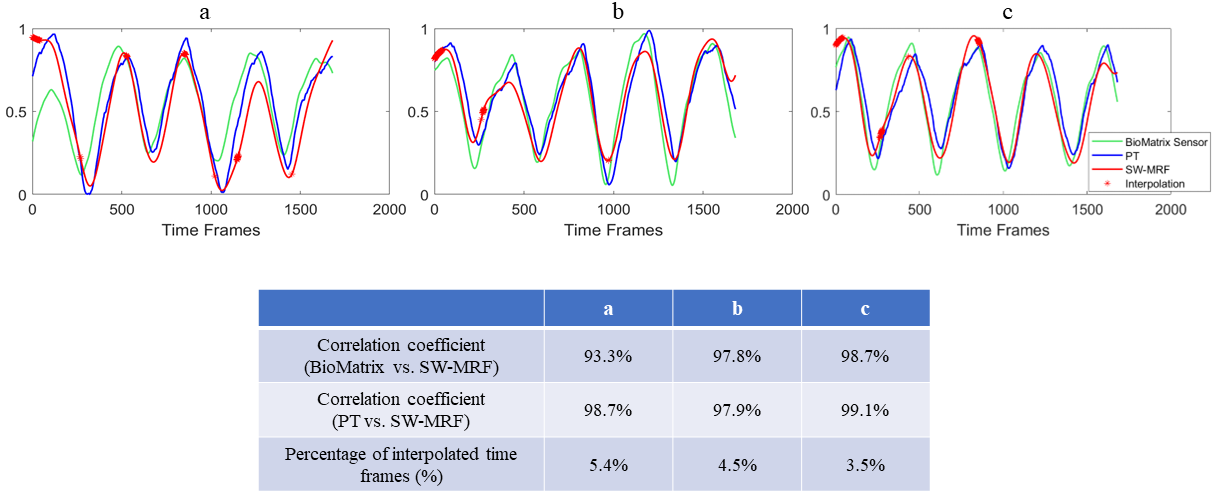
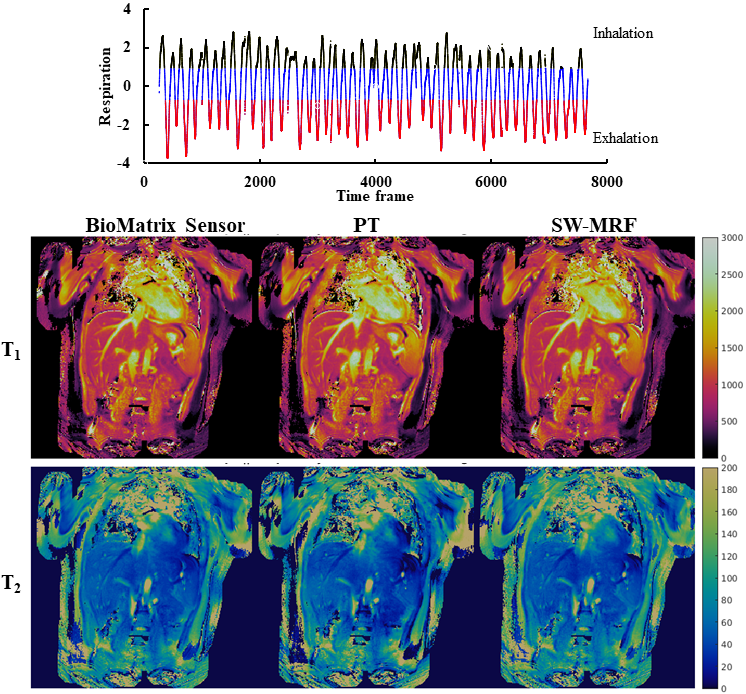
Fig 3 shows representative correlation curves for three repetitions out of a total of 10 repetitions. The mean correlation coefficient between PT and SW-MRF was 0.984±0.005, slightly better than the value obtained between the BioMatrix Sensor and SW-MRF (0.978±0.017; P>0.05). However, the PT navigator yielded lower standard deviation, indicating higher robustness across the measurements. Fig 4 shows the reconstructed MRF T1 and T2 maps based on the three different motion extraction schemes, with minimal visual differences in all extracted quantitative tissue property maps.Discussion and Conclusion
In this study, we compared the measurement accuracy of PT navigators and BioMatrix Sensor for respiratory motion monitoring. With the results from SW-MRF as the ground truth, PT navigators exhibit slight improvement in both accuracy and robustness in motion estimation. However, no significant difference was noticed in the MRF maps derived from these two respiratory measurement methods. This is partly due to improved motion tolerance of the MRF technique as compared to conventional MR imaging methods (2). While this study examined the condition with regular respiratory patterns, future work will be conducted on irregular motion patterns to fully examine these approaches.Acknowledgements
Siemens Healthineers and NIH grants 1R01 CA266702, and 1R01 CA282516.References
- Falcao M, et al. MRM, 2022; 718-732.
- Huang S, et al. JMRI, 2021; 1138-1151.
- Ma D, et al. Nature, 2013; 187–192.
- Jiang Y, et al. MRM, 2015; 1621-1631.
- Cao X, et al. MRM, 2017; 1579-1588.
Figures