4642
Real-time Respiratory Correction of the Pilot Tone Cardiac Signal to Stabilize Triggering during Breath-holds1Department of Biomedical Engineering, The Ohio State University, Columbus, OH, United States, 2Siemens Healthineers AG, Erlangen, Germany, 3Davis Heart and Lung Research Institute, The Ohio State University Wexner Medical Center, Columbus, OH, United States, 4Department of Electrical and Computer Engineering, The Ohio State University, Columbus, OH, United States, 5Division of Internal Medicine, The Ohio State University Wexner Medical Center, Columbus, OH, United States
Synopsis
Keywords: Motion Correction, Cardiovascular, Pilot Tone, Cardiac Trigger
Motivation: This research aims to refine Pilot Tone (PT) cardiac triggering, which can be impacted by changes in signal amplitude caused by breath-holding.
Goal(s): Its primary goal is to develop and validate a real-time correction algorithm that improves the PT cardiac trigger stability during breath-holds without introducing additional variability during free breathing.
Approach: The algorithm analyzes PT data for respiratory patterns to adapt beat-by-beat amplitude correction of the cardiac signal. The methodology was tested with different breathing paradigms at 1.5T and 3T to assess robustness.
Results: The correction successfully adjusted PT cardiac signal amplitude, reducing missed triggers across respiratory patterns without increasing triggering variation.
Impact: The described real-time correction improves the reliability of cardiac PT triggers during inspiratory breath-hold maneuvers, increasing the opportunities to replace ECG triggering with PT triggering, and therefore to eliminate the need for ECG leads.
Introduction
In cardiovascular MR imaging, the Pilot Tone (PT) signal can be used for prospective cardiac synchronization [1, 2], eliminating the need for ECG leads. PT cardiac-triggered images have been shown to be comparable to ECG triggered images; however, the PT cardiac signal can be affected by changes in breathing pattern, reducing triggering stability especially during breath-holds in some patients. A correction algorithm was developed to adjust the PT cardiac signal amplitude in real-time to maintain consistent threshold-based triggering.Methods
PT and ECG data were collected from 19 volunteers (age 63.9 ± 13.2, 7 females) using three scanners at 1.5T and 3T (MAGNETOM Vida, MAGNETOM Lumina, MAGNETOM Sola, Siemens Healthineers AG, Erlangen, Germany). Data sets of 200s were acquired under three respiratory paradigms: free breathing (FB), breath-hold at end-exhalation (BH-Ex), and inhalation (BH-In). During BH acquisitions, volunteers were instructed to perform three breath-holds, each at least 15s long. Cardiac and respiratory signals were extracted using a previously proposed method [3]. A constant velocity Kalman filter was used to calculate a stable first derivative of the respiratory signal. The respiratory activity was determined as the magnitude of the extremum between neighboring zero-crossings. A slowly varying threshold was formed by low pass filtering the respiratory activity (exponential smoothing factor 0.3) and was updated during FB only. BH and DB periods were identified with a maximum delay of one-half respiratory cycle by comparing the activity to the threshold: activities lower than 0.2 (or 0.4 if preceding half cycle was detected as BH or DB) times the threshold are marked as BH; activities five times the standard deviation (determined using 20s of calibration data during FB) above the threshold are marked as DB. PT cardiac (PTC) signal amplitude was determined as the maximum value in a cardiac cycle. During calibration, the PT cardiac signal amplitude was normalized. The cardiac signal was corrected with a factor that was updated differently based on the respiratory period type: During FB, the correction factor was calculated using the low pass filtered amplitude (exponential smoothing factor 0.3). During BH, the correction factor was determined using the amplitude of the preceding cardiac cycle. No correction was applied during DB due to rapid and unpredictable signal fluctuations. The correction algorithm performance was evaluated by matching and comparing PT and ECG triggers. PT triggers were generated on the PTC with a fixed threshold of 0.4 times the trained amplitude. Since trigger pairs were algorithmically identified, ECG triggers deviating by 0.7 or 1.5 times the median RR were excluded to remove potentially faulty ECG triggers. The proportion of missed PT triggers relative to ECG was computed. Delay times between ECG and PT triggers pairs were calculated. To evaluate the variation of the delay time, interquartile ranges (IQR) for each data set were calculated. Student’s t-tests were performed on median trigger delays and IQRs.Results
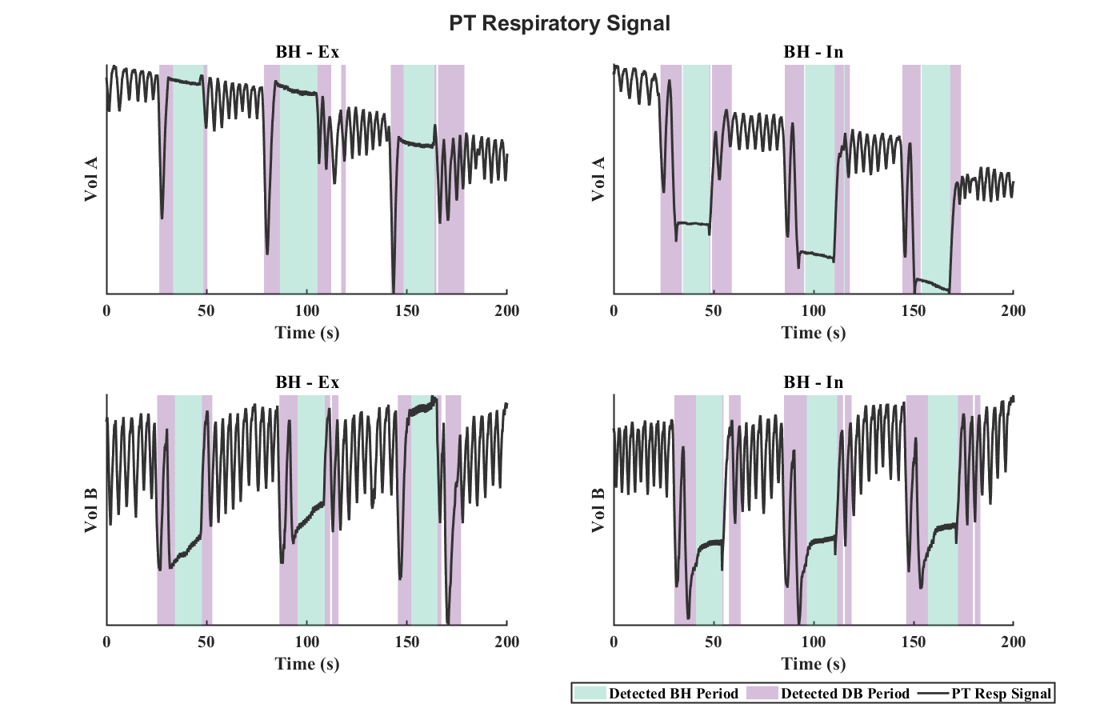
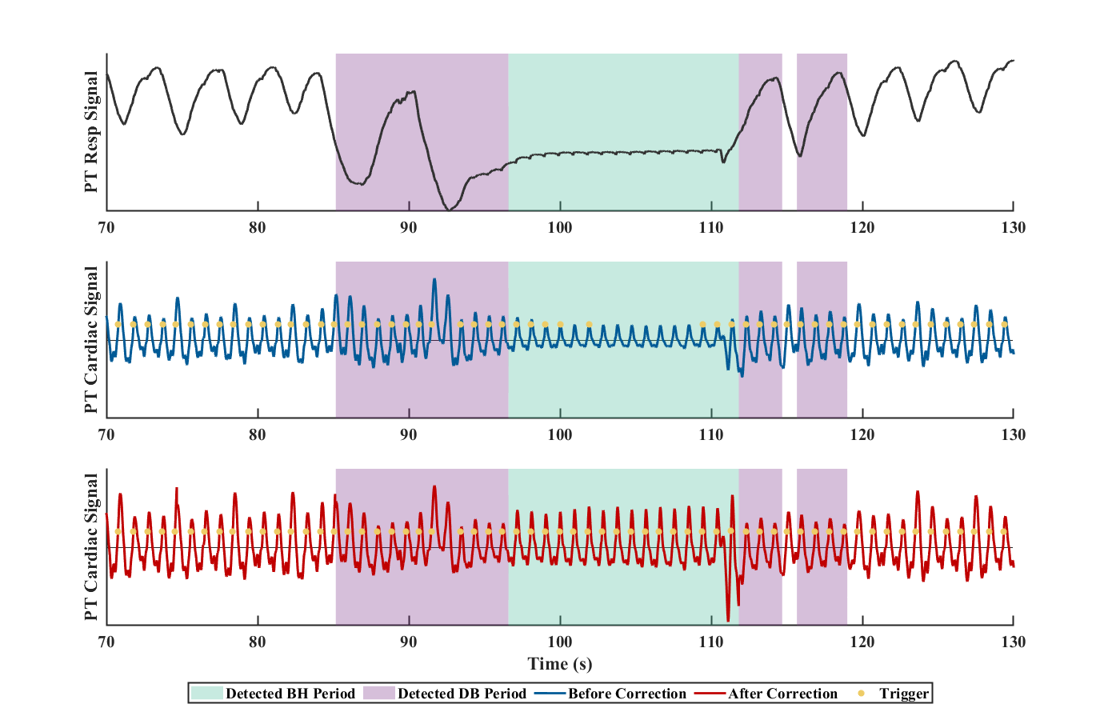
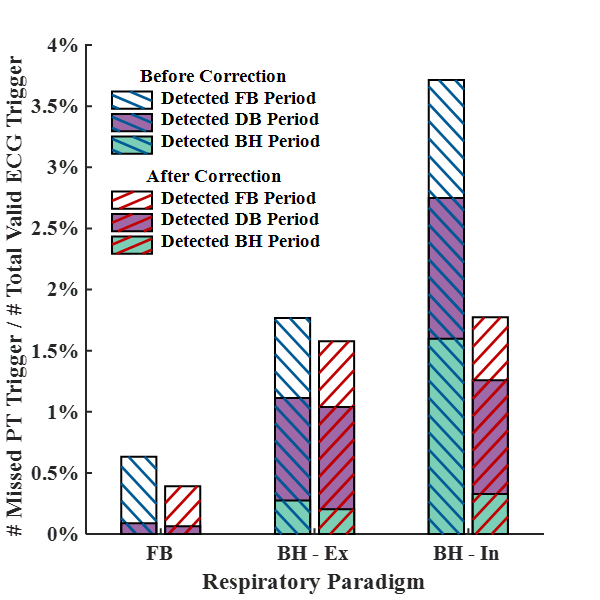
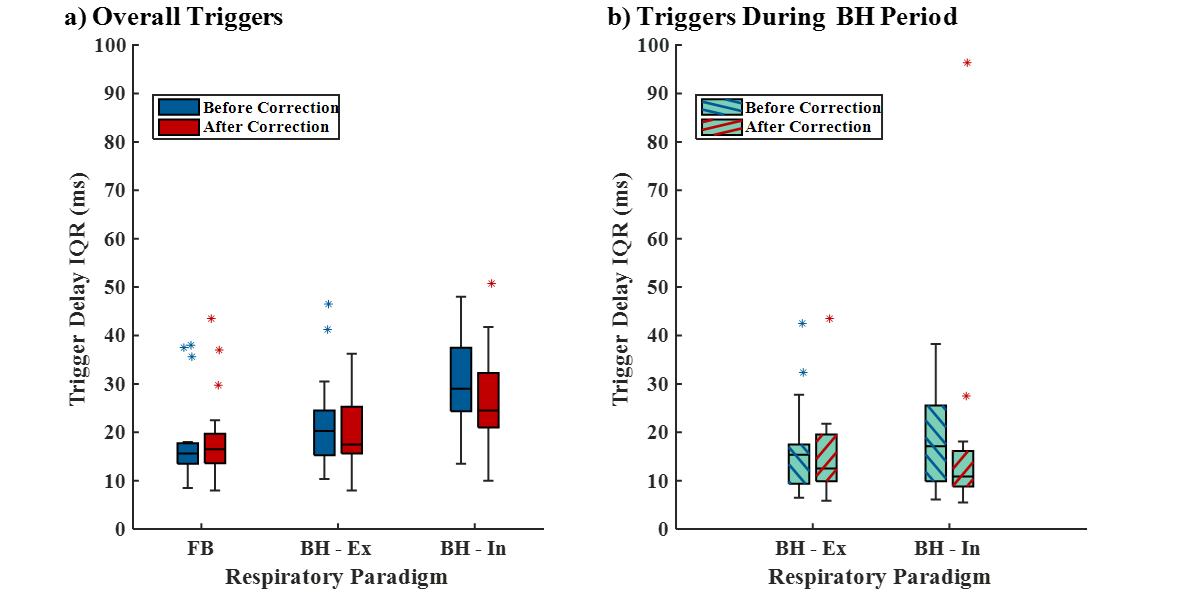
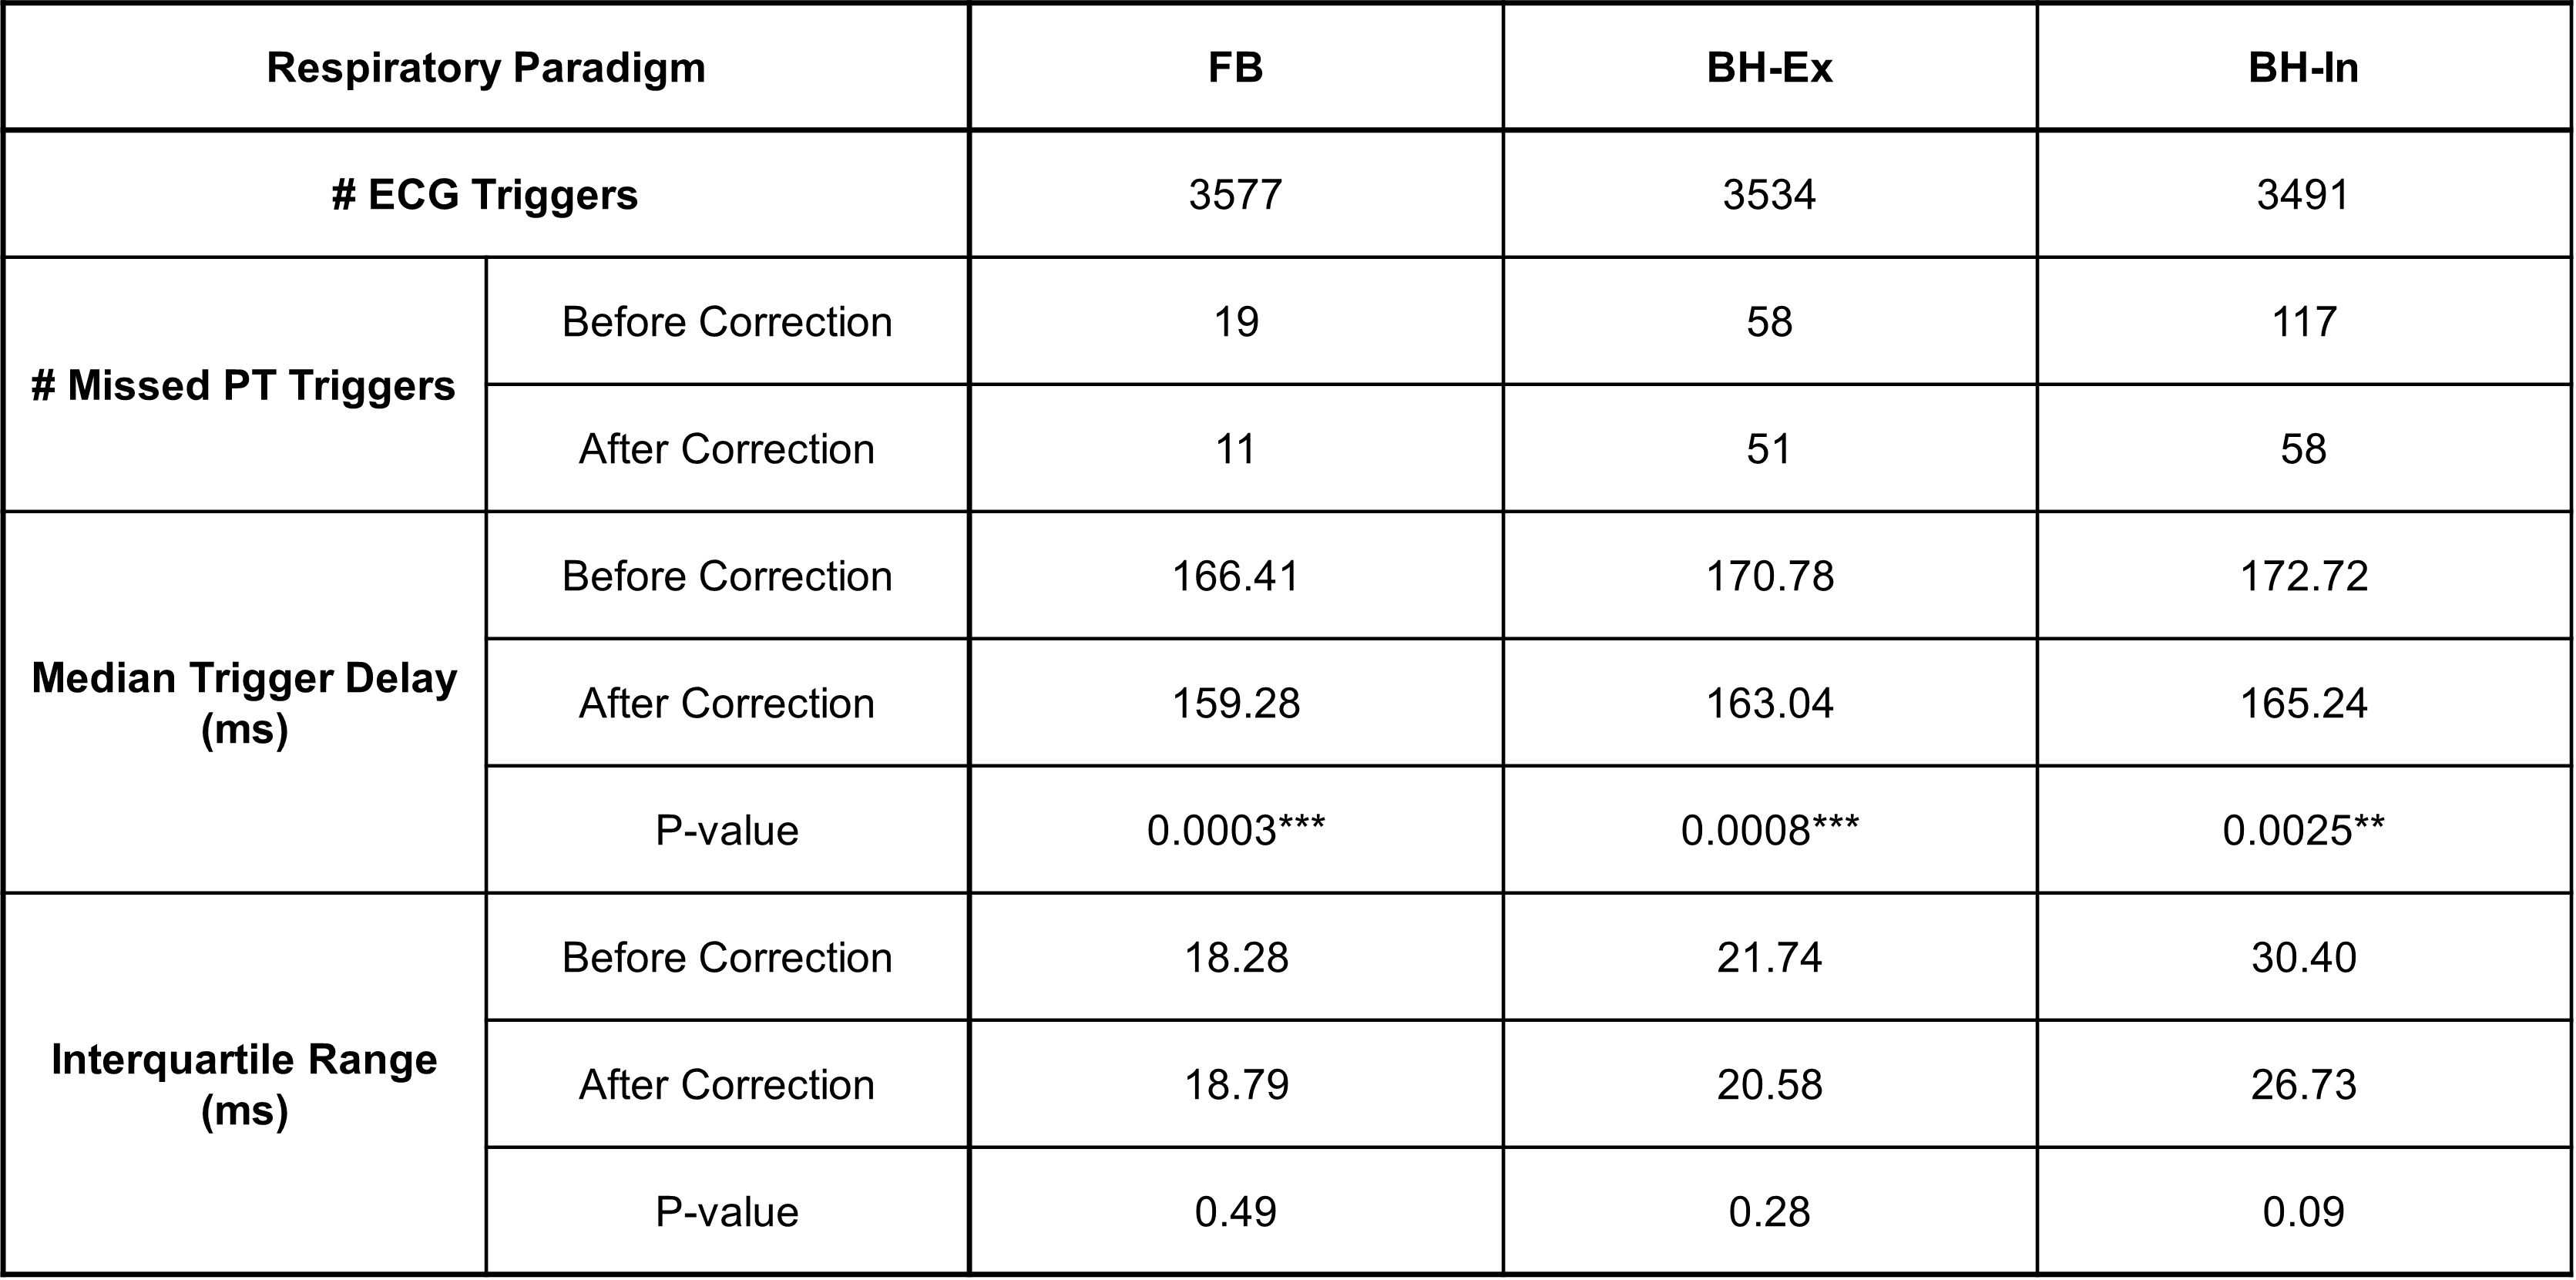
Two volunteers were excluded due to 1) difficulty in obtaining ECG signal, and 2) greater than 10% arrhythmic beats due to the limitation in trigger analysis. PT respiratory signals with detected BH and DB periods in two volunteers were presented in Figure 1. Representative respiratory and cardiac signals before and after correction are illustrated in Figure 2. ECG trigger and PT missed trigger counts, trigger delay and IQR statistics were summarized in Table 1. The percentage of missed PT triggers was highest with BH-in, as presented in Figure 3. Trigger delay IQRs for each respiratory paradigm are depicted in Figure 4.Discussion
A total of 10602 heartbeats, as determined by ECG, were evaluated. The application of a correction to the PTC reduced mis-triggers across all respiratory paradigms. A greater number of mis-triggers were found during breath-hold at inspiration. The most significant reduction in mis-triggers was also observed in this paradigm, where mis-triggers during breath-holds were reduced from 1.6% to 0.3%. A corresponding reduction in trigger delay was observed without increasing its variation significantly. After correction, the majority of the remaining mis-triggers were during DB, which typically is not encountered during image acquisition. The algorithm demonstrates potential to extend stable PTC triggering to inspiratory breath-holds; however, it should be further refined in accurately detecting breathing patterns and reducing latency. Additionally, its robustness during image acquisition requires validation to ensure its efficacy and reliability in a clinical setting.Conclusion
This study introduced a correction algorithm to mitigate the impact of respiratory motion on PTC amplitude. The algorithm is based on PT data only and effectively decreased the number of mis-triggers especially during inspiratory breath-holds, without increasing triggering variation.Acknowledgements
No acknowledgement found.References
[1] Lin, K., et al., Pilot Tone‐Triggered MRI for Quantitative Assessment of Cardiac Function, Motion, and Structure. Investigative Radiology, 2022: p. 10.1097.
[2] Pan, Y., et al., Two-center validation of Pilot Tone Based Cardiac Triggering of a Comprehensive Cardiovascular Magnetic Resonance Examination. Res Sq, 2023.
[3] Speier, P., et al. Enabling Pilot Tone cardiac triggering for complete cardiac examinations using an RF calibration procedure. in ISMRM. 2022. London, England, UK.
Figures