4634
Evaluation of MRS- and MRI- PDFF and Liver Biopsy measure of hepatic fat fraction in a clinically relevant cohort1Department of Radiation Physics, Radiology, Department of Medical and Health Sciences, Linköping University, Linköping, Sweden, 2Center for Medical Image Science and Visualization (CMIV), Linköping University, Linköping, Sweden, 3Department of Biomedical Engineering, Linköping University, Linköping, Sweden, 4AMRA Medical AB, Linköping, Sweden, 5Department of Clinical Pathology and Clinical Genetics, Department of Biomedical and Clinical Sciences, Linköping University, Linköping, Sweden, 6Department of Gastroenterology and Hepatology, Department of Health, Medicine and Caring Sciences, Linköping University, Linköping, Sweden, 7Department of Radiology and Department of Health, Medicine and Caring Sciences, Linköping University, Linköping, Sweden
Synopsis
Keywords: Liver, Liver
Motivation: Metabolic Associated Fatty Liver Disease (MAFLD) will increase the burden on future healthcare. Reliable screening alternatives such as MR-techniques e.g., nP-Dixon imaging and proton MR-spectroscopy are widely used. However, the number of studies comparing both MR-techniques with biopsies in clinically relevant cohorts is limited.
Goal(s): Compare MR Dixon imaging and proton MR-spectroscopy fat fraction with histological evaluation of steatosis
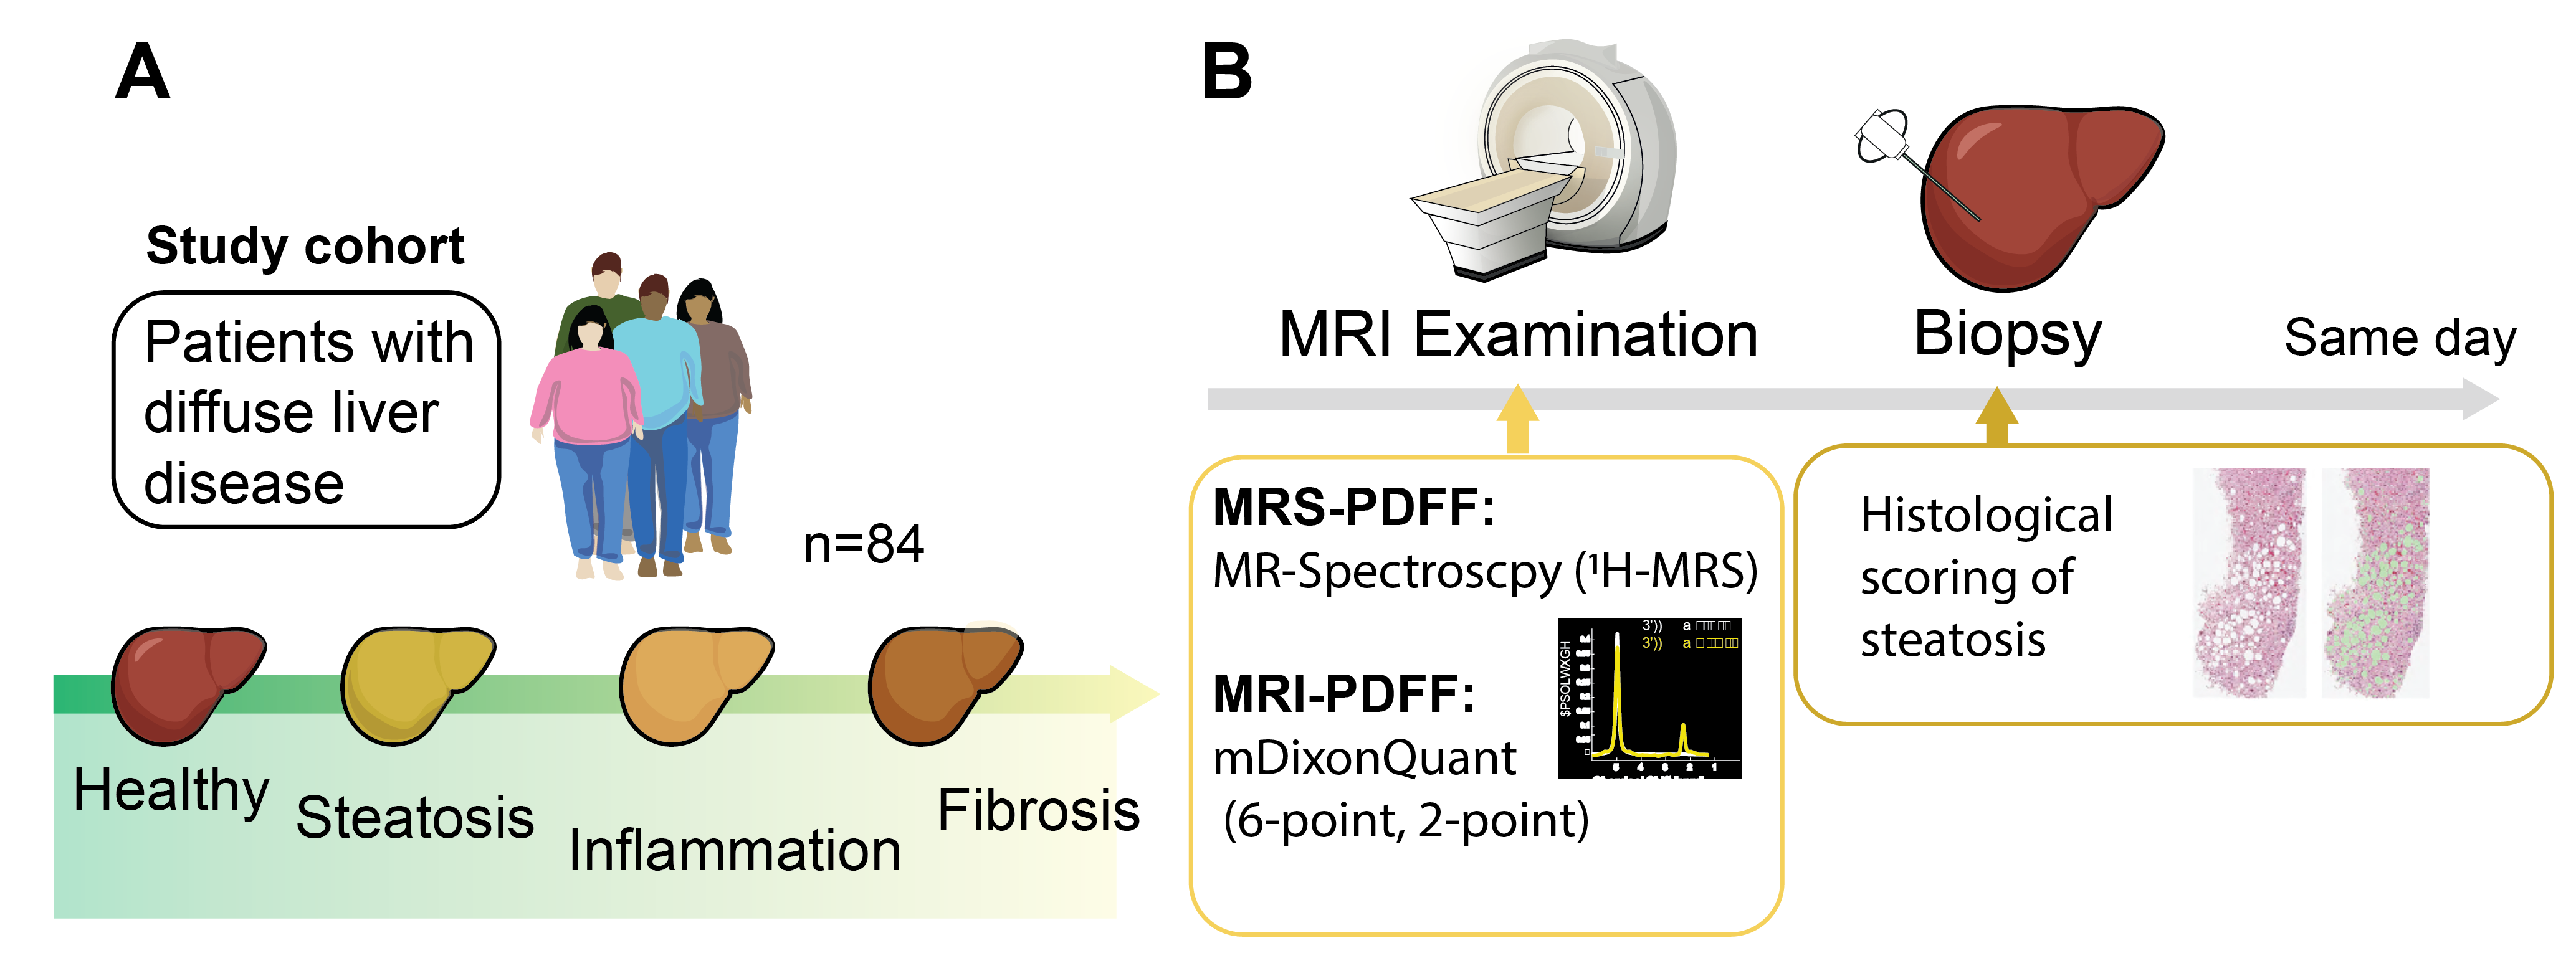
Approach: We have compared three different PDFF measurements; MRS, 6- and 2-point Dixon PDFF, in a prospective study, which included 84 clinically relevant patients with diffuse liver disease.
Results: All three techniques could accurately characterize histology based steatosis scores in this clinically relevant cohort.
Impact: In this prospective study, with a clinically relevant cohort, a difference between MRS and Dixon determined PDFF was measured. Both methods could distinguish between different histological levels of steatosis, and both methods could therefore characterize the patient group accurately.
Introduction
With a growing obese population, the prevalence of Metabolic Associated Fatty Liver Disease (MAFLD) is increasing (1), which will lead to an increased economic burden on future healthcare. The main characteristic of MAFLD is hepatic fat accumulation, also denoted steatosis. Steatosis is not inherently dangerous, but can progress into severe conditions such as NASH, cirrhosis and HCC. To identify these patients early, non-invasive screening methods are important, including techniques such as MRI- and MRS-derived proton density fat fraction (PDFF). However, the number of studies comparing both techniques with biopsies in clinically relevant cohorts is limited. To this cause, we have collected prospective data from a clinically relevant cohort comprised of 84 patients, all with suspected diffuse liver disease. The patients underwent an extensive MR-investigation which included MRS, and two different Dixon sequences. In addition, the patient also underwent ultrasound guided liver needle biopsy typically within an hour after the MR-examination.Methods
A total of 84 patients with suspected diffuse liver disease which were scheduled to undergo liver biopsy were recruited from the Linköping University hospital between the years 2016 to 2022. When arriving at the hospital the patients underwent an extensive MR-examination, including several fat fraction measurements; 1H-MRS (PRESS sequence, voxel size 30x30x30 mm3), six-point (6PD) mDixon Quant, and T1-weighted 2-point (2PD) mDixon, and the examinations were performed by experienced radiological nurses. Within an hour after the MR-examination the patients underwent an ultrasound guided biopsy. The biopsy was sent for detailed histological evaluation by an experienced histologist (SI). Post-processing of the MRS spectra and PDFF quantification was performed using LCmodel (Provencher, Canada) by an experienced researcher (JT).Post-processing and placement of regions of interests (ROIs) in the 6PD images was done using MATLAB (2022a; MathWorks, Natick, MA) by an experienced radiologist (ND), and placed in either the 1H-MRS voxel, or in the liver segment from where the biopsy was reportedly collected. 2PD images were quantified by fat-referenced (2) MRI using AMRA Researcher (AMRA Medical AB, Linköping Sweden) and ROIs were placed throughout the entire liver.
Results
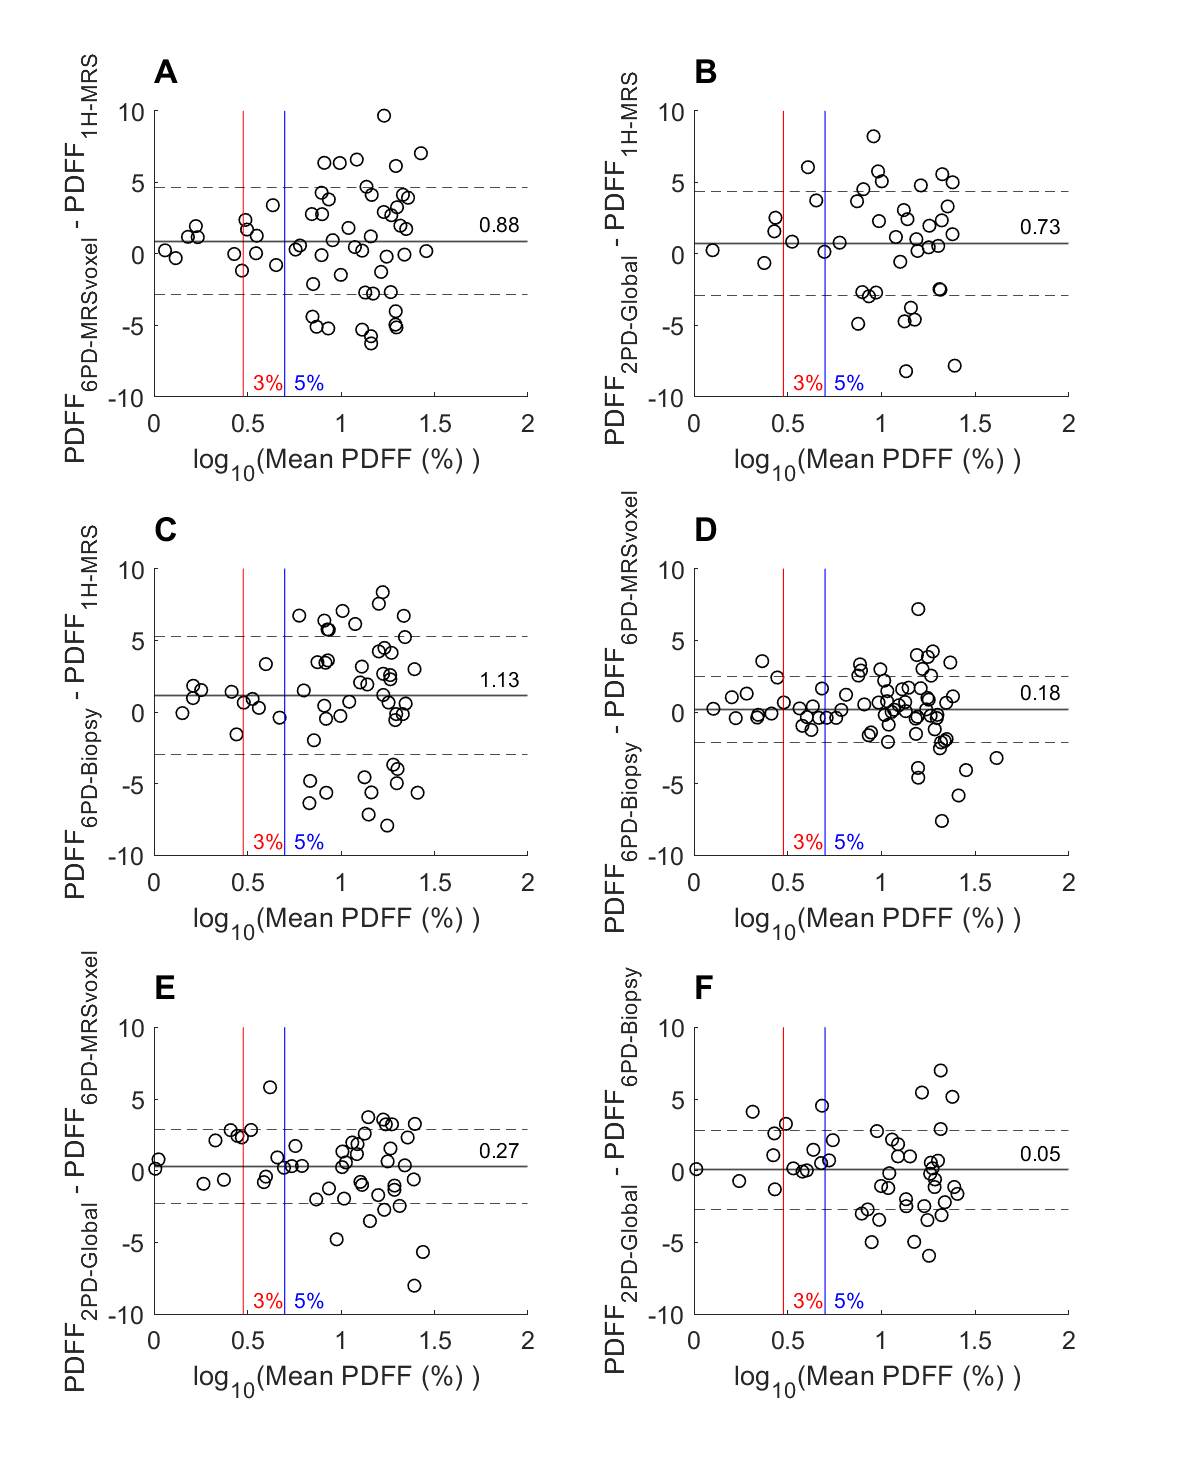
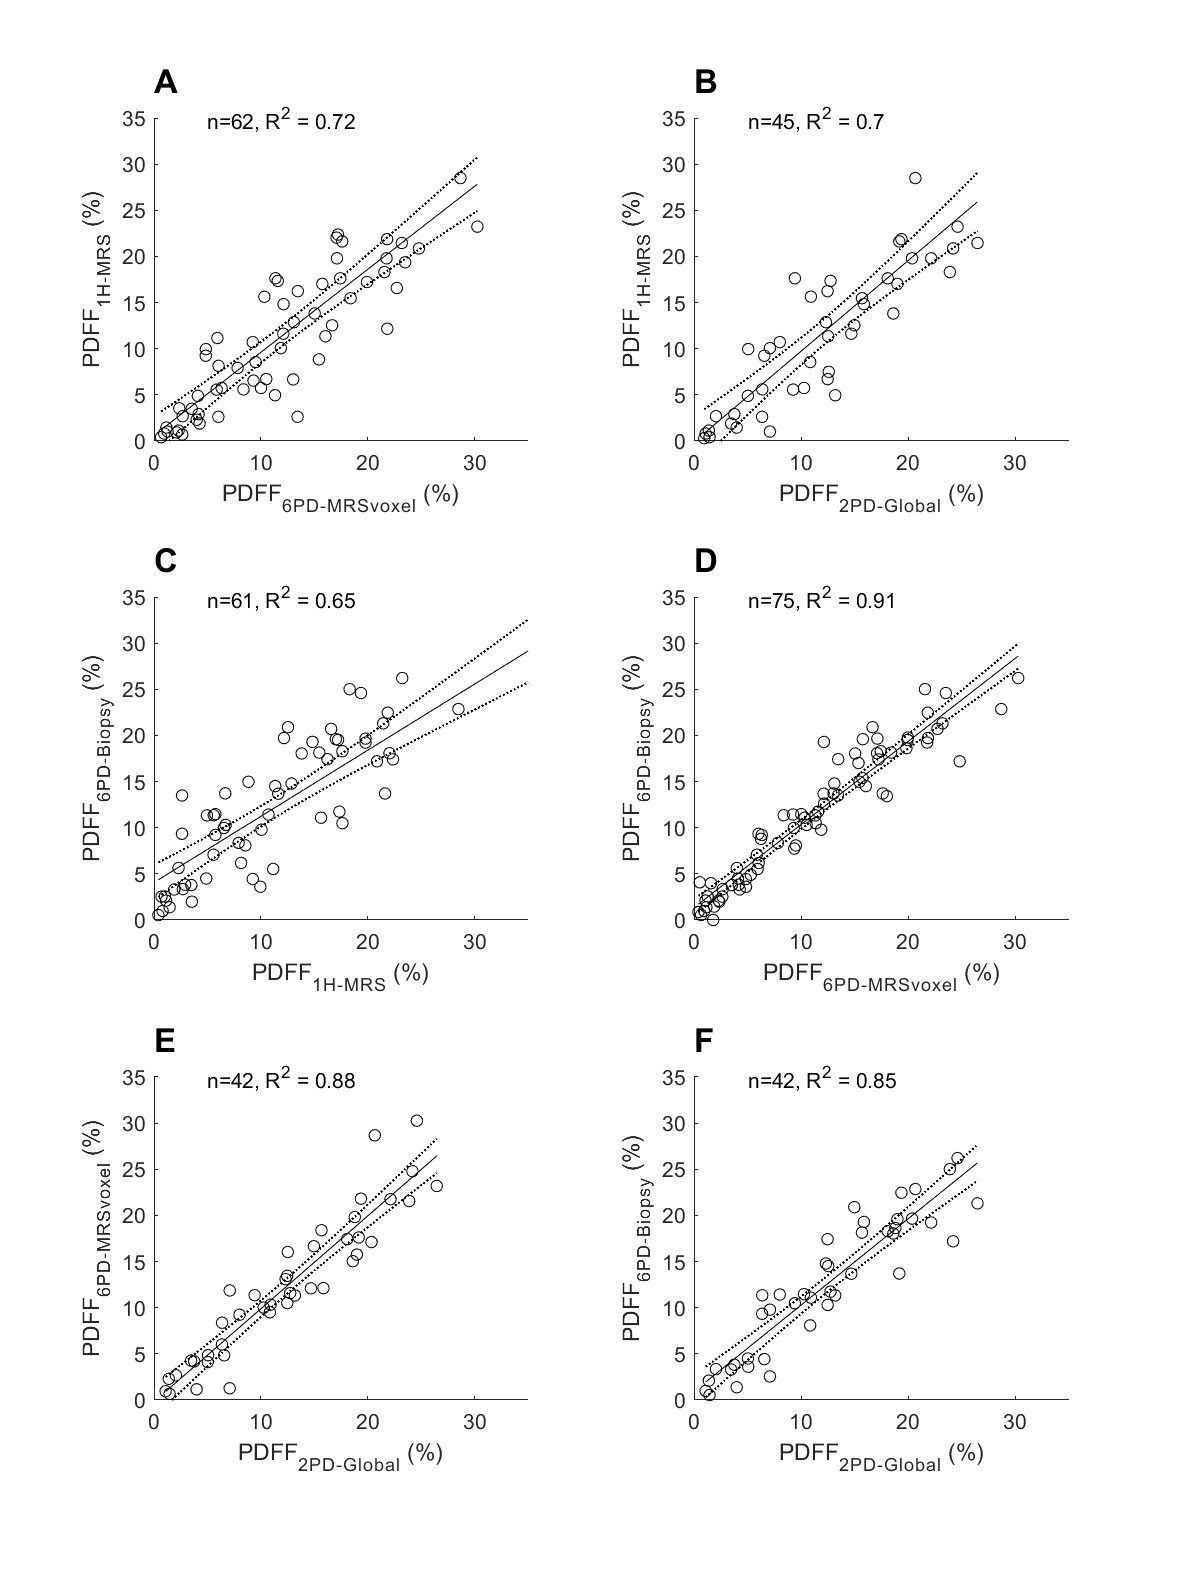
The following measures of PDFF were used: 1H-MRS, measurements for the two 6PD ROIs (MRS voxel, 6PDMRS-voxel, or biopsy segment, 6PDbiopsy) and the 2PD which measured the average PDFF over several ROIs. Bland-Altman plots were used to quantify the differences between the methods (Fig. 2). A larger difference was observed when comparing the MRS-determined PDFF with each separate Dixon measurement (Fig. 2A-C), compared to the comparison between the Dixon-measurements (Fig. 2D-F). The 3%, or 5% cut-off values for clinical diagnosis of steatosis (3) are also shown, and no significant bias could be observed between the measurements, at these normal concentrations.Linear regression analysis was performed in order to explore the correlations (Fig. 3). The highest correlation was found between the paired 6PD measurements (R2 = 0.90, Fig. 3D). These measurements also showed high correlation with the global 2PD measurement (6PDMRS-voxel, R2 = 0.88 and 6PDbiopsy, R2 = 0.85, Fig. 3E-F). For the MRS-measurements a similar correlation between 6PDMRS-voxel and 2PD global measurement was observed, R2 = 0.71 and R2 = 0.70 respectively (Fig. 3A-B).
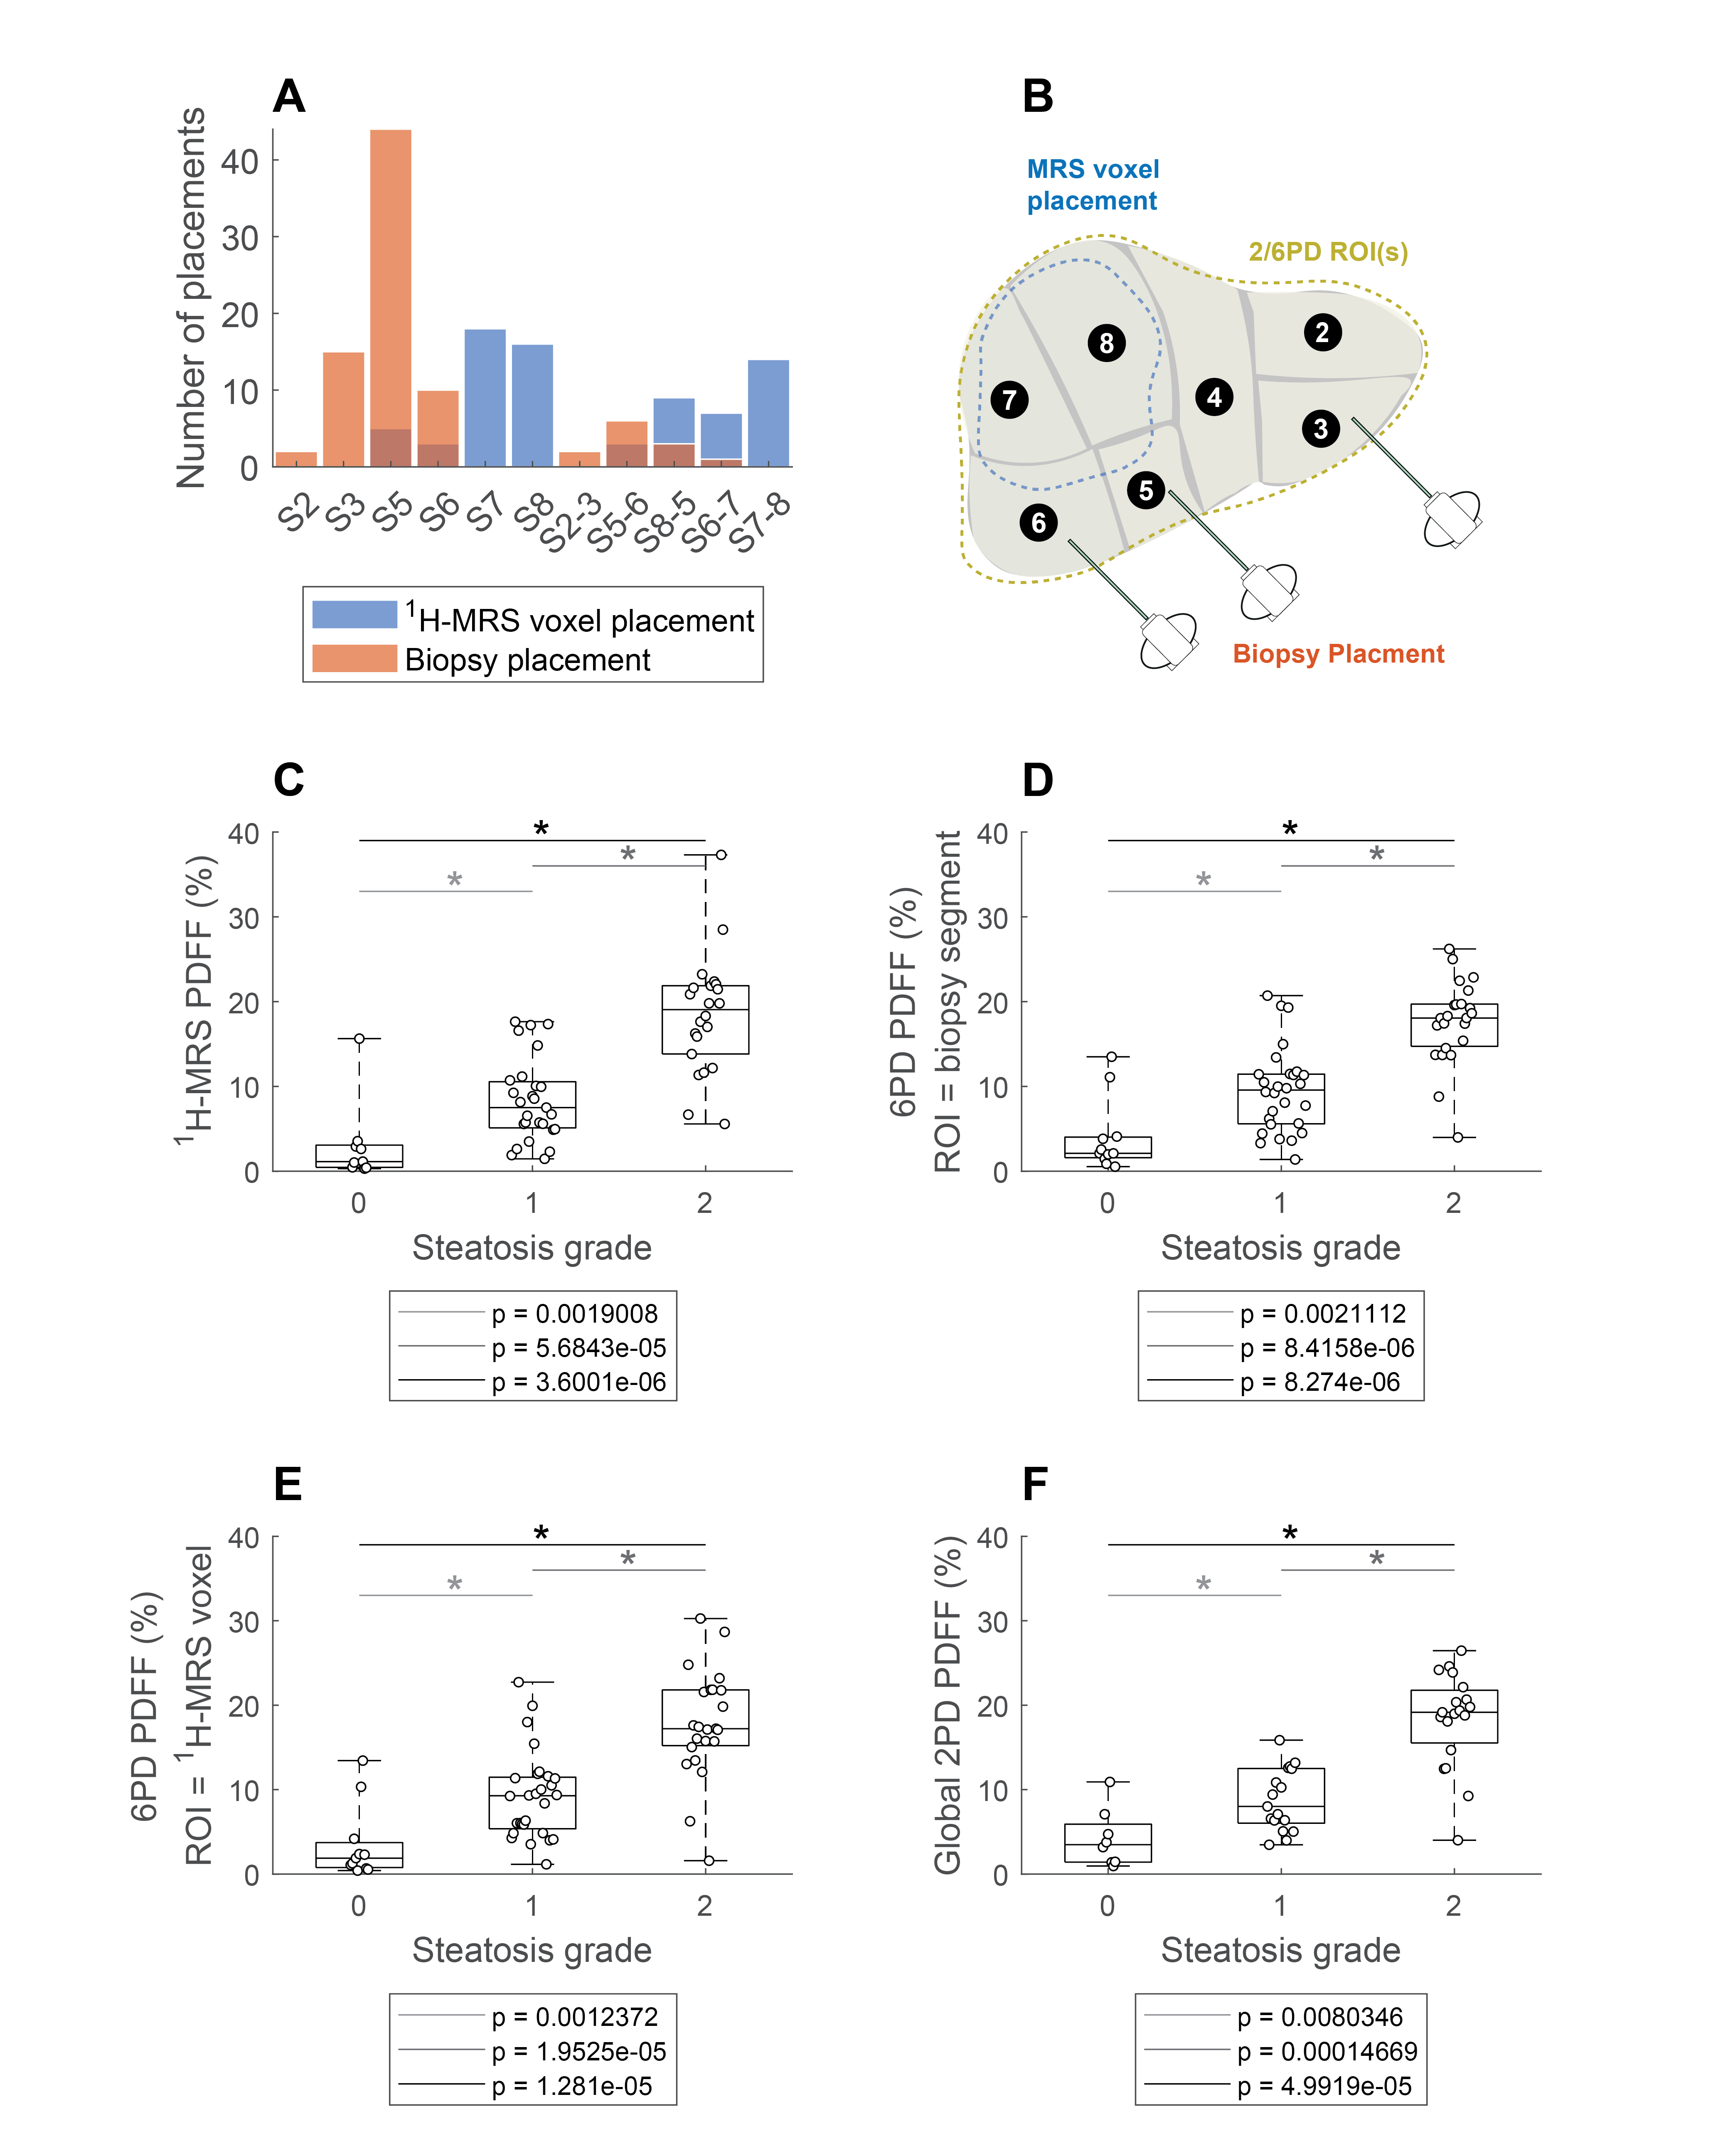
The ability to distinguish between different scores of histological steatosis was also evaluated (Fig.4). The MRS-measurements were in most cases placed in Couinaud segments 7-8, whereas the biopsies in most cases were acquired in segments 3,5 and 6. Nevertheless, all measurements could distinguish between different groups of steatosis scores; zero, low and moderate (0 to 2). Significant p-values ≤0.001 were observed (Wilcoxon rank sum test) when comparing different grades of steatosis, independent of detection method.
Discussion
The results showed that there were larger PDFF differences between measurement techniques, as compared to expected disease related to the fat storage heterogeneity between sites for needle biopsy, and ROI-placements. For example, even though the MRS-measurement and the 6PDMRS-voxel were positioned in an identical location, the differences between these measurements were larger compared with to the comparison between Dixon measurements. Correlation analysis resulted in similar conclusions. Nevertheless, all techniques could distinguish between different levels of steatosis.Conclusion
In conclusion, a small difference between MRS and Dixon derived PDFF values was observed at a group level. However, all three techniques could accurately distinguish between histology-based steatosis scores in this clinically relevant cohort.Acknowledgements
No acknowledgement found.References
1. Riazi K, Azhari H, Charette JH, Underwood FE, King JA, Afshar EE, et al. The prevalence and incidence of NAFLD worldwide: a systematic review and meta-analysis. Lancet Gastroenterol Hepatol. 2022 Sep 1;7(9):851–61.
2. Borga M, Ahlgren A, Romu T, Widholm P, Dahlqvist Leinhard O, West J. Reproducibility and repeatability of MRI-based body composition analysis. Magn Reson Med. 2020;84(6):3146–56.
3. Nasr P, Forsgren MF, Ignatova S, Dahlström N, Cedersund G, Leinhard OD, et al. Using a 3% Proton Density Fat Fraction as a Cut-off Value Increases Sensitivity of Detection of Hepatic Steatosis, Based on Results from Histopathology Analysis. Gastroenterology. 2017;153(1):53–5.
Figures