4631
Assessing Renal Interstitial Fibrosis by Compartmental, Non-Compartmental, Model-Free Diffusion MRI and Their Corticomedullary Difference1Radiology, Renji Hospital, School of Medicine, Shanghai Jiao Tong University, Shanghai, China, 2School of Biomedical Engineering, ShanghaiTech University, Shanghai, China, 3Shanghai Key Laboratory of Magnetic Resonance, School of Physics and Electronics Science, East China Normal University, Shanghai, China, 4Nephrology, Renji Hospital, School of Medicine, Shanghai Jiao Tong University, Shanghai, China
Synopsis
Keywords: Kidney, Kidney
Motivation: Non-invasive evaluation of chronic kidney disease (CKD) is of increasing value.
Goal(s): This study aims to assess renal interstitial fibrosis (IF) using diffusion-based MRI approached and their corticomedullary difference (CMD) in CKD patients.
Approach: MRI parameters from apparent diffusion coefficient (ADC), intra-voxel incoherent motion (IVIM), diffusion kurtosis imaging (DKI) and diffusion-relaxation correlated spectrum imaging (DR-CSI) were obtained both for renal cortex and medullary. CMD of these parameters were calculated.
Results: Several diffusion-based MRI parameters are promising for differentiating between the mild and moderate-severe renal IF. CMD shows potential for the assessment of renal IF on a supplementary role.
Impact: This study shows attempts on non-invasive assessment of renal interstitial fibrosis using several typical advanced model or model-free methods regarding diffusion MRI. Also, it illustrates the possible role of renal corticomedullary difference of these approaches in the assessment.
Introduction
Interstitial fibrosis (IF) is a key histological feature of chronic kidney disease (CKD)1. Patients with extensive fibrosis are more likely to progress to end-stage renal failure2, leading to requirement of dialysis or transplantation. Considering the invasive nature and risk of bleeding of percutaneous biopsy, the value of non-invasive IF assessment is increasing.Diffusion weighted imaging (DWI) and its derivatives could assess renal IF3,4. Past research has already linked apparent diffusion coefficient (ADC) with IF levels5. Nevertheless, complex microenvironment would deflect the water diffusion from Gaussian. Therefore, advanced diffusion models were introduced, including compartmental and non-compartmental models. Intra-Voxel Incoherent Motion (IVIM)6 is a representative for the former, while diffusion kurtosis imaging (DKI)7 represent the latter. Recently, model-free methods like diffusion-relaxation correlated spectrum imaging (DR-CSI) have also raised8,9.
This study aims to assess renal interstitial fibrosis using diffusion-based MRI approached and their corticomedullary difference (CMD) in CKD patients.
Methods
Forty-two patients (23 male, 19 female, age 24–74) with CKD were included. Patients were categorized into mild IF (n=23) and moderate-severe IF (n=19) groups according to the pathology results.Patients underwent MRI examinations on a 3T scanner (Magnetom Prisma, Siemens Healthineers). Scanning procedure included 12-b-value DWI and 6-echo-time (TE) 6-b DR-CSI, both realized by realized by a spin-echo single-shot echo-planar-imaging sequence. MRI parameters from ADC, IVIM, DKI and DR-CSI were obtained both for renal cortex and medullary. For DR-CSI, three compartment A (short T2), B (long T2) and C (high diffusivity) were defined by boundaries manually chosen (T2 boundary within 30~50 ms, diffusivity boundary 6~9 μm2/ms) at visible peak gap. CMD of these parameters were calculated.
Group comparisons were performed using Student’s t-test, Mann-Whitney U-test or Chi-square test. Diagnostic performances were assessed by receiver operator’s curve (ROC) analysis with area under curve (AUC), sensitivity and specificity. Delong’s test was used for comparison between AUC.
Results
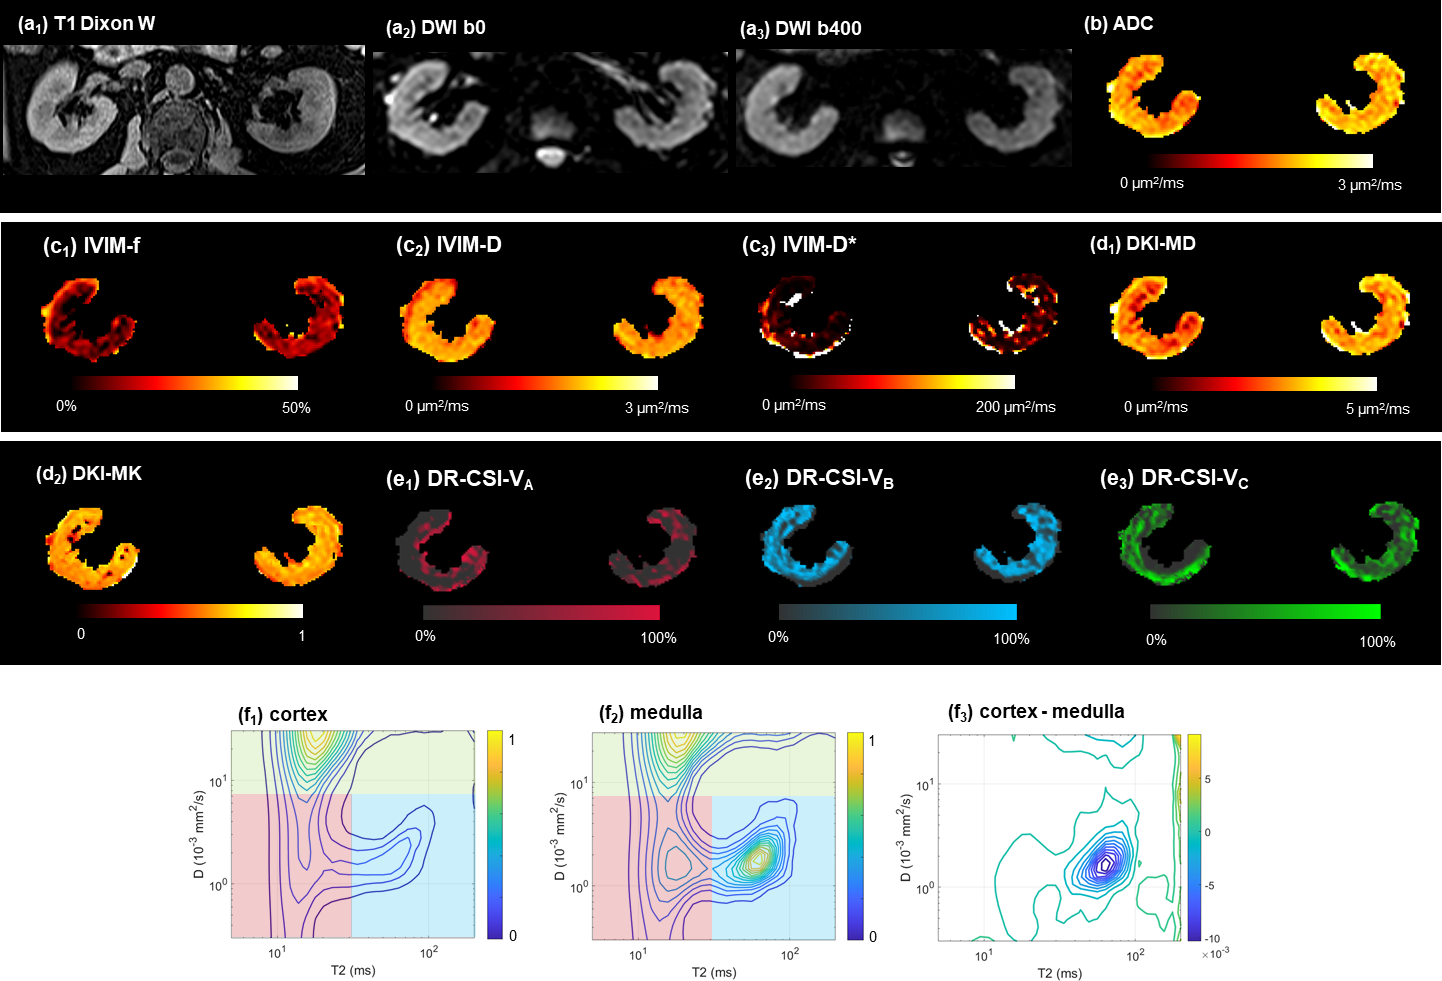
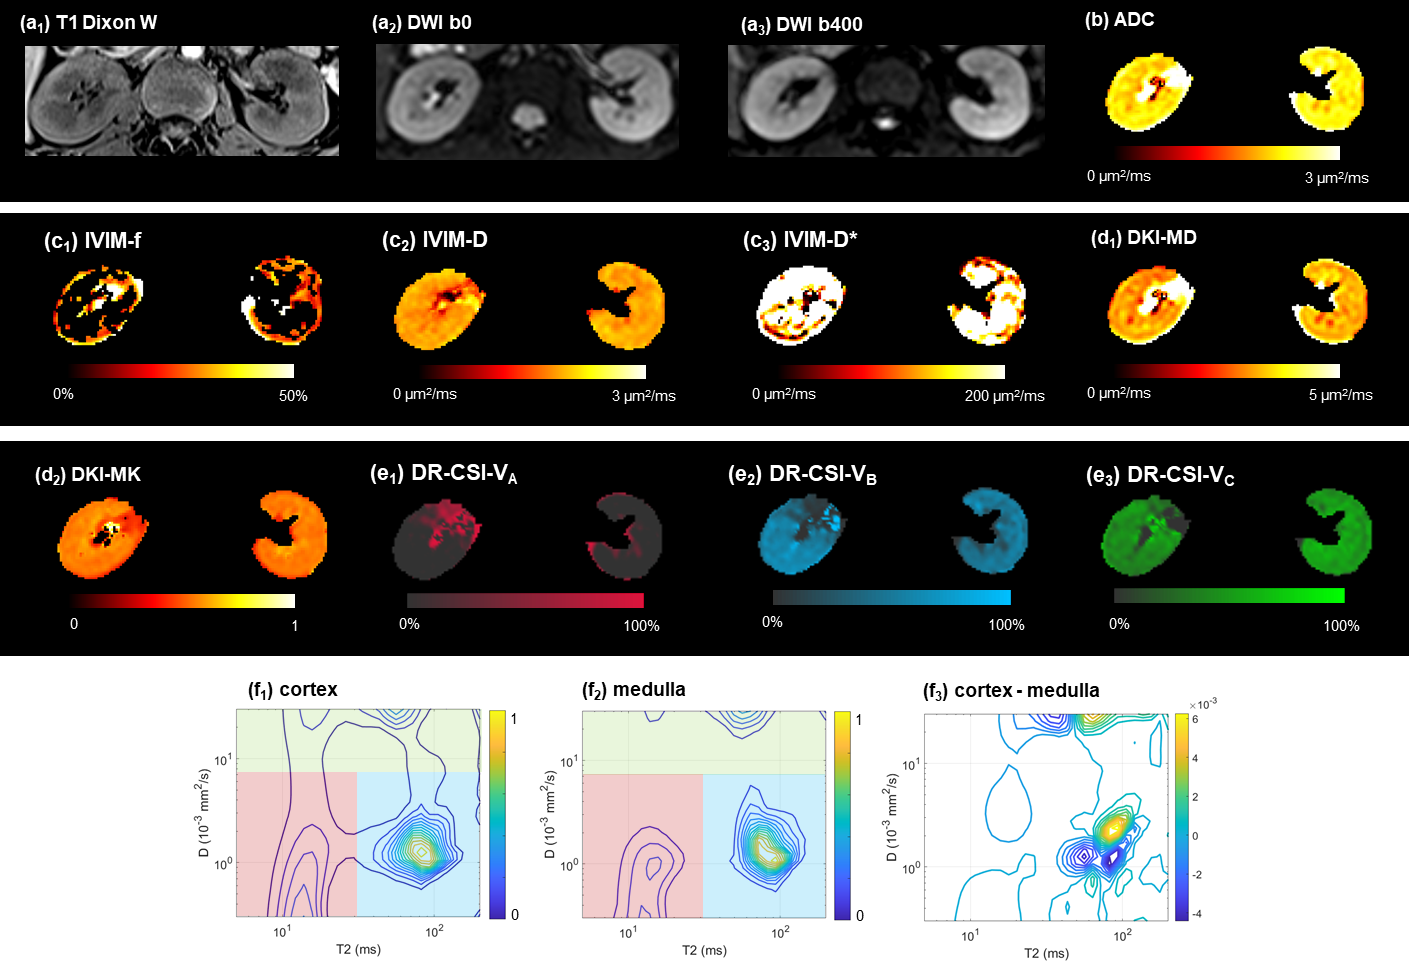
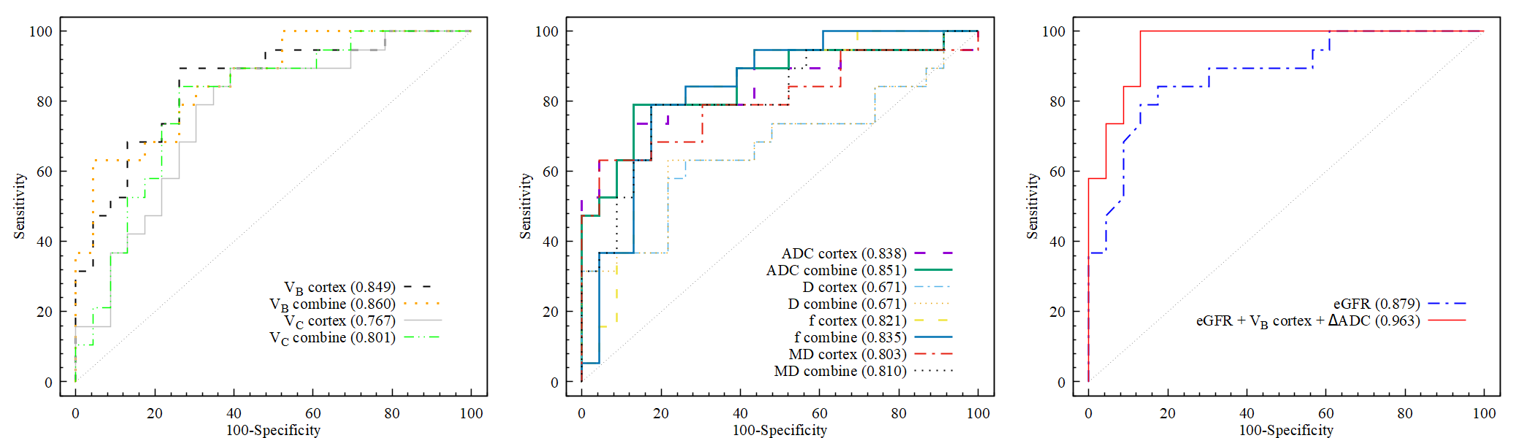
Two typical cases are given in Figure 1 and 2. Inter-operator agreements for all parameters are good. In the cortex, ADC (1.97±0.23 vs 2.19±0.12 μm2/ms), D (1.54±0.16 vs 1.65±0.10 μm2/ms), f (17.3±4.9% vs 22.6±4.6%), MD (2.74±0.48 vs 3.17±0.29 μm2/ms) and VC (24.9±5.3% vs 31.0±6.5%) presented lower values, while VB (54.5±8.4% vs 42.9±8.5%) displayed higher value in the moderate-severe IF with significance. Regarding CMD, significant difference between the two groups for CMD was found in ΔADC, ΔMD, ΔVB and ΔVC.The results of ROC analysis are presented in Figure 3. Among the cortical MRI parameters, VB showed a numerically highest AUC of 0.849, while ADC, f and MD also showed AUC>0.8. Among the CMD, only ΔADC showed good performance (AUC=0.828). After combining cortical value and CMD, AUCs of the MRI parameters were slightly improved (1% – 5%) except for IVIM-D, although not significant. Differentiating moderate-severe IF using eGFR alone turned out a good performance (AUC=0.879). A combination of cortical VB, ΔADC and eGFR could reach AUC of 0.963, which brings a 9% raise with marginal significance (P=0.068).
Discussion
While the use of DKI in human kidney MRI is on the rise, the origin of “kurtosis” remains debated. Our study demonstrates an inter-group difference for MD but not for MK, limiting its utility in current scenario. IVIM-f, believed to link with microvascular perfusion, demonstrates some potential in IF assessment. Yet, Δf seem to provide no further information. DR-CSI cortical VB, probably related to contribution from hindered extra-cellular water, outperformed other diffusion-based parameters in this study. Elevated ΔVB in moderate-severe IF might relate to the increased ECM accumulation. Decreased ΔVC in the same group hint at a diminished contribution and potentially reduced diffusivity within cortical microvascular.The use of renal corticomedullary difference in MRI parameters to evaluate fibrosis has been explored in several studies1,3. According to our findings, CMD of the diffusion-based parameters alone do not surpass the cortical values in assessing IF. The reliability as a reference for medulla might be compromised by varied pathological changes across CKD patients. Nevertheless, CMD may still temper the effects of individual diffusivity variations, as our study showed a slight increase in AUC when incorporating CMD versus relying solely on cortical MRI indicators.
Conclusion
Several diffusion-based MRI parameters are promising for differentiating between the mild and moderate-severe renal IF. CMD shows potential for the assessment of renal IF on a supplementary role.Acknowledgements
No acknowledgement found.References
1. Berchtold L, Friedli I, Crowe LA, et al. Validation of the corticomedullary difference in magnetic resonance imaging-derived apparent diffusion coefficient for kidney fibrosis detection: a cross-sectional study. Nephrology Dialysis Transplantation 2020;35(6):937-945.
2. Nangaku M. Chronic hypoxia and tubulointerstitial injury: A final common pathway to end-stage renal failure. Journal of the American Society of Nephrology 2006;17(1):17-25.
3. Friedli I, Crowe LA, Berchtold L, et al. New Magnetic Resonance Imaging Index for Renal Fibrosis Assessment: A Comparison between Diffusion-Weighted Imaging and T1 Mapping with Histological Validation. Scientific Reports 2016;6.
4. Thoeny HC, Grenier N. Science to Practice: Can Diffusion-weighted MR Imaging Findings Be Used as Biomarkers to Monitor the Progression of Renal Fibrosis? Radiology 2010;255(3):667-668.
5. Zhao J, Wang ZJ, Liu M, et al. Assessment of renal fibrosis in chronic kidney disease using diffusion-weighted MRI. Clinical Radiology 2014;69(11):1117-1122.
6. Hennedige T, Koh TS, Hartono S, et al. Intravoxel incoherent imaging of renal fibrosis induced in a murine model of unilateral ureteral obstruction. Magnetic Resonance Imaging 2015;33(10):1324-1328.
7. Liu Y, Zhang GMY, Peng XY, Li XM, Sun H, Chen LM. Diffusion kurtosis imaging as an imaging biomarker for predicting prognosis in chronic kidney disease patients. Nephrology Dialysis Transplantation 2022;37(8):1451-1460.
8. Kim D, Doyle EK, Wisnowski JL, Kim JH, Haldar JP. Diffusion-relaxation correlation spectroscopic imaging: A multidimensional approach for probing microstructure. Magn Reson Med 2017;78(6):2236-2249.
9. Liu F, Hu WT, Sun YW, et al. Exploration of Interstitial Fibrosis in Chronic Kidney Disease by Diffusion-Relaxation Correlation Spectrum MR Imaging: A Preliminary Study. Journal of Magnetic Resonance Imaging 2022.
Figures