4629
Quantifying liver fibrosis via diamagnetic susceptibility sources using MRI: An ex-vivo feasibility study.1Radiology, Weill Cornell Medicine, New York, NY, United States, 2Applied and Engineering Physics, Cornell Univeristy, Ithaca, NY, United States, 3Meinig School of Biomedical Engineering, Cornell Univeristy, Ithaca, NY, United States, 4Department of Pathology, Columbia University Medical Center, New York, NY, United States, 5Department of Pediatrics, Columbia University, New York, NY, United States
Synopsis
Keywords: Liver, Liver
Motivation: Liver biopsy, traditionally regarded as the benchmark for liver fibrosis staging, is an invasive procedure that may cause infection and bleeding.
Goal(s): To develop a non-invasive method to evaluate liver fibrosis using MRI.
Approach: Diamagnetic sources are separated from paramagnetic sources using a biophysical model and multi echo gradient echo data. The value of the diamagnetic sources can be used to quantify the amount of accumulation of collagen due to liver fibrosis.
Results: Significant differences in liver negative susceptibility were observed between lower stage, medium stage and higher stage of fibrosis.
Impact: Multi-echo gradient echo data may provide a way to non-invasively stage liver fibrosis.
Introduction
Liver fibrosis is a pathological condition characterized by the excessive accumulation of extracellular matrix proteins, particularly collagen, as a response to chronic liver injury (1). The extracellular matrix proteins and collagens are diamagnetic. Therefore, the amount of diamagnetic susceptibility sources may be used to evaluate the stage of liver fibrosis. However, the coexistence of paramagnetic contents such as iron in some patients with liver fibrosis makes measuring the diamagnetic content difficult. Recently, a biophysical model was proposed that separates the paramagnetic and diamagnetic sources in MRI by utilizing QSM and additional ’ information (2-3). In this work, we demonstrate that the diamagnetic susceptibility can be useful to quantify the fibrotic tissues in the liver. In this work, we compare different MRI parameters including R2*, R2, R2’, QSM, PDFF and (negative susceptibility sources) in their ability to differentiate non-fibrotic/mild-stage fibrosis (F0, F1), medium stage fibrosis (F2, F3), and cirrhosis (F4).Theory
The relaxation of the collage fibers and iron granules, which manifest as micro-cylinders and micro-spheres respectively, can be modeled with the static dephasing model (3). R2’(r) is given by:$$R_2'(r)=R_2^*(r)-R_2(r)=D_r^+|\chi^+(r)|+D_r^-|\chi^-(r)|,$$ where $$$\chi^+(r)$$$ and $$$\chi^-(r)$$$ are the positive and negative susceptibility sources respectively, ,and $$$D_r^+$$$ and $$$D_r^-$$$ are the relaxometric constants of the positive and negative susceptibility sources respectively.The QSM, $$$\chi(r)$$$ can be written as
$$\chi(r)=|\chi^+(r)|-|\chi^-(r)|.$$
The reconstruction of $$$\chi^+(r)$$$ and $$$\chi^-(r)$$$ are detailed in (2).
Method
Liver explant samples from 18 patients were collected, scanned, and analyzed (Figure 1). The liver samples also underwent histopathological analysis using hematoxylin and eosin (H&E), Masson's trichrome and Prussian Blue stains for histology, fibrosis, and iron evaluation, respectively. MRI imaging parameters were (1) 3D mGRE at 3T (GE Healthcare, Waukesha, WI, USA), 8 echoes, flip angle = 15, TE1 = 2.6 ms, ΔTE = 2.7 ms, TR = 24.43 ms, reconstructed voxel size = 0.88 × 0.88 × 1 mm3, bandwidth = 390 Hz/pixel, reconstructed matrix = 256 × 256 x 74-128. (2) 2D multi-echo spin-echo data (for R2), FOV = 240 ×240 mm2 , voxel size = 0.9375 ×0.9375 mm2 , slice thickness = 1 mm, number of slices = 18-22, TR = 1500 ms, TE = 6.6, 13.2, 19.8 26.4, 33.1, 39.7, 46.3, and 52.9 ms, band-width = 244 Hz/pixel. From mGRE, water-fat separation (4-5) was performed, and QSM (6-9) and R2* (10) were calculated. Masks are drawn on the scanned liver samples, and average R2*, R2, R2’, $$$\chi$$$, PDFF and | were calculated within the masks.Results
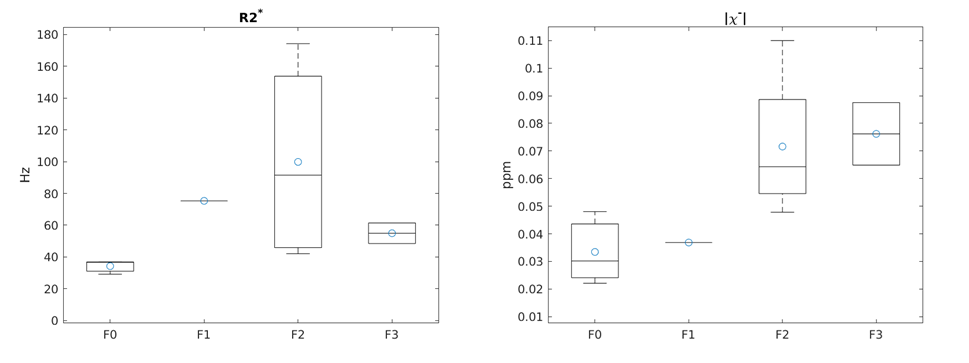
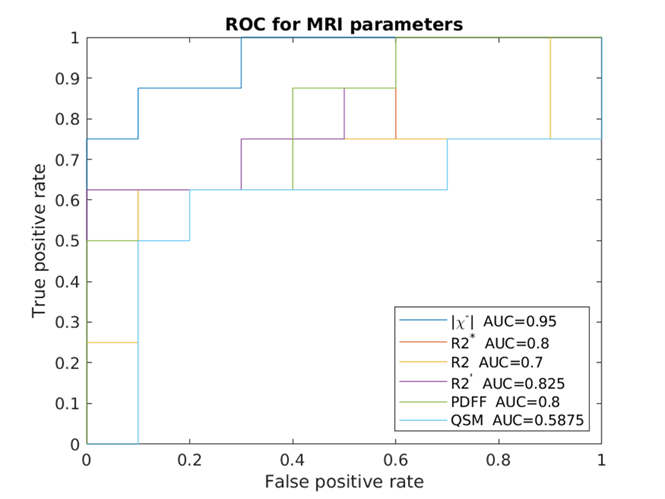
Figure 2 shows a representative example of QSM, $$$|\chi^+(r)|$$$ and $$$|\chi^-(r)|$$$ as well as hematoxylin and eosin (H&E), Prussian Blue and Masson's trichrome stains in the same liver sample. Figure 3 compares R2*, R2, R2’, $$$\chi$$$, PDFF and $$$|\chi^-(r)|$$$ for the samples without fibrosis or with mild fibrosis (F0-1), samples with medium stage fibrosis (F2-3) and samples with cirrhosis (F4). R2* and R2’ showed a significant difference between F2-3 and F4 samples (P = 0.0426 and 0.0293 respectively). R2 showed a significant difference between non-fibrotic/mild-fibrotic samples F0-1 and mediated stage fibrotic (F2-3) samples (P = 0.0381). There is also a significant difference between the PDFF of the F2-3 and F4 samples, since 7 out of the 8 samples in the F4 group have steatosis, but 5 out of 6 of F2-3 do not exhibit steatosis. The average absolute negative susceptibility is significantly different between F0-1 and F2-3 (P = 0.019) and between F2-3 and F4 (P=0.0027). The higher stage corresponds to higher absolute diamagnetic susceptibility values, which is consistent with the assumption. This trend can also be shown in the finer fibrosis groups, as in Figure 4 (right). The mean negative susceptibility values of F0, F2, F2 and F3 are 0.03, 0.04, 0.07 and 0.08 ppm respectively. However, R2*does not exhibit this trend, likely due to the coexistence of iron, as shown in Figure 4 (left).ROC curves for distinguishing between fibrosis stages F0-2 and fibrosis stages F3-4 are shown in Figure 5. The negative susceptibility source yields the best AUC= 0.95.
Discussion
This study shows that the susceptibility values of diamagnetic can be used to quantify the fibrotic tissues in liver, which may allow a non-invasive evaluation of fibrosis stage in patients.Acknowledgements
No acknowledgement found.References
(1) Bataller R, Brenner DA. Liver fibrosis. J Clin Invest. 2005;115(4):1100-. doi: Doi 10.1172/Jci200524282c1. PubMed PMID: WOS:000228145700044.
(2) Shin HG, Lee J, Yun YH, Yoo SH, Jang J, Oh SH, Nam Y, Jung S, Kim S, Fukunaga M, Kim W, Choi HJ, Lee J. chi-separation: Magnetic susceptibility source separation toward iron and myelin mapping in the brain. Neuroimage. 2021;240:118371. doi: 10.1016/j.neuroimage.2021.118371. PubMed PMID: 34242783. (3) Yablonskiy DA, Haacke EM. Theory of NMR signal behavior in magnetically inhomogeneous tissues: the static dephasing regime. Magn Reson Med. 1994;32(6):749-63. doi: 10.1002/mrm.1910320610. PubMed PMID: 7869897.
(4) Dong J, Liu T, Chen F, Zhou D, Dimov A, Raj A, Cheng Q, Spincemaille P, Wang Y. Simultaneous phase unwrapping and removal of chemical shift (SPURS) using graph cuts: application in quantitative susceptibility mapping. IEEE Trans Med Imaging. 2015;34(2):531-40. doi: 10.1109/TMI.2014.2361764. PubMed PMID: 25312917.
(5) Reeder SB, McKenzie CA, Pineda AR, Yu H, Shimakawa A, Brau AC, Hargreaves BA, Gold GE, Brittain JH. Water-fat separation with IDEAL gradient-echo imaging. J Magn Reson Imaging. 2007;25(3):644-52. doi: 10.1002/jmri.20831. PubMed PMID: 17326087.
(6) Liu T, Khalidov I, de Rochefort L, Spincemaille P, Liu J, Tsiouris AJ, Wang Y. A novel background field removal method for MRI using projection onto dipole fields (PDF). Nmr Biomed. 2011;24(9):1129-36. doi: 10.1002/nbm.1670. PubMed PMID: 21387445; PMCID: PMC3628923.
(7) Liu J, Liu T, de Rochefort L, Ledoux J, Khalidov I, Chen WW, Tsiouris AJ, Wisnieff C, Spincemaille P, Prince MR, Wang Y. Morphology enabled dipole inversion for quantitative susceptibility mapping using structural consistency between the magnitude image and the susceptibility map. Neuroimage. 2012;59(3):2560-8. doi: 10.1016/j.neuroimage.2011.08.082. PubMed PMID: WOS:000299494000057.
(8) Liu Z, Spincemaille P, Yao Y, Zhang Y, Wang Y. MEDI+0: Morphology enabled dipole inversion with automatic uniform cerebrospinal fluid zero reference for quantitative susceptibility mapping. Magn Reson Med. 2018;79(5):2795-803. doi: 10.1002/mrm.26946. PubMed PMID: 29023982; PMCID: PMC5821583.
(9) Liu Z, Kee Y, Zhou D, Wang Y, Spincemaille P. Preconditioned total field inversion (TFI) method for quantitative susceptibility mapping. Magn Reson Med. 2017;78(1):303-15. doi: 10.1002/mrm.26331. PubMed PMID: 27464893; PMCID: PMC5274595.
(10) Pei M, Nguyen TD, Thimmappa ND, Salustri C, Dong F, Cooper MA, Li J, Prince MR, Wang Y. Algorithm for fast monoexponential fitting based on Auto-Regression on Linear Operations (ARLO) of data. Magn Reson Med. 2015;73(2):843-50. doi: 10.1002/mrm.25137. PubMed PMID: 24664497; PMCID: PMC4175304.
Figures
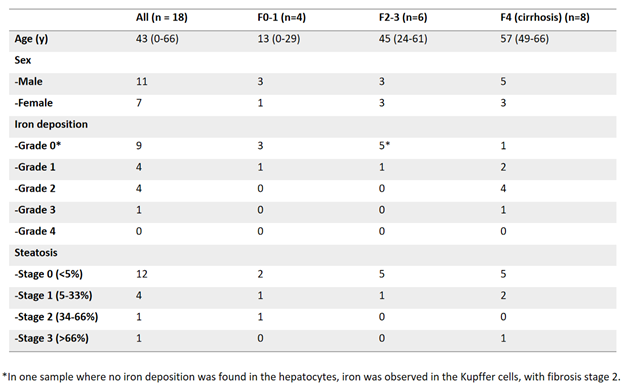
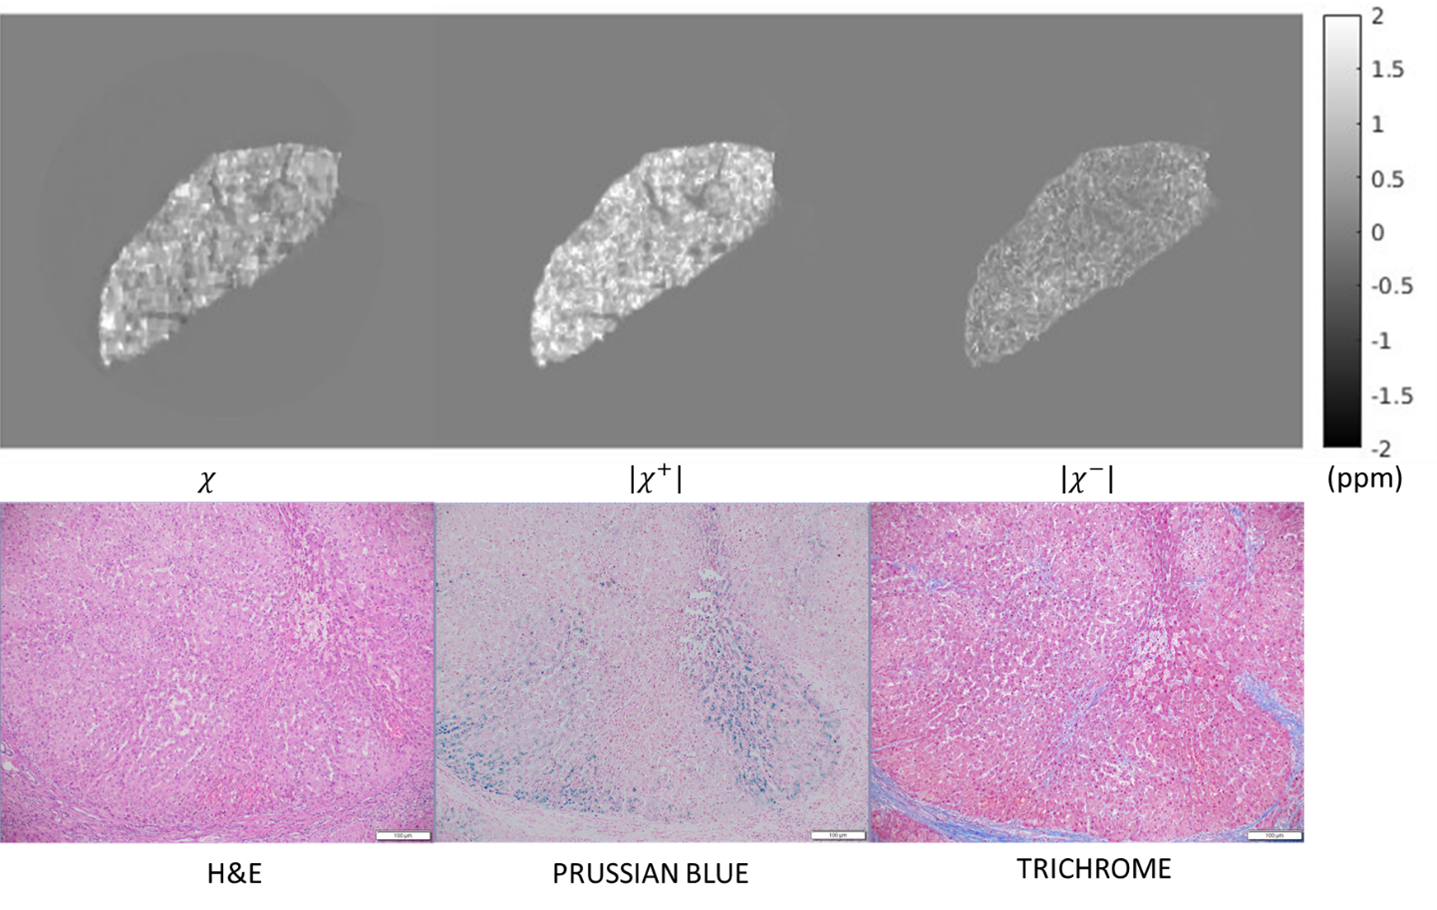
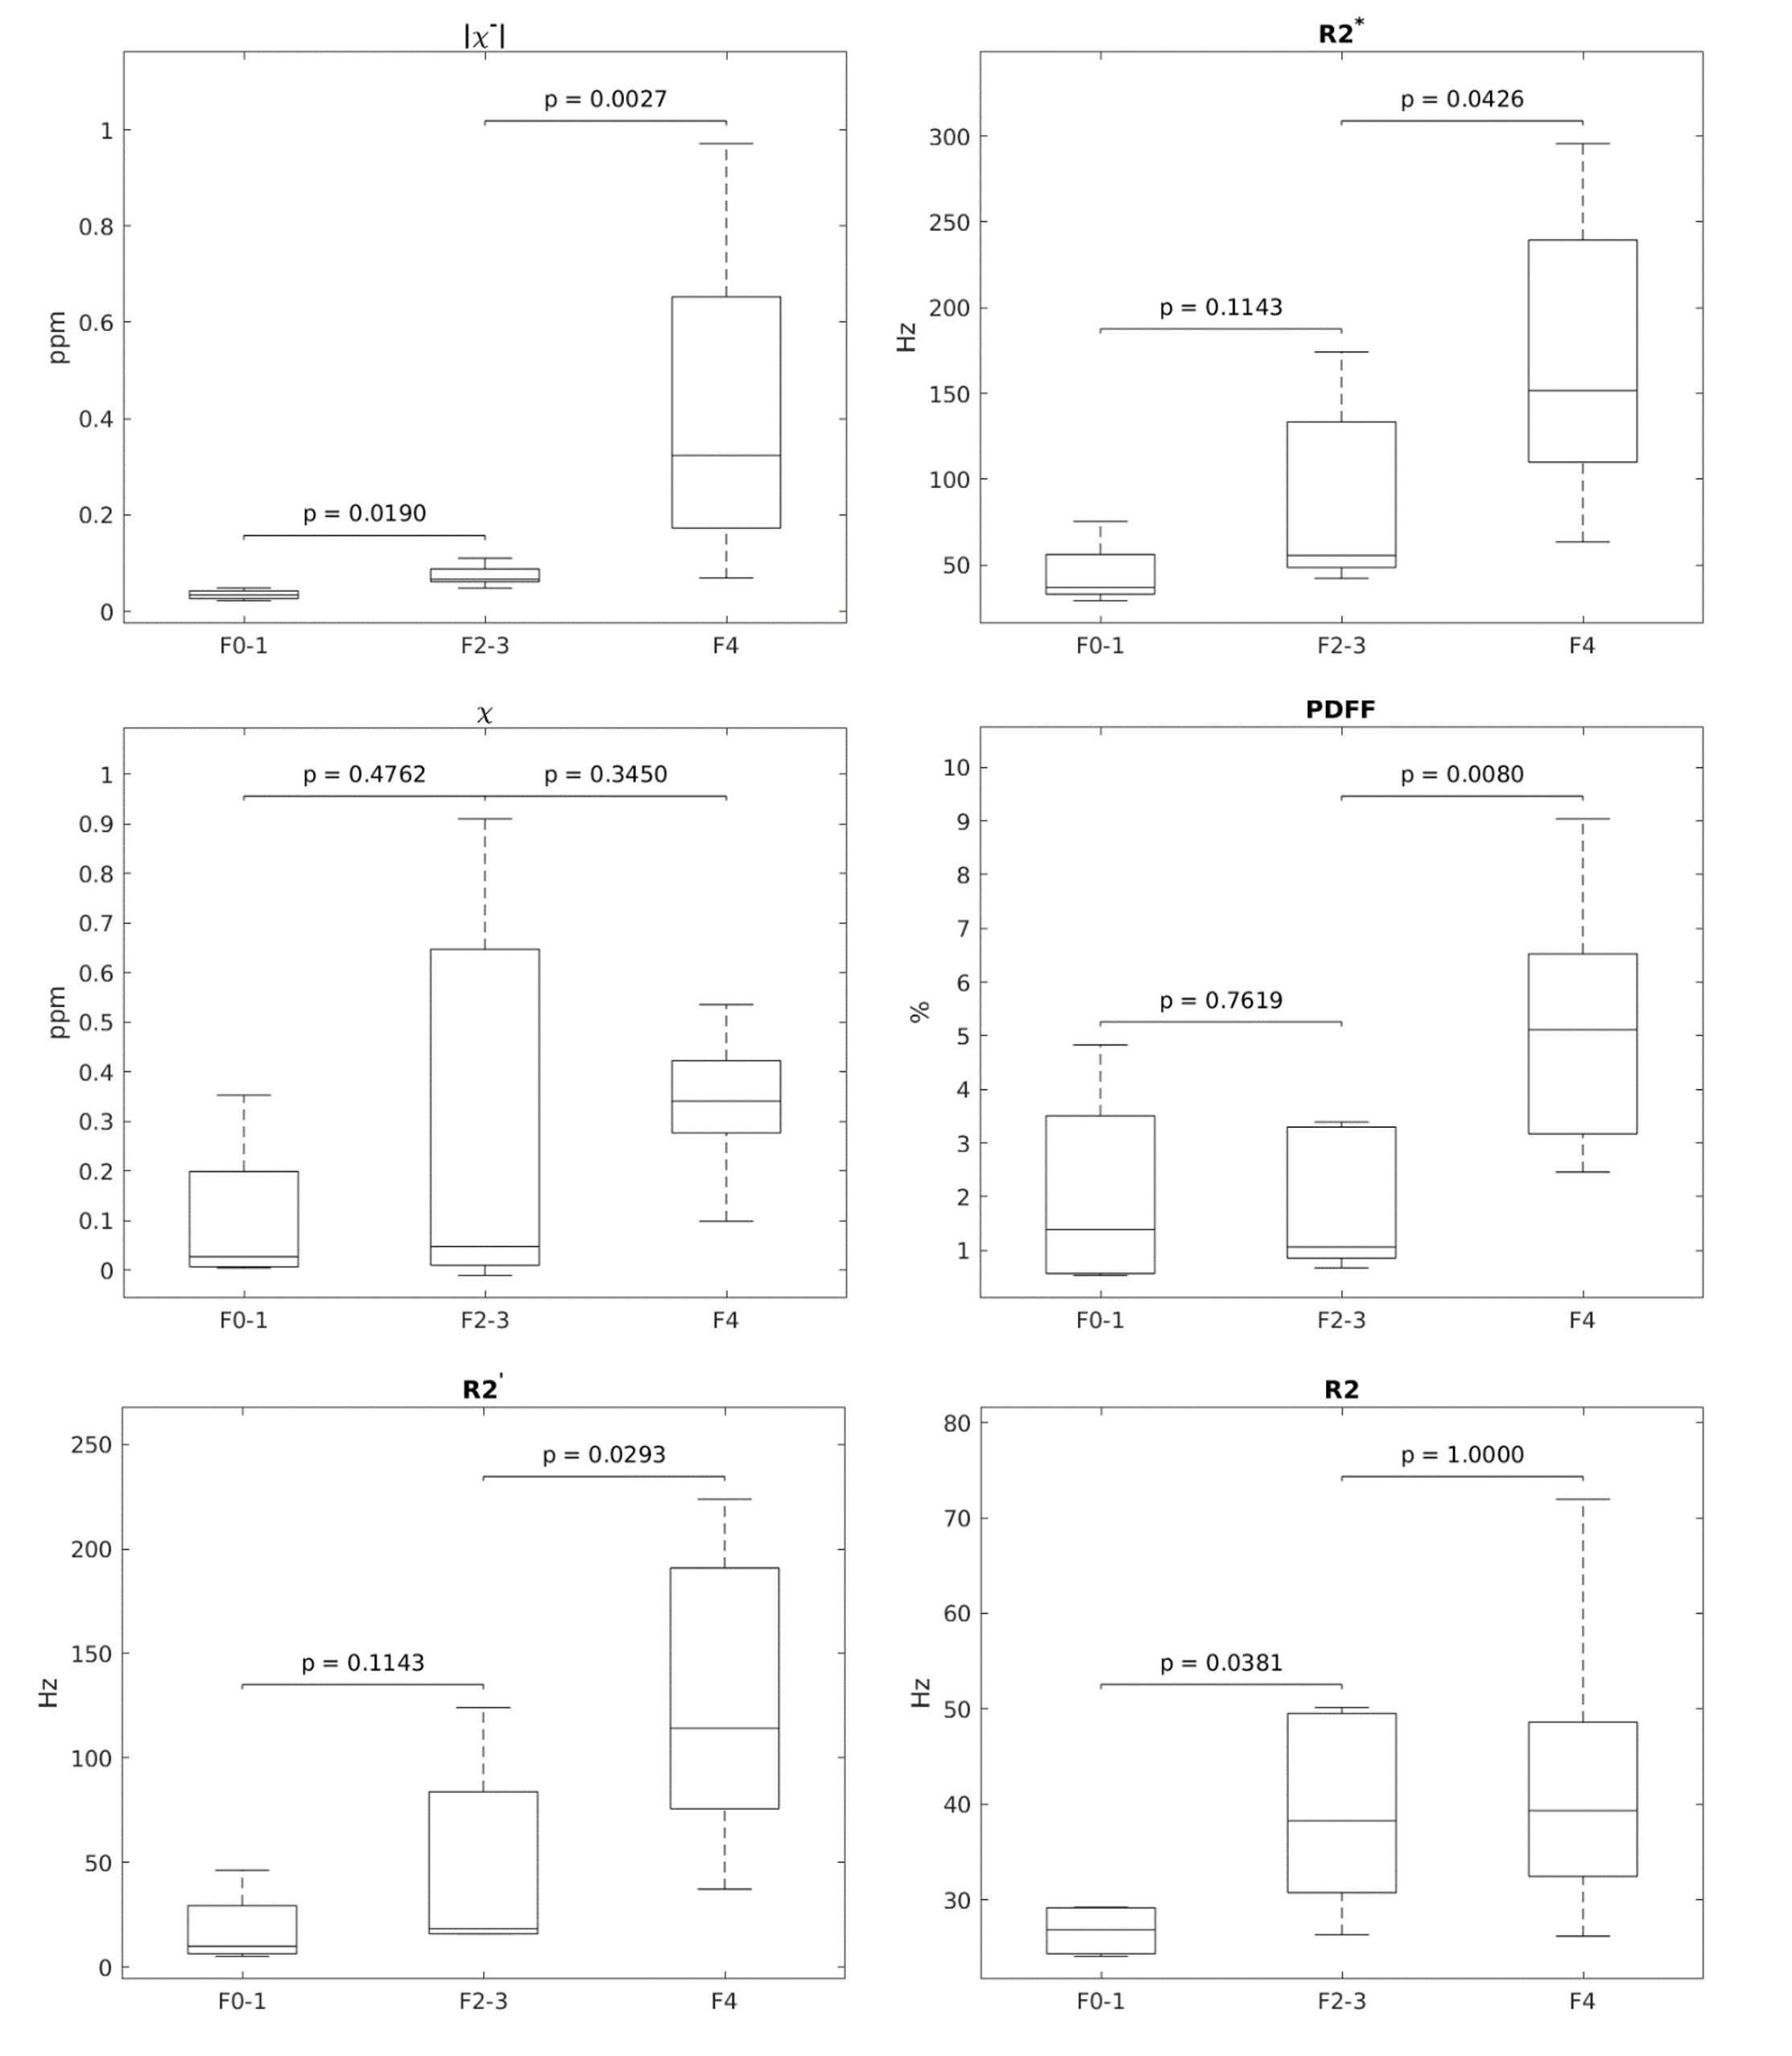
Figure 3: Boxplots of $$$|\chi^+-|$$$, R2*, $$$\chi$$$(QSM), PDFF, R2’ and R2 values in samples with no or mild fibrosis (F0-1), medium stage fibrosis (F2-3) and cirrhosis (F4). The P-value of a Mann–Whitney U test comparing the groups is displayed on top of the corresponding groups.