4626
What does liver R2* mean when iron levels are not elevated? Understanding the variation in R1 and R2* in the healthy liver1Perspectum, Oxford, United Kingdom
Synopsis
Keywords: Liver, Liver, T1, T2*, R1, R2*
Motivation: The influence of liver iron concentration (LIC) on liver R1 and R2* has been well described. However, in healthy subjects, R1 and R2* may be predominantly influenced by liver water content (LWC). The expected variability in R1 and R2* due to changes in LWC is not well understood.
Goal(s): Our goal was to model the expected variability in liver R1 and R2* due to changes in both LWC and LIC.
Approach: We developed a model, and tested the predictions against measured R1/R2* values in healthy subjects.
Results: The model predictions showed good agreement with the measured data in the majority of healthy subjects.
Impact: This work explains the variability in liver R1 and R2* due to changes in liver water content (LWC) and iron. This could aid our interpretation of changes in these parameters in subjects where LWC is clinically relevant.
Introduction
Liver iron concentration (LIC) has a strong influence on liver R1 and R2* in subjects with elevated iron1–4. However, R1 and R2* also depend on liver water content (LWC). We present a model to describe the dependency of R1 and R2* on LWC and LIC, and show how we can estimate the variability observed in R1 and R2* in representative healthy subjects.Methods
TheoryMeasured water R1 and R2* in the liver can be expressed as:
R1 = a1·LWC + b1·LIC + c1 (1)
R2* = a2·LWC + b2·LIC + c2 (2)
where the magnitude of the influence of LWC on R1 and R2* is represented by a1 and a2, and the magnitude of the influence of LIC on R1 and R2* is represented by b1 and b2 respectively (c1 and c2 are constants). The effect of fat on R1 and R2* was treated as negligible in this work.
For a constant LIC, changes in R1 and R2* as a result of changes in LWC can be expressed as:
a1 = δR1/δLWC, a2 = δR2*/δLWC (3)
and
δR2*/δR1 = a2/a1 (4).
Similarly, for a constant LWC:
b1 = δR1/δLIC, b2 = δR2*/δLIC (5)
and
δR2*/δR1 = b2/b1 (6).
R1 and R2 have been shown to be correlated5, and assuming a constant R2’, δR2=δR2*. As such, using the data in 5, we can estimate δR2*/δR1 in (4) as 37.1 at 3T. By applying a field strength conversion to R16 and R27, δR2*/δR1=18.2 at 1.5T.
At constant LWC, we can estimate b1 = 0.073 s-1/mgFe g-1 from 2, and b2 = 0.026-1 (1.5T) and 0.013-1 (3T) s-1/mgFe g-1 from 4. δR2*/δR1 in (6) can then be estimated as 527 (1.5T) and 1054 (3T).
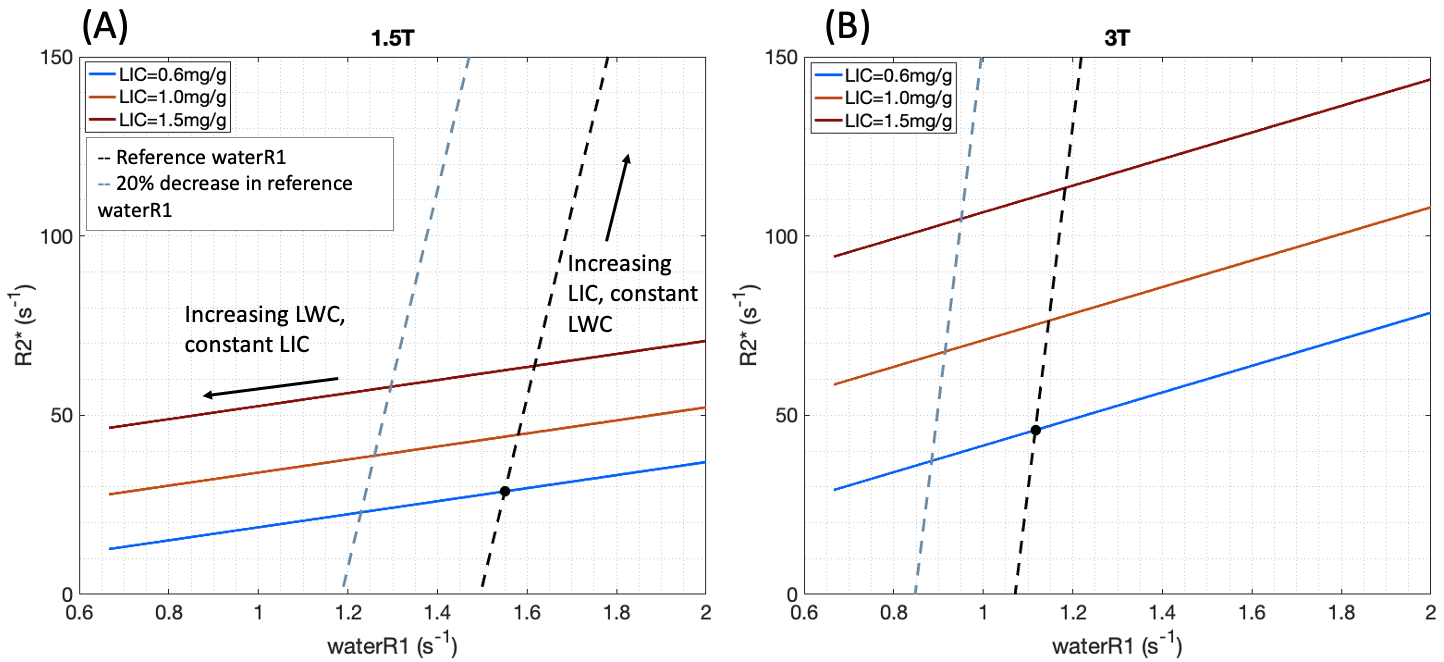
Figure 1 illustrates the relationship between water R1 and R2*, due to changes in LWC and LIC. At 1.5T, initial reference values for R1 = 1.6s-1 8 and R2* = 28.8s-1 9 were used (estimated LIC = 0.6 mg Fe/g4). For the same LIC, a 3T reference R2* of 45.8 s-1 was estimated4, and field strength conversion6 was applied to estimate R1=1.1s-1 at 3T.
Experiments
39 healthy subjects were scanned either on a GE 1.5T scanner (N=20), GE 3T (N=18), or at both field strengths (N=1). The imaging protocol included a fat-suppressed inversion-recovery fast spin echo (FSE) single-shot sequence, acquired with 3 inversion times of 50ms/75ms (1.5/3T), 800ms, and 1200ms, and an additional scan without the inversion pre-pulse. Additional sequences included 2D multi-echo SGRE protocols for calculation of T2* and proton density fat fraction (PDFF) maps10, as implemented in the FDA-cleared LiverMultiScan-v5 medical device.
Water T1 maps were generated by fitting the FSE signal to an inversion recovery model11 S(t) = A-B· e-t/T1, with A, B and T1 as fitted parameters. Representative water R1, R2* and PDFF values for each subject were obtained by calculating the pooled median over 3 circular ROIs (15mm diameter) placed within the liver on each parameter map, avoiding vessels. Subjects with PDFF>10% were excluded, to minimise the impact of fat on R2*.
Results
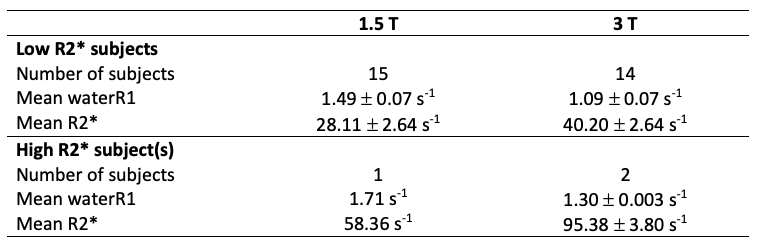
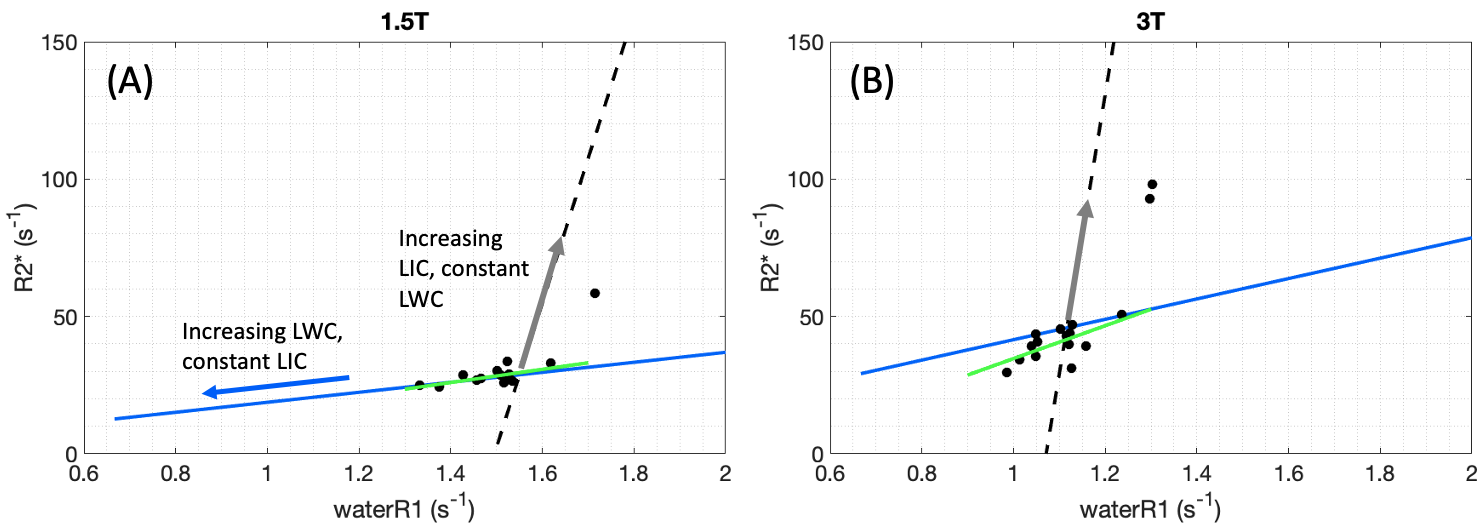
32/40 subjects had PDFF<10%. At 1.5T, one subject had a significantly elevated R2* value (Table 1, p<0.0001, one-sample t test), and at 3T, two subjects had significantly elevated R2* values (p<0.0001).Measured R1 and R2* values are shown in Figure 2. The predicted relationships between R1 and R2* are also shown, based on the reference values (see Methods). At 3T, the majority of our healthy subjects, excluding the high-R2* outliers, had a lower R2* (40.2 s-1) than the reference value (46.5 s-1), suggesting a lower LIC in our healthy subjects.
In the low R2* subjects, a linear fit to the measured data gave the following regression coefficients: 1.5T: δR2*/δR1 = 23.9±8.0 (mean±SE, r2=0.41), 3T: δR2*/δR1 = 59.9±20.3 (r2=0.42). The predicted values from (4) (18.2 at 1.5T, 37.1 at 3T) agreed with the measured values within one standard error at 1.5T, and within the 95% CI at 3T.
The 3 subjects with higher R2* are likely to have comparatively elevated LIC, which was estimated4 as 1.3mg/g (1.5T subject) and 1.4mg/g (3T subjects). In these subjects we observed a steep change in R2* relative to a small change in water R1, which agrees with the expected behaviour when δR2*/δR1 reflects changes in LIC (grey arrows in Figure 2).
Discussion
In subjects with a low R2*, we showed that the relationship between measured R1 and R2* follows the pattern predicted when changes in water R1 and R2* are primarily influenced by LWC. In these subjects, variability in water R1 should not be misinterpreted as variability in LIC.Acknowledgements
No acknowledgement found.References
1. Wood, J. C. et al. Cardiac Iron Determines Cardiac T2*, T2, and T1 in the Gerbil Model of Iron Cardiomyopathy. Circulation 112, 535–543 (2005).
2. Wood, J. C. et al. MRI R2 and R2* mapping accurately estimates hepatic iron concentration in transfusion-dependent thalassemia and sickle cell disease patients. Blood 106, 1460–1465 (2005).
3. Ghugre, N. R., Coates, T. D., Nelson, M. D. & Wood, J. C. Mechanisms of tissue–iron relaxivity: Nuclear magnetic resonance studies of human liver biopsy specimens. Magn. Reson. Med. 54, 1185–1193 (2005).
4. Hernando, D. et al. Multicenter Reproducibility of Liver Iron Quantification with 1.5-T and 3.0-T MRI. Radiology 306, e213256 (2023).
5. Hamilton, G., Schlein, A., Middleton, M., Loomba, R. & Sirlin, C. Relation between T1 and T2 of liver water and fat and Proton Density Fat Fraction estimated by a flip angle corrected multi-TR, multi-TE single breath-hold 1H MRS STEAM sequence. in Proc. Intl. Soc. Mag. Reson. Med. (2019).
6. de Bazelaire, C. M. J., Duhamel, G. D., Rofsky, N. M. & Alsop, D. C. MR imaging relaxation times of abdominal and pelvic tissues measured in vivo at 3.0 T: preliminary results. Radiology 230, 652–659 (2004).
7. Ghugre, N. et al. Multi-field behavior of Relaxivity in an Iron-rich environment. in Proc. Intl. Soc. Mag. Reson. Med. (2008).
8. Sharma, P., Kitajima, H., Zhong, X., Kalb, B. & Martin, D. Compartmental Analysis of R2 measurements of Hepatic Lipid and Iron In Vivo using Breath-hold Multi-Echo 1H Spectroscopy (HISTO). in Proc. Intl. Soc. Mag. Reson. Med. 19 (2011).
9. Obrzut, M. et al. Value of liver iron concentration in healthy volunteers assessed by MRI. Sci. Rep. 10, 17887 (2020).
10. Banerjee, R. et al. Multiparametric magnetic resonance for the non-invasive diagnosis of liver disease. J. Hepatol. 60, 69–77 (2014).
11. Taylor, A. J., Salerno, M., Dharmakumar, R. & Jerosch-Herold, M. T1 Mapping: Basic Techniques and Clinical Applications. JACC Cardiovasc. Imaging 9, 67–81 (2016).
12. Alam, M. H. et al. Comparison of 3 T and 1.5 T for T2* magnetic resonance of tissue iron. J. Cardiovasc. Magn. Reson. 18, 40 (2016).
Figures