4624
Test-Retest Reliability, Agreement, and Bias of Deep Learning Based Reconstructions for PDFF and R2* Quantification1Canon Medical Systems USA, Inc., Tustin, CA, United States, 2Radiology, University of Wisconsin-Madison, Madison, WI, United States, 3Radiology, University of California San Diego, San Diego, CA, United States, 4Medical Physics, University of Wisconsin-Madison, Madison, WI, United States, 5Biomedical Engineering, University of Wisconsin-Madison, Madison, WI, United States, 6Medicine, University of Wisconsin-Madison, Madison, WI, United States, 7Emergency Medicine, University of Wisconsin-Madison, Madison, WI, United States, 8Calimetrix, Madison, WI, United States
Synopsis
Keywords: Liver, Body
Motivation: Deep Learning Reconstruction (DLR) has been used routinely in clinical setting for qualitative weighted images. It is imperative to evaluate DLR for quantitative imaging prior to widespread clinical adoption.
Goal(s): To assess the test-retest reliability of PDFF and R2* values calculated from DL-reconstructed images compared to those from the conventional reconstruction (CONV).
Approach: A commercial PDFF/R2* phantom was imaged twice, with repositioning between acquisitions. Each scan was reconstructed with CONV and DLRs, which were used to calculate PDFF and R2* maps.
Results: Excellent test-retest reliability for all three reconstructions with R2>0.99 and minimal bias (<0.58% for PDFF and <3.67 s-1 for R2*).
Impact: SNR, resolution, and scan-time of quantitative MRI may benefit from DLR similarly as for qualitative MRI. This study showed that DLR has excellent test-retest reliability for PDFF/R2* quantification with minimal bias, providing foundational evidence for wider clinical adoption.
Introduction
Deep Learning Reconstruction (DLR) has been routinely used in the clinic providing improved image quality, SNR, resolution, and scan-time compared to conventional reconstruction (CONV)1–4. However, rigorous assessment of DLR for quantitative imaging is needed prior to widespread clinical adoption. This study will assess quantitative PDFF and R2* test-retest reliability of CONV and two DLR methods: Deep Learning-based Denoising Reconstruction (DL-DR) and Deep Learning-based Super-resolution Reconstruction (DL-SR).Methods
PDFF/R2* Phantom:A commercial PDFF/R2* phantom (Calimetrix, Madison, WI) includes 16 cylindrical 20 mL vials, covering a 4x4 grid of PDFF-R2* values (Figure 1)5. Each vial contains an agarose-based emulsion with a unique combination of PDFF (range 0-30%, modulated using peanut oil) and R2* values (range 50-600s-1, modulated using superparamagnetic iron-oxide particles (COMPEL, Bangs Labs, Fishers, IN)). The vials are placed in a spherical housing containing a doped water bath, to optimize B0 homogeneity and image quality.
Data Collection:
The PDFF/R2* phantom was scanned at 3T using the QIBA-recommended chemical shift encoded protocol (Figure 1). This acquisition was performed twice (test-retest) with repositioning and repeated localization to evaluate test-retest reliability. Each acquisition was reconstructed with all three reconstructions (CONV, DL-DR, and DL-SR).
Data Analysis:
PDFF and R2* from each reconstruction were measured and compared using regions of interest (ROIs) placed on each of the 16 vials. Linear regression was used to assess test-retest reliability while Bland-Altman and Lin’s concordance correlation coefficient were used to assess test-retest agreement as recommended by Berchtold et al.6 In addition to assessment of test-retest reliability, PDFF and R2* values measured from CONV were compared against those provided by the phantom manufacture (REF i.e., nominal values), and those from DL-DR and DL-SR.
Quantitative metrics such as structure similarity index measure (SSIM), peak signal-to-noise ratio (PSNR), and normalized root-mean-square error (NRMSE) were also calculated between PDFF and R2* maps within ROIs of CONV vs. DL-DR and vs. DL-SR.
Results and Discussion
Figures 2 and 3 show calculated PDFF and R2* maps, respectively, from test (top row) and retest (bottom row) scans. Quantitative metrics (SSIM, PSNR, NRMSE) are listed on the second and third columns showing high similarities (SSIM > 0.93 for PDFF and SSIM > 0.99 for R2*) between PDFF and R2* measures from CONV vs. those from DL-DR and DL-SR.Bland-Altman plots seen in Figure 4 show strong agreement between CONV vs. REF (first column), CONV vs. DL-DR (second column), and CONV vs. DL-SR (third column). As expected based on previous study5, larger R2* and PDFF differences are seen associated with vials 8, 12, and 16 with higher combination of nominal R2* of 600 s-1 and PDFF values of 10, 20, 30 %. Lin’s concordance correlation coefficients were larger than 0.99 in all three comparisons. From linear regression analysis, CONV was highly correlated with REF, DL-DR, and DL-SR with R2 > 0.99 for all comparisons.
Figure 5 shows test-retest agreement and test-rest reliability for all three reconstructions with R2 > 0.996 and biases less than 0.58% for PDFF and less than 3.67 s-1 for R2*. Lin’s concordance correlation coefficients were all larger than 0.99 for both PDFF and R2* measurements for all three reconstructions (CONV, DL-DR, and DL-SR).
Conclusion
This study demonstrated that Deep Learning-based Denoising Reconstruction and Deep Learning-based Super-resolution Reconstruction have excellent agreement with conventional reconstruction and excellent test-retest reliabilities and test-retest agreement for quantitative PDFF and R2* measurements over a range of PDFF and R2* values highly relevant to liver imaging in the presence of steatosis and iron overload. Evaluation on patient cohort warrants future studies.Acknowledgements
No acknowledgement found.References
[1] R. M. Lebel, “Performance characterization of a novel deep learning-based MR image reconstruction pipeline,” ArXiv200806559 Cs Eess, Aug. 2020, Accessed: Sep. 28, 2021. [Online]. Available: http://arxiv.org/abs/2008.06559
[2] M. Kidoh et al., “Deep Learning Based Noise Reduction for Brain MR Imaging: Tests on Phantoms and Healthy Volunteers,” Magn. Reson. Med. Sci., vol. 19, no. 3, pp. 195–206, 2020, doi: 10.2463/mrms.mp.2019-0018.
[3] A. S. Chaudhari et al., “Super-resolution musculoskeletal MRI using deep learning,” Magn. Reson. Med., vol. 80, no. 5, pp. 2139–2154, 2018, doi: 10.1002/mrm.27178.
[4] M. L. De Leeuw Den Bouter, G. Ippolito, T. P. A. O’Reilly, R. F. Remis, M. B. Van Gijzen, and A. G. Webb, “Deep learning-based single image super-resolution for low-field MR brain images,” Sci. Rep., vol. 12, no. 1, p. 6362, Apr. 2022, doi: 10.1038/s41598-022-10298-6.
[5] J. Starekova1, “Multi-center, multi-vendor validation of PDFF-R2* mapping in an Optimized Fat-Iron Phantom,” in Proc. Intl. Soc. Mag. Reson. Med. 31 (2023), Toronto, Canada, Jun. 2023, p. 1052.
[6] A. Berchtold, “Test–retest: Agreement or reliability?,” Methodol. Innov., vol. 9, p. 2059799116672875, Jan. 2016, doi: 10.1177/2059799116672875.
Figures
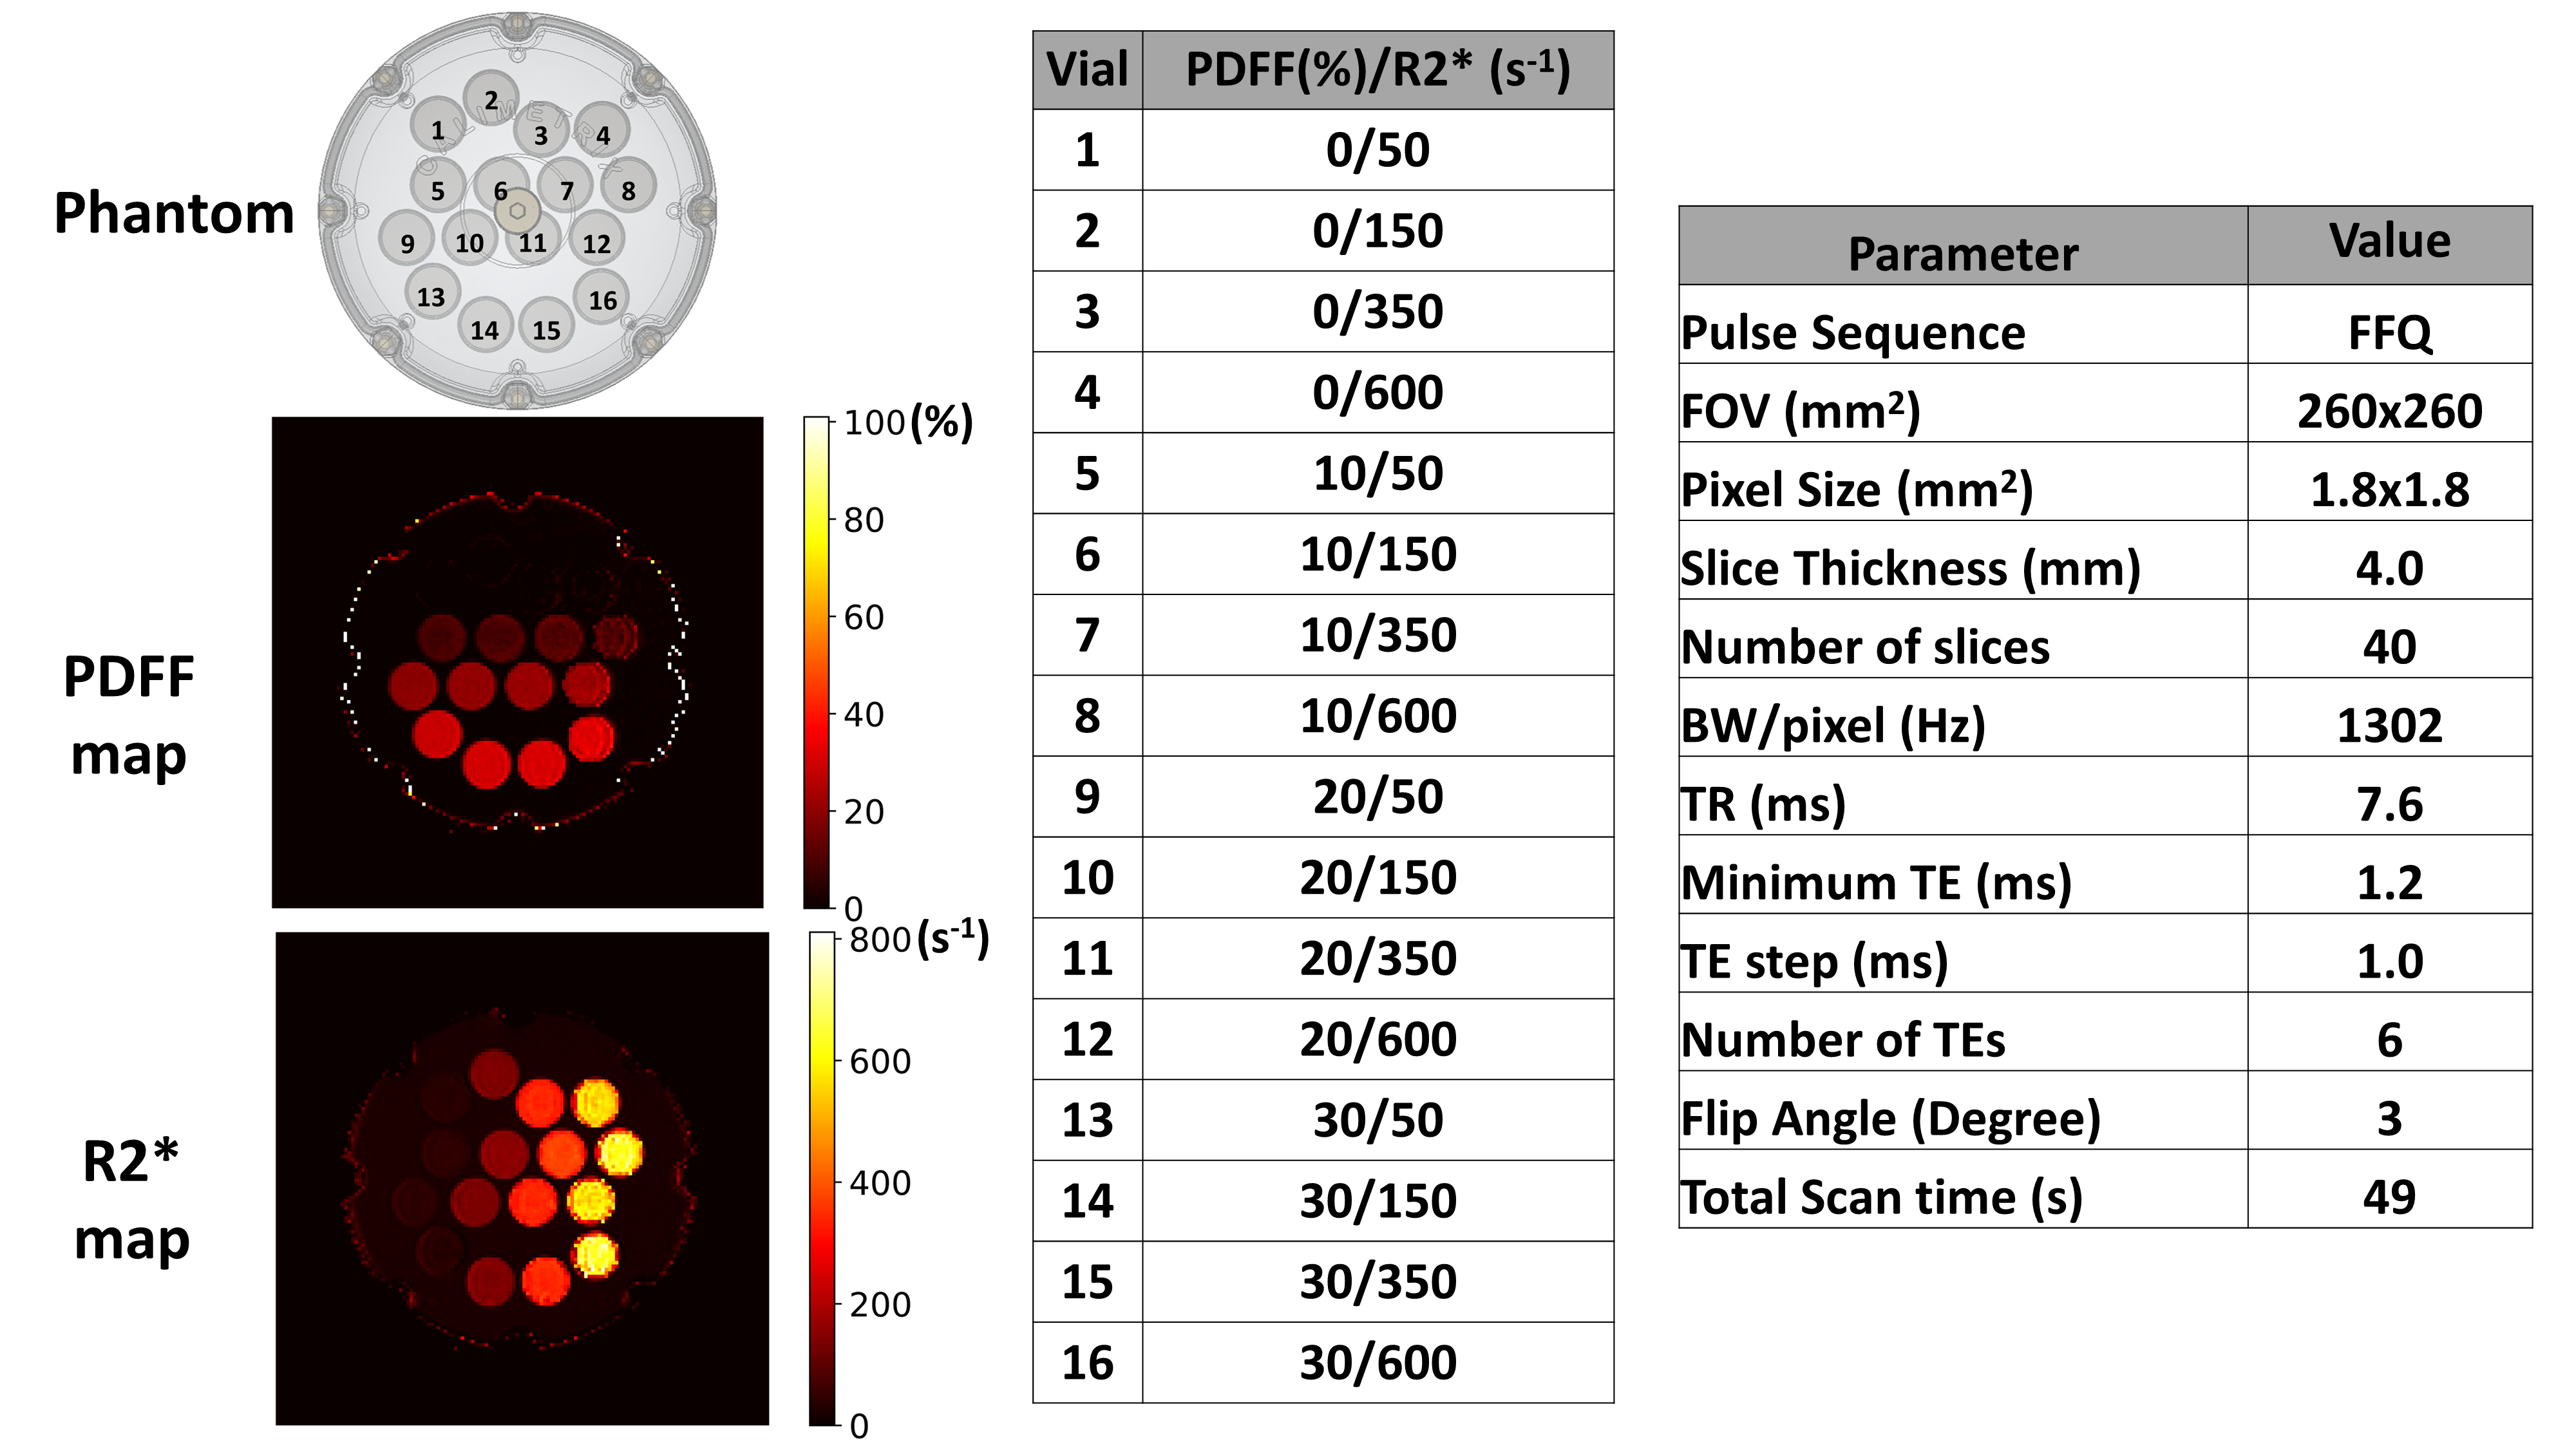
Figure 1: Description of the PDFF/R2* phantom and the PDFF/R2* scan protocol.
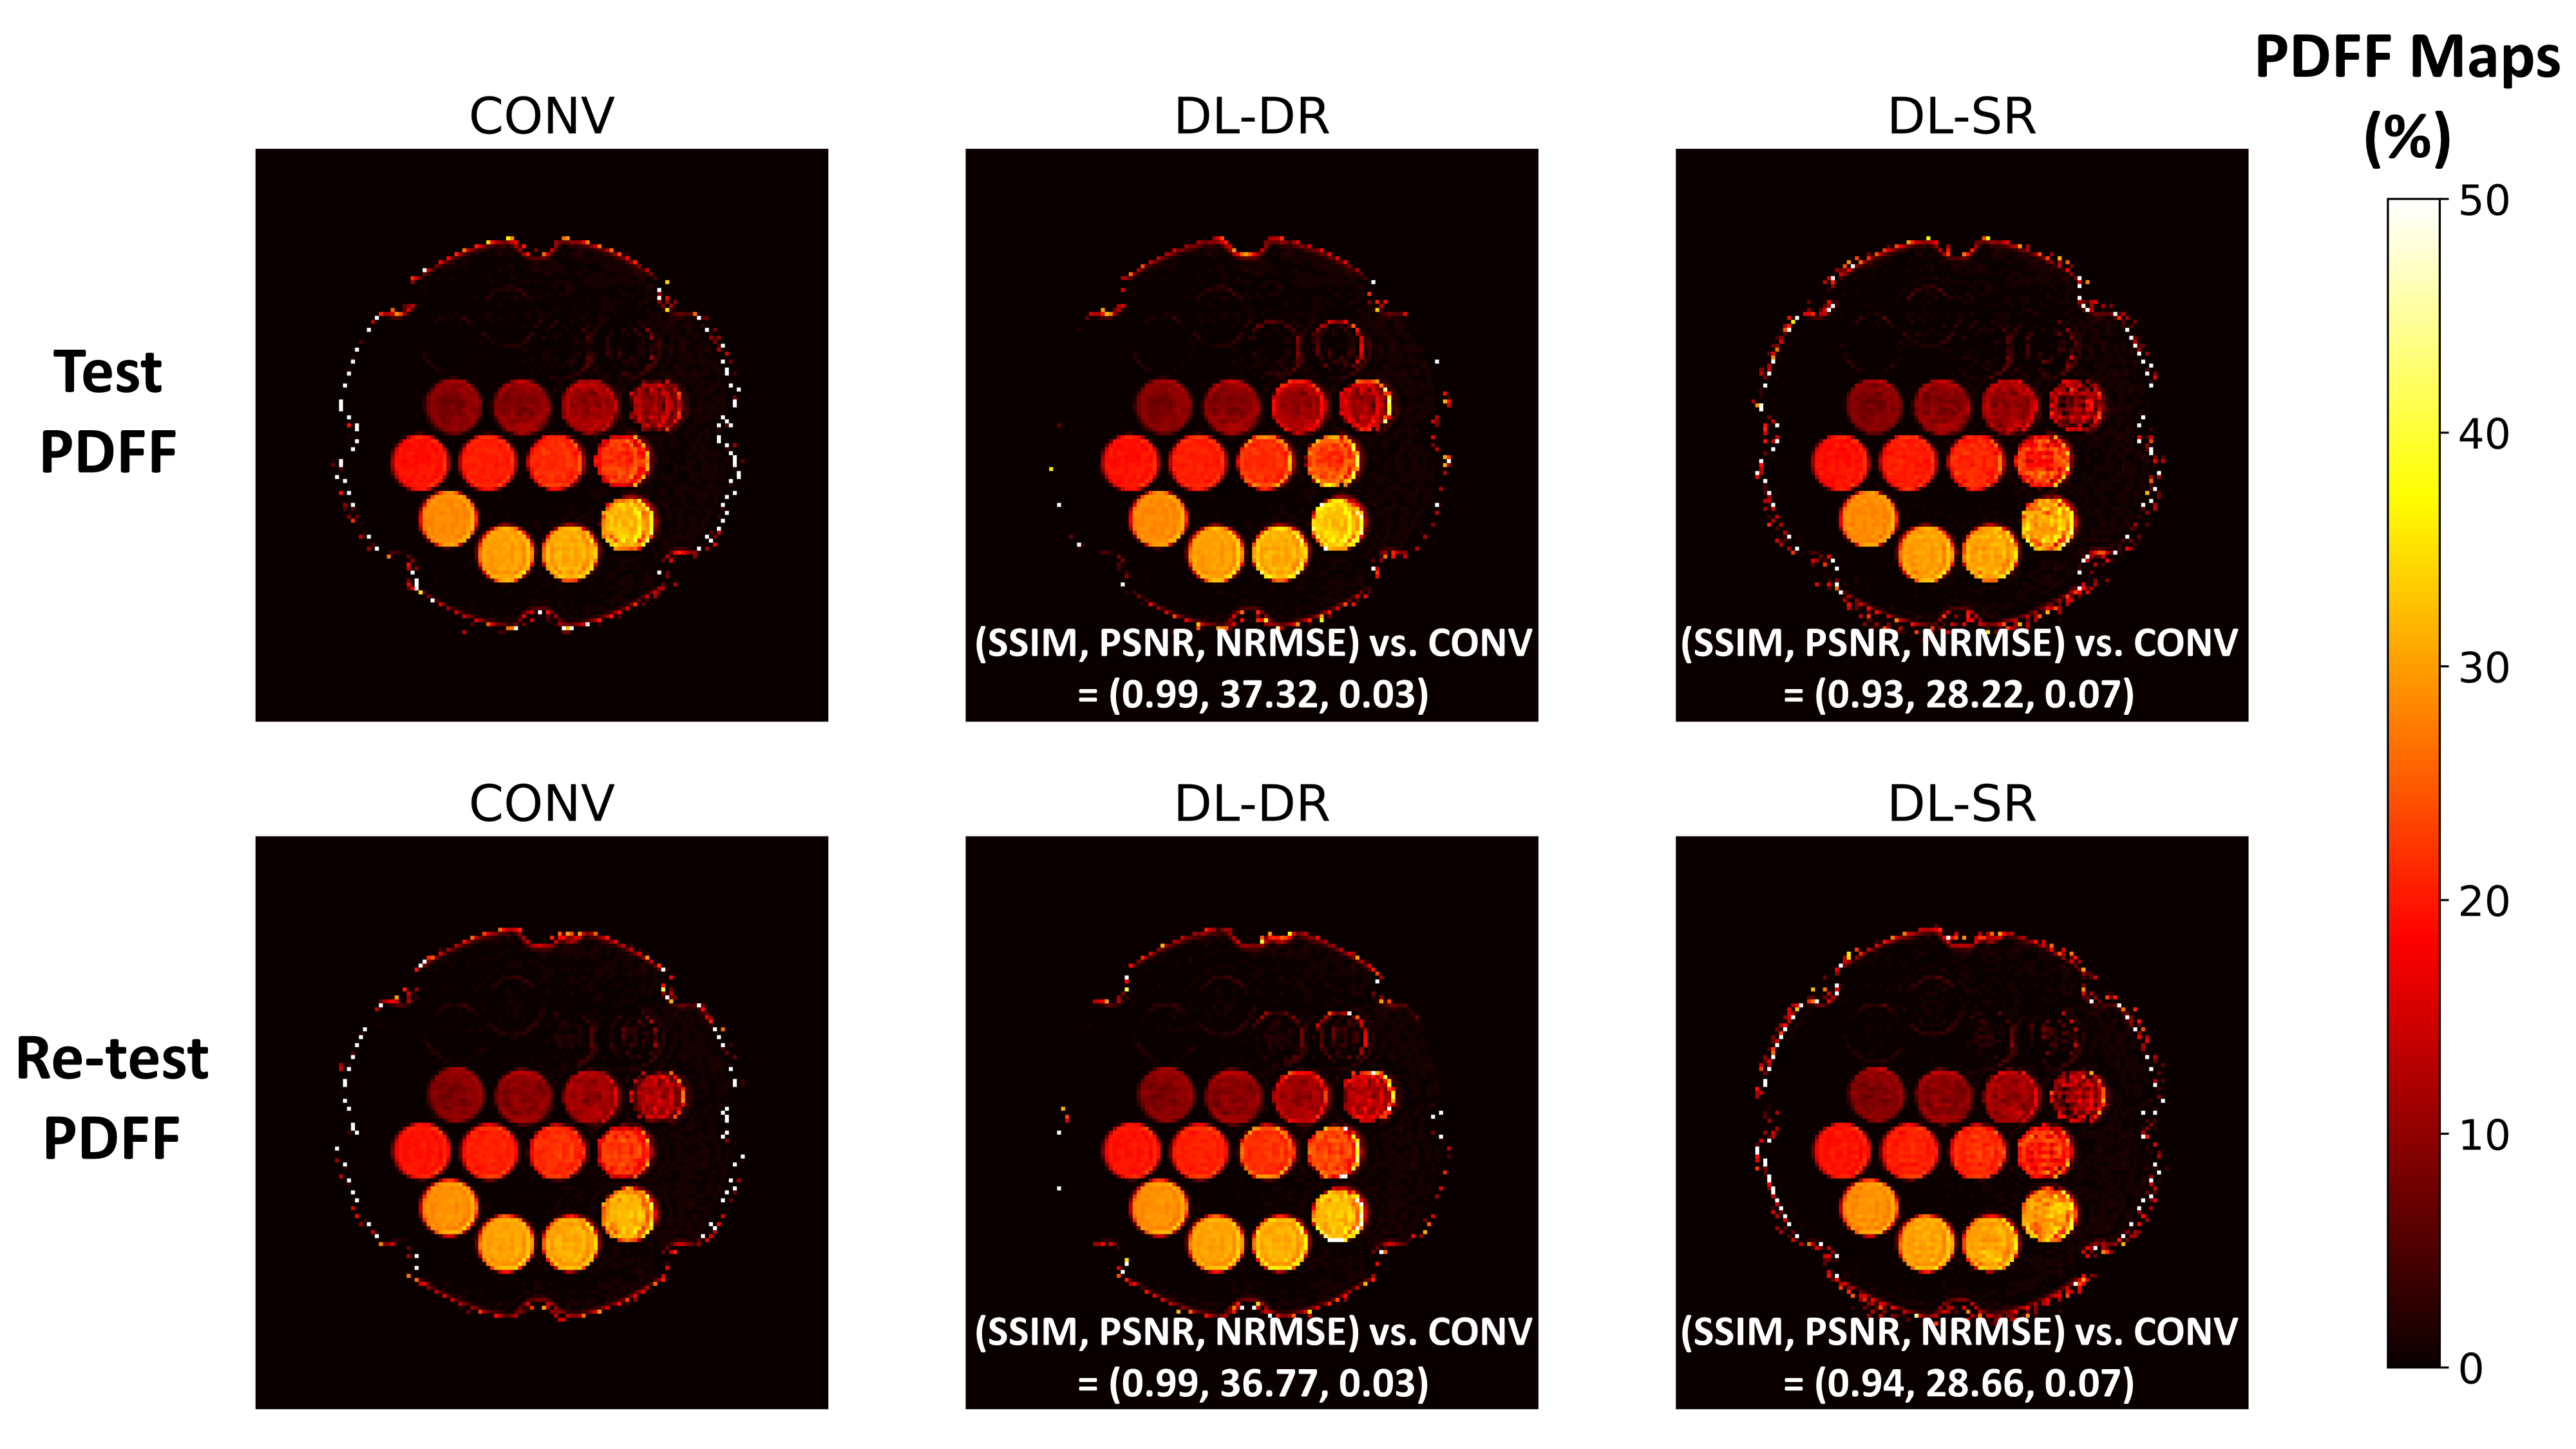
Figure 2: Test (top row) and retest (bottom row) PDFF maps reconstructed from CONV (first column), DL-DR (second column), and DL-SR (third column). Quantitative SSIM, PSNR, and NRMSE metrics w.r.t. the CONV are listed on the second (DL-DR) and third (DL-SR) maps. High similarities (SSIM > 0.93) are observed between CONV and DLRs for PDFF measures.
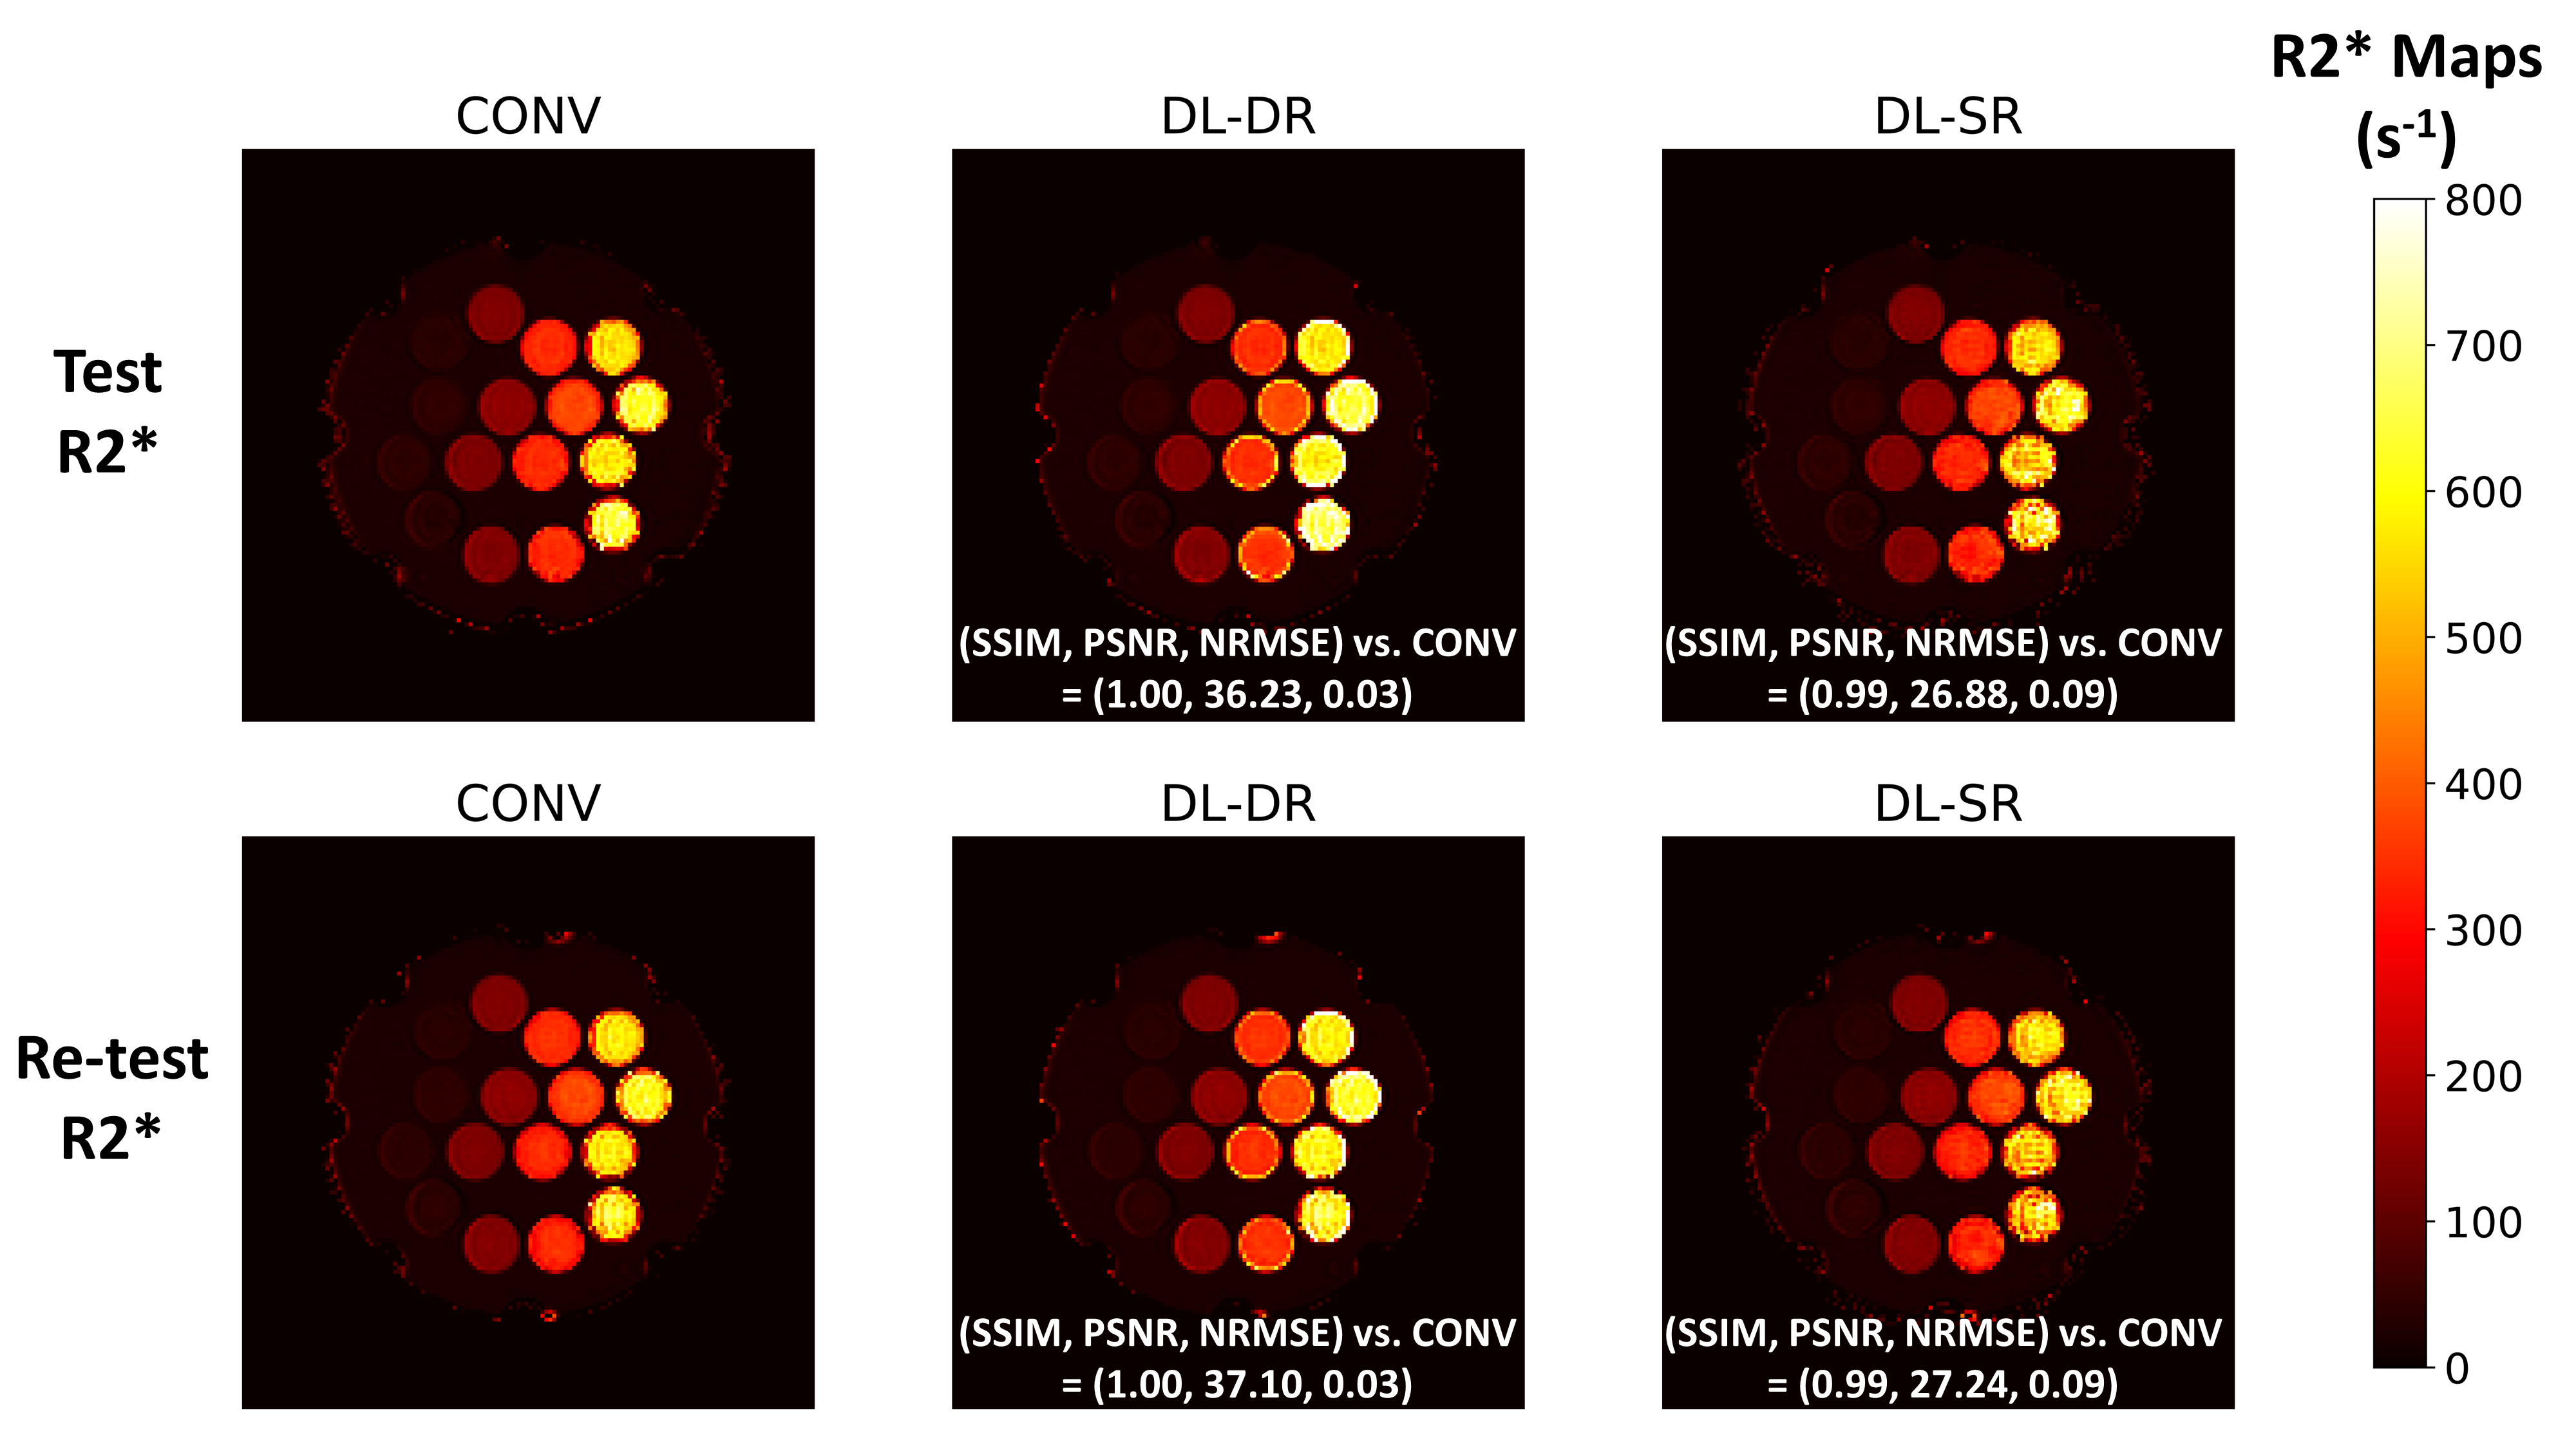
Figure 3: Test (top row) and retest (bottom row) R2* maps reconstructed from CONV (first column), DL-DR (second column), and DL-SR (third column). Quantitative SSIM, PSNR, and NRMSE metrics w.r.t. the CONV are listed on the second (DL-DR) and third (DL-SR) maps. High similarities (SSIM > 0.99) are observed between CONV and DLRs for R2* measures.
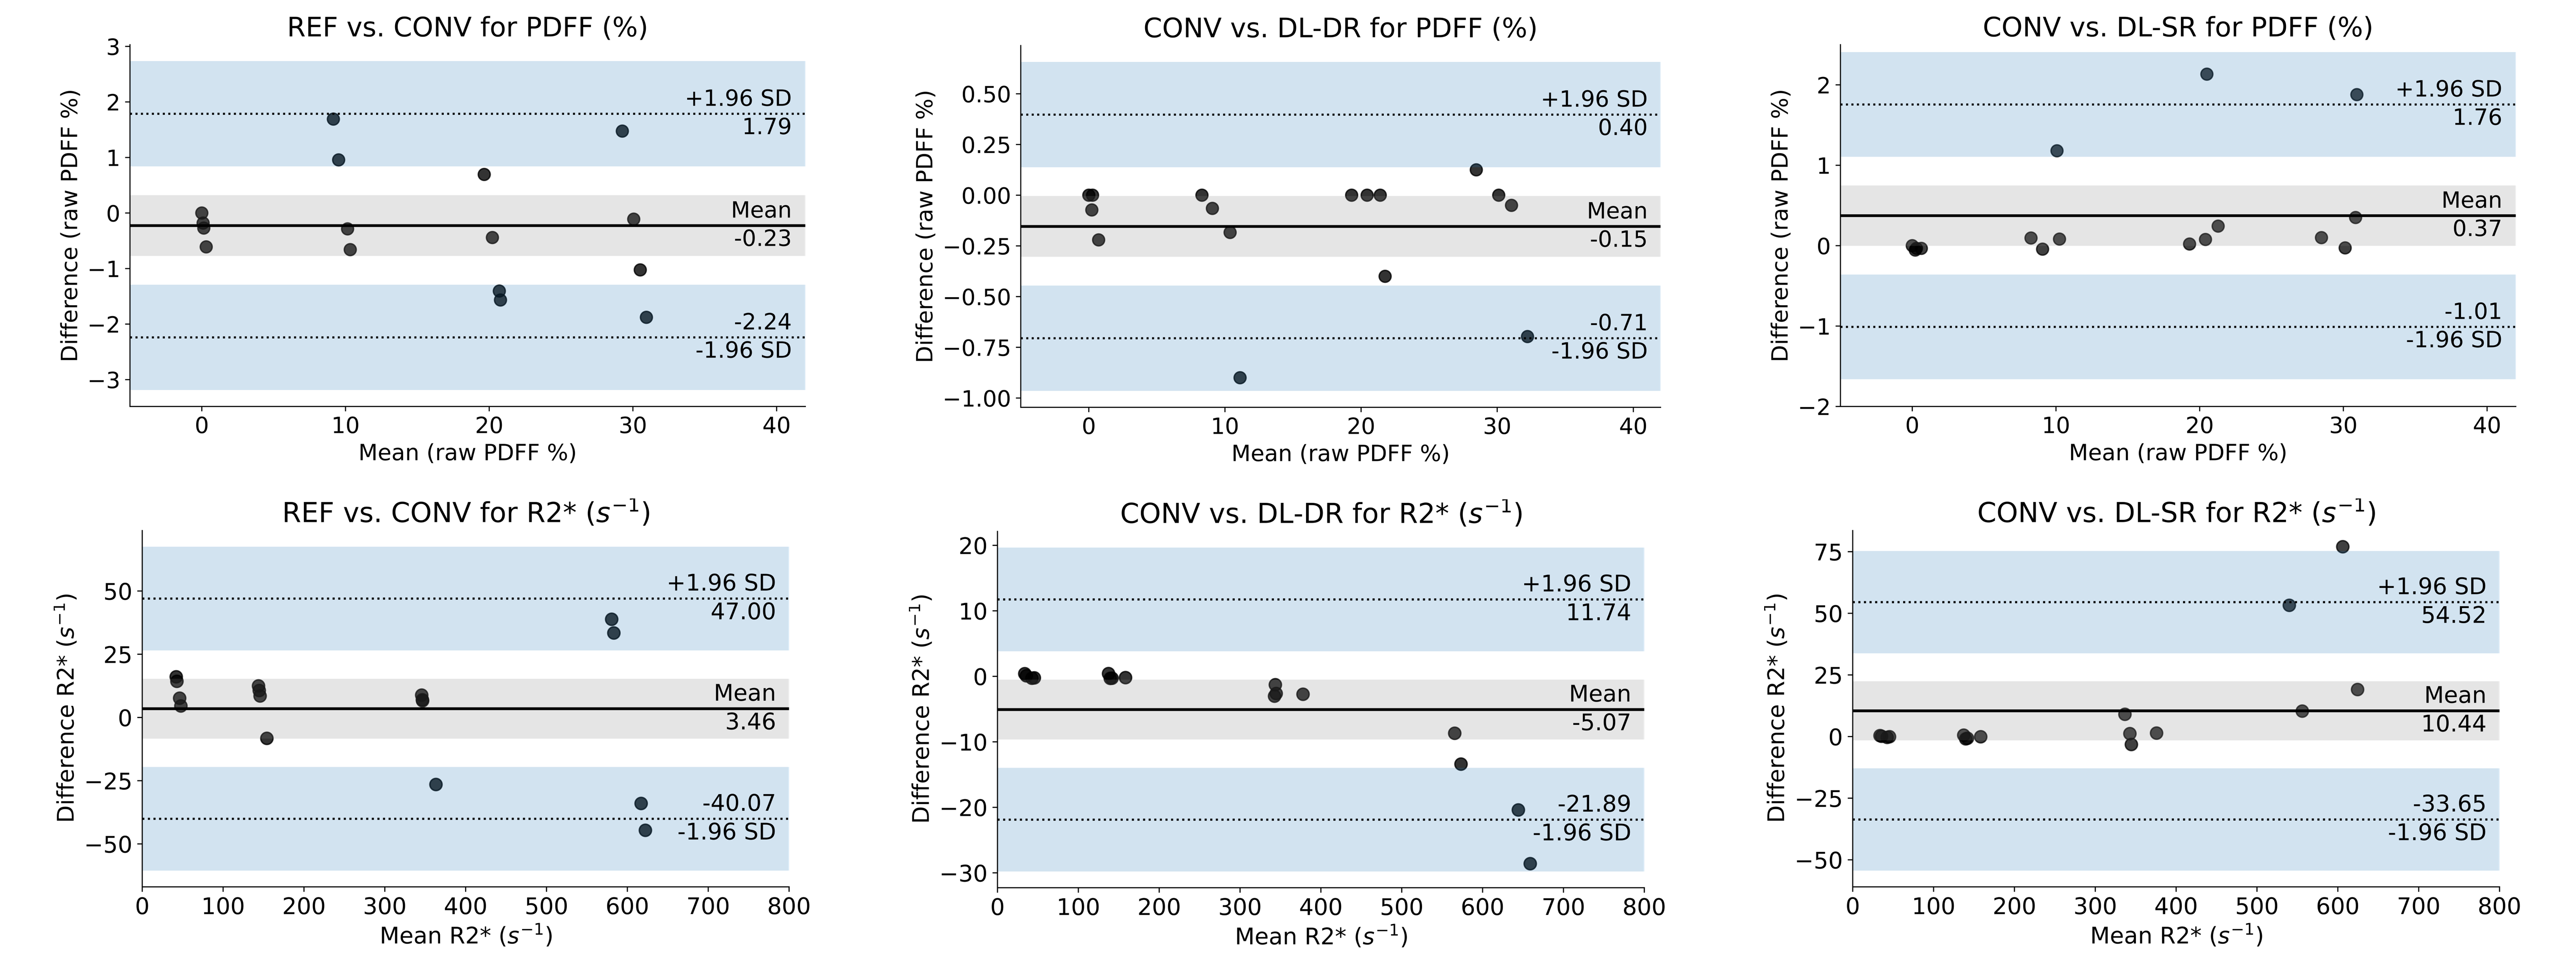
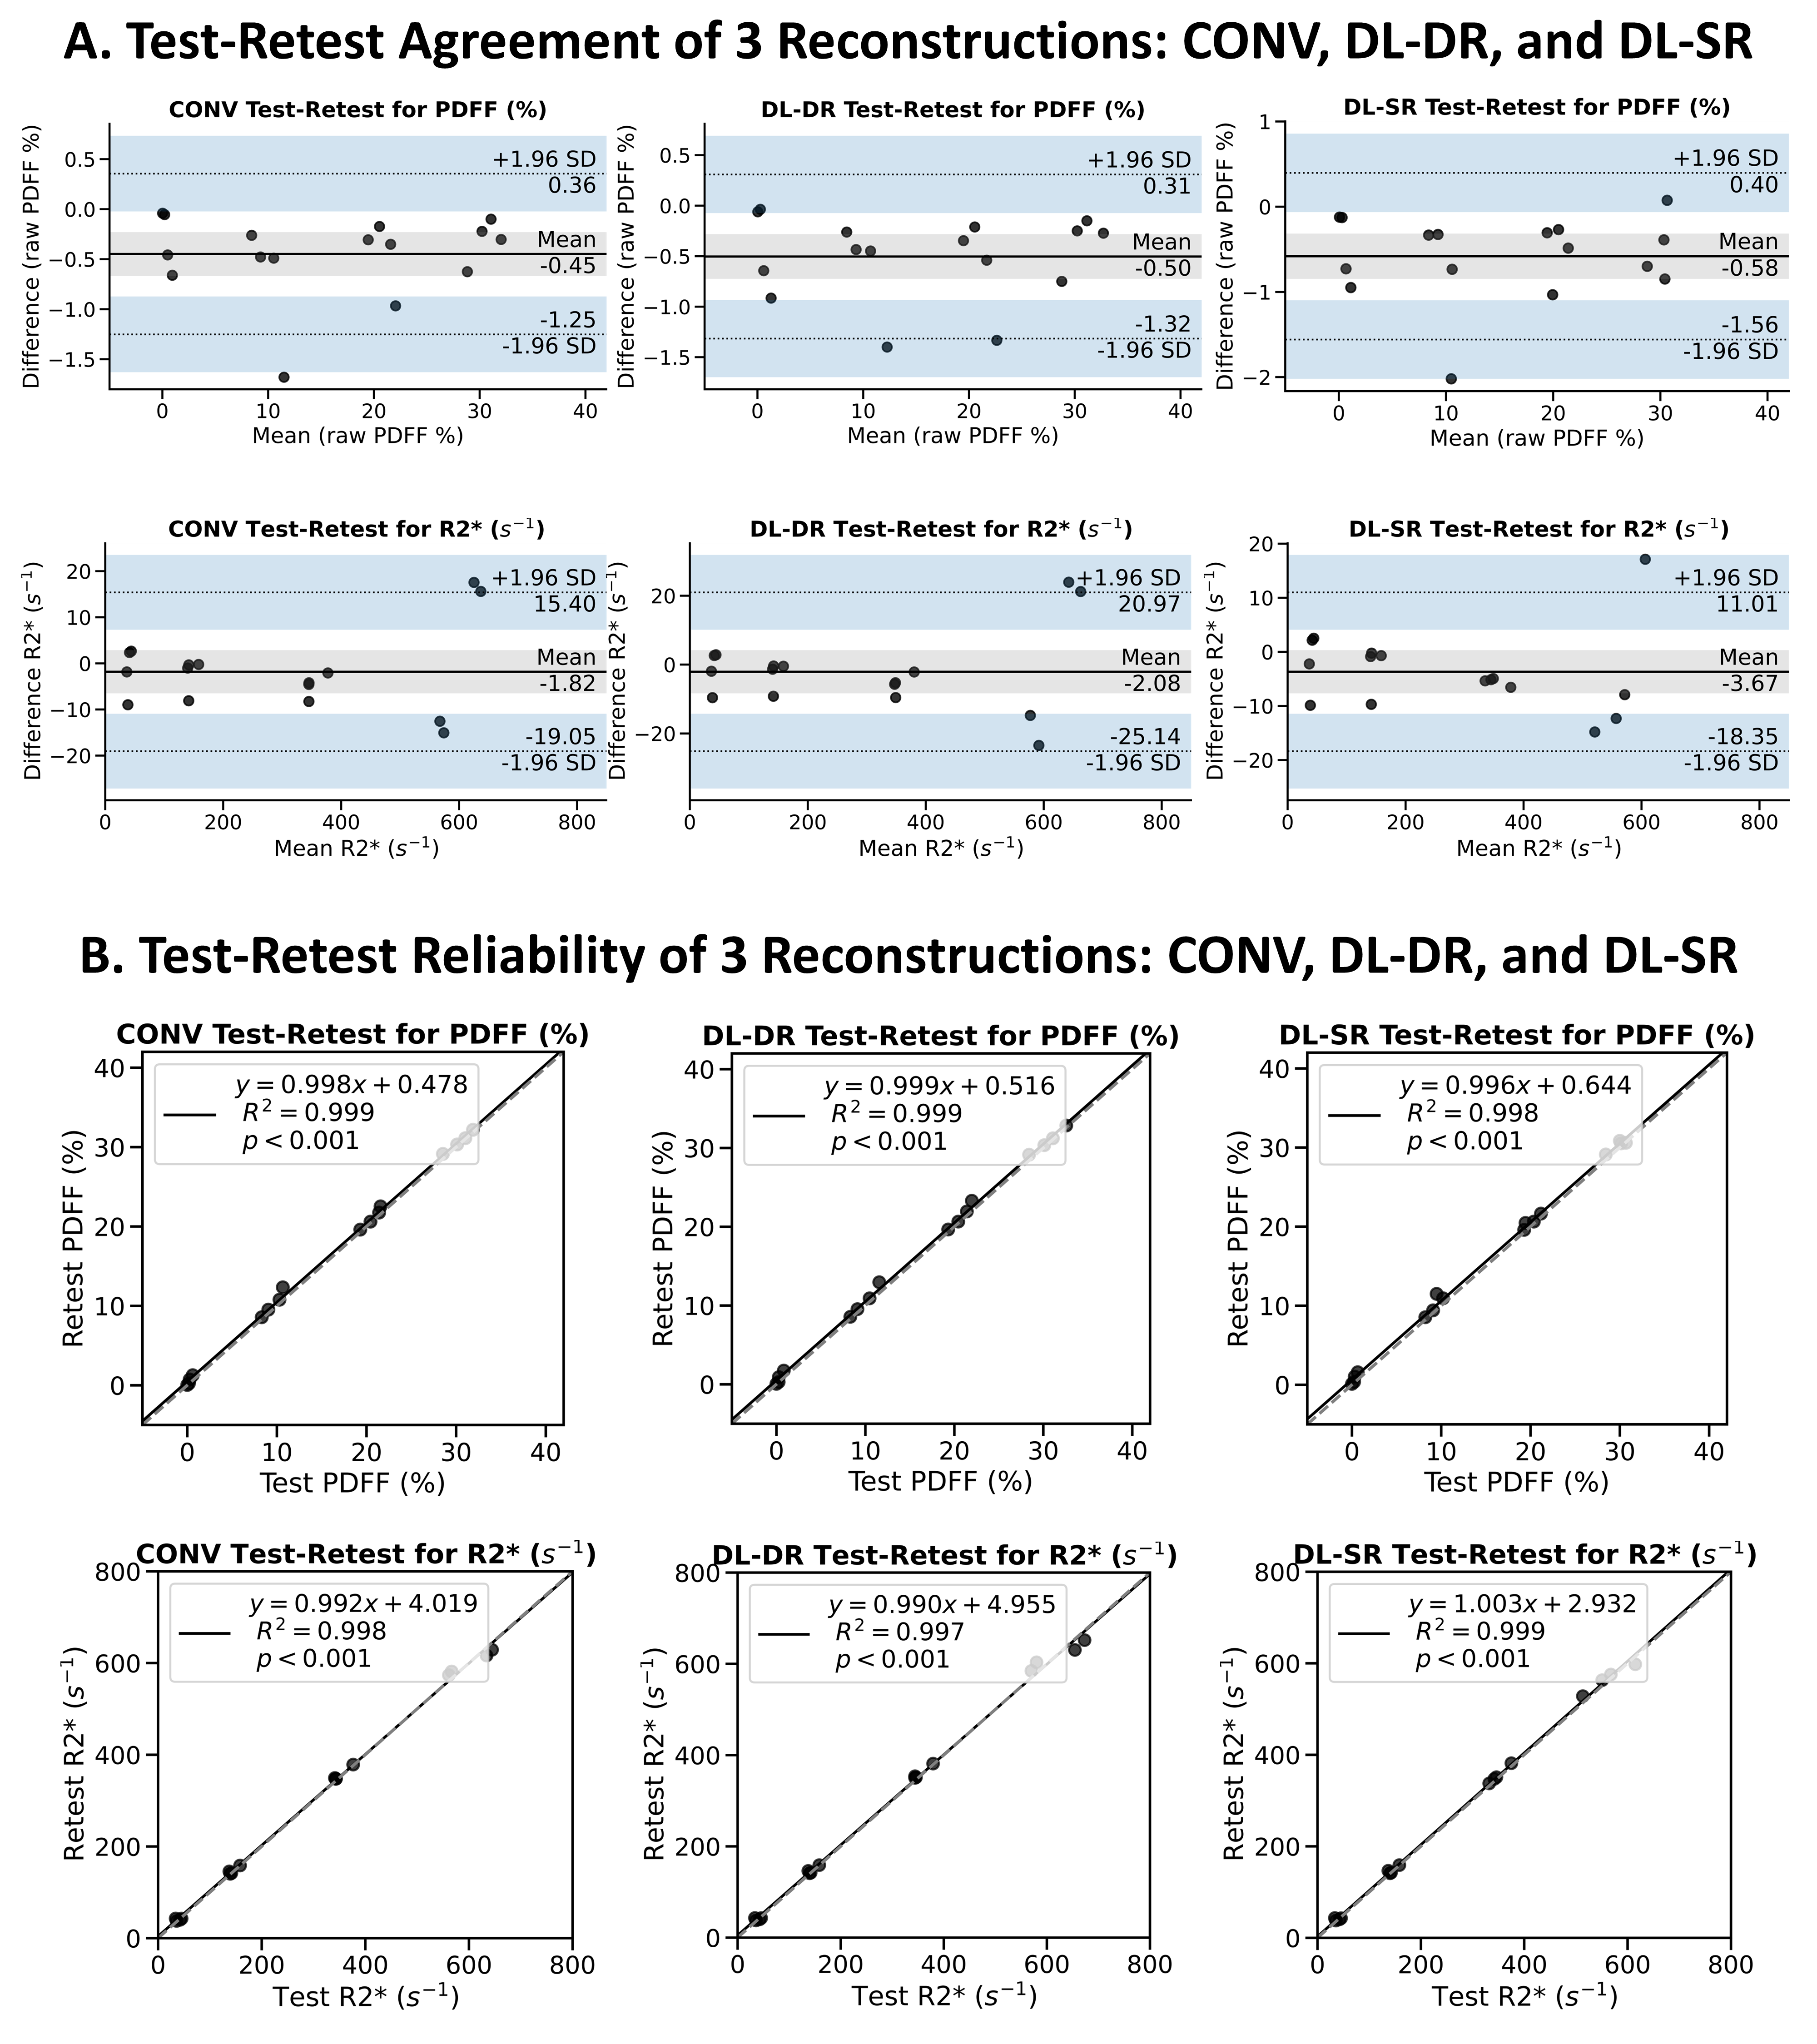
Figure 5: Bland-Altman test-retest agreement of CONV (first column), DL-DR (second column) and DL-SR (third column) for PDFF (first row) and R2* (second row). Similarly, test-retest reliability for PDFF and R2* are shown in the third row and fourth row, respectively. Lin’s concordance correlation coefficients were all larger than 0.99 for both PDFF and R2* measurements for all three reconstructions.