4622
DCE-MRI Derived Water Exchange Rate Constant in Multi-Center and Multi-Platform Assessment of Breast Cancer Therapy Response1Oregon Health & Science University, Portland, OR, United States, 2University of Washington, Seattle, WA, United States, 3University of Iowa, Iowa City, IA, United States
Synopsis
Keywords: Breast, Permeability, Breast, neoadjuvant chemotherapy, DCE
Motivation: Investigate water exchange rate constant (kio) in monitoring breast cancer (BC) response to neoadjuvant chemotherapy (NAC).
Goal(s): Evaluate changes in kio and voxel fraction of filtered kio during NAC.
Approach: BC patients treated with NAC underwent longitudinal high spatiotemporal resolution DCE-MRI at three sites using different 3T vendor systems. Voxel kio values were obtained with the shutter-speed modeling and filtered with a biologically relevant and DCE achievable range.
Results: Fractions of filtered kio decreased throughout the NAC course. Tumor kio and its heterogeneity were reduced in the pathologic complete response (pCR) group compared to the non-pCR group at midpoint and end of NAC.
Impact: Quantitative high spatiotemporal resolution Shutter-Speed Model (SSM) DCE-MRI can be implemented in multi-center and multi-platform settings with the SSM-exclusive kio parameter providing potentially complementary information to the conventional Ktrans parameter in assessment of BC response to NAC.
Introduction
The application of dynamic contrast-enhanced (DCE) MRI for accurate prediction of breast cancer (BC) response to neoadjuvant chemotherapy (NAC) 1 is promising and the quantitative DCE-MRI approach with pharmacokinetic (PK) modeling may further enhance the utility of DCE-MRI in assessing BC response to NAC. The Shutter-Speed Model (SSM)2,3 can be used to quantify the unidirectional intracellular water efflux rate constant, kio, in addition to the more commonly modeled Ktrans, contrast agent (CA) volume transfer rate constant. Recent work4 has shown that kio correlates with cellular activities. Its inclusion could therefore add metabolic insight on BC response to NAC. In this work, we report our initial experience of the added information of kio on BC response to NAC from a multi-center (MC) and multi-platform (MP) DCE-MRI study.Methods
After informed consent, longitudinal DCE-MRIs at three sites using 3T scanners manufactured by Siemens, GE, and Philips, respectively, were performed on BC patients undergoing NAC: pre-NAC (visit 1, V1), after the first NAC cycle (V2), at NAC midpoint (V3), and after NAC but before surgery (V4). High spatiotemporal resolution 3D axial bilateral and full coverage DCE-MRI was performed using vender-specific k-space-undersampling and view-sharing sequences: TWIST5 on Siemens, DISCO6 on GE, and 4D-TRAK7 on Philips. Other DCE parameters included 10o FA, minimal TE, 3-6 ms TR, 0.7-1.1 mm in-plane resolution and 1.0-1.5 mm slice thickness, temporal resolution range of 12-16 s and total acquisition time 9-10 minutes. B1 maps and variable FA (VFA) images were acquired immediately before DCE-MRI for B1-corrected pre-contrast R1 (R1,0) quantification. QA/QC scans were regularly performed at all three sites.Data from fifteen patients (one missed V3 scan and another missed V3 and V4 scans), who had pathologic response outcomes to date, were analyzed. Voxel-based DCE time-course data were modeled with the SSM.2,3 The SSM accounts for water exchange kinetics across cell membrane2,3 with kio as the additional model-specific parameter. Due to considerably biased VFA measurements of the phantom R1 values on one vendor platform, a fixed literature-reported8,9 R1,0 = 0.60 s-1 was used for PK analysis together with a population-averaged arterial input function (AIF) from breast DCE-MRI.10 Since the accuracy for kio quantification depends on CA extravasation2,3 and low extracellular CA concentration renders the in vivo system in the fast-exchange-limit condition where SSM returns unreliable large kio values, a biologically meaningful and DCE-MRI achievable range of 0.1 - 20 s-1 were used to filter the modeled kio. The fraction of voxels with kio within the range and the average value of the filtered kio were summarized.
Results
Six patients achieved pathologic complete response (pCR) while the other 9 were non-pCRs. Figure 1 summarizes the fraction means (SD error bars) of filtered kio within the tumor regions of interest (ROIs) for the two patient groups. Fractions of voxels with filtered, meaningful kio generally decreased from V1 to V4. The difference between V1 and V4 was highly substantial for both the non-pCR and pCR groups. Further, the V4 fractions of the pCRs were much smaller than those of the non-pCRs. Means (SD error bars) of filtered kio mean values of the tumor ROIs are show in Figure 2 for the two groups. A noticeable reduction in kio, as well as its heterogeneity indicated by SD, was observed in the pCR group at V3 and V4 compared to the non-pCR group. Figure 3 shows filtered tumor ROI kio color maps of a non-pCR and a pCR patient at V1 and V3. See figure legends for more details.Discussion
The preliminary results from this MC and MP study show that kio quantifies water exchange and provides complementary information to the more commonly modeled Ktrans that only focuses on CA kinetics. NAC regimens generally reduce tumor permeability/vascularity,1 which results in reduced interstitium CA concentration during a DCE study. This in turn often makes kio quantification less reliable. In other words, reduced CA extravasation results in smaller R1 difference between the extracellular and intracellular spaces, which decreases the DCE-MRI sensitivity to water exchange effect and consequently the accuracy in SSM quantification of kio. The smaller fraction of filtered kio at V4 in pCRs compare to non-pCRs quantitatively reflected the lower CA extravasation in the former. While there were no clear differences in kio at V2 between the two groups, the kio value and its heterogeneity were substantially lower in the pCR group at V3 and V4, suggesting kio could be a complementary DCE-MRI biomarker for assessing BC response to NAC.Acknowledgements
NIH grant R01 CA248192.
References
1. Tudorica A, Oh KY, Chui SYC, Roy N, Troxell ML, Naik A, Kemmer K, Chen Y, Holtorf ML, Afzal A, Springer CS, Li X, Huang W. Early Prediction and Evaluation of Breast Cancer Response to Neoadjuvant Chemotherapy Using Quantitative DCE-MRI. Transl Oncol 2016;9:8-17.
2. Yankeelov TE, Rooney WD, Li X, Springer CS. Variation of the relaxographic “Shutter-Speed” for transcytolemmal water exchange affects the CR bolus-tracking curve shape. Magn Reson Med 2003;50:1151-1169.
3. Li X, Rooney WD, Springer CS. A unified pharmacokinetic theory for intravascular and extracellular contrast agents. Magn Reson Med 2005;54:1351-1359. [Erratum. Magn Reson Med 2006;55:1217.]
4. Zhang Y, Poirier-Quinot M, Springer CS Jr, Balschi JA. Active trans-plasma membrane water cycling in yeast is revealed by NMR. Biophys J. 2011 Dec 7;101(11):2833-42.
5. Song T, Laine AF, Chen Q, Rusinek H, Bokacheva L, Lim RP, Laub G, Kroeker R, Lee VS. Optimal k-space sampling for dynamic contrast-enhanced MRI with an application to MR renography. Magn Reson Med 2009;61:1242-1248.
6. Saranathan M, Rettmann DW, Hargreaves BA, Clarke SE, Vasanawala SS. Differential subsampling with Cartesian ordering (DISCO): a high spatio-temporal resolution Dixon imaging sequence for multiphasic contrast enhanced abdominal imaging. J Magn Reson Imaging. 2012;35:1484–1492.
7. Willinek WA, Hadizadeh DR, von Falkenhausen M, Urbach H, Hoogeveen R, Schild HH, Gieseke J. 4D time-resolved MR angiography with keyhole (4D-TRAK): more than 60 times accelerated MRA using a combination of CENTRA, keyhole, and SENSE at 3.0T. J Magn Reson Imaging 2008;27:1455-1460.
8. Pineda FD, Medved M, Fan X, Karczmar GS. B1 and T1 mapping of the breast with a reference tissue method. Magn Reson Med 2016;75:1565-1573.
9. Rakow-Penner R, Daniel B, Yu H, Sawyer-Glover A, Glover GH. Relaxation times of breast tissue at 1.5T and 3T measured using IDEAL. J Magn Reson Imaging 2006;23:87-91.
10. Huang W, Tudorica LA, Li X, Thakur SB, Chen Y, Morris EA, Tagge IJ, Korenblit M, Rooney WD, Koutcher JA, Springer CS. Discrimination of benign and malignant breast lesions by using shutter-speed dynamic contrast-enhanced MR imaging. Radiology 2011; 261:394-403.
Figures
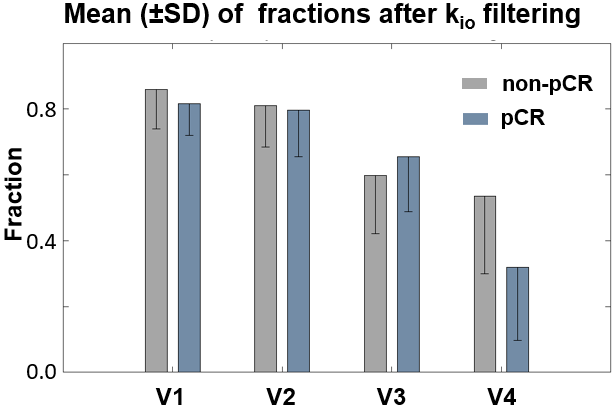
Figure 1 The voxel fraction means (SD error bars) of filtered tumor voxel kio within a biologically meaningful and DCE-MRI achievable range of 0.1 – 20 s-1 from V1 to V4 for the non-pCR (gray) and pCR (blue) groups with fixed R1,0 in model fitting. Fraction means show little R1,0-selection dependence between fixed or VFA fitted R1,0 (results using VFA R1,0, excluding data from one vendor platform with unreliable VFA measurements, are not shown).
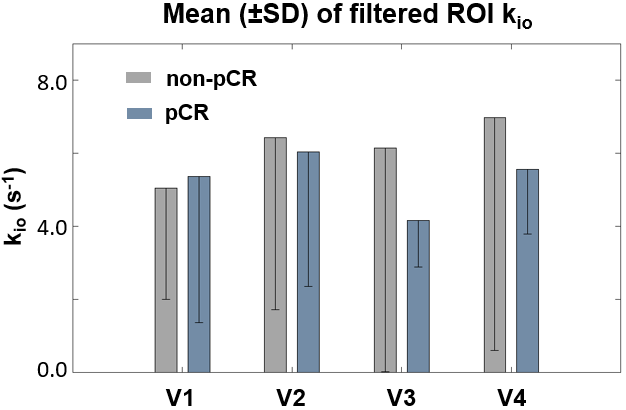
Figure 2 Means (SD error bars) of filtered tumor ROI kio mean for the non-pCR (gray) and pCR (blue) groups using fixed R1,0 fitting approach. Filtered tumor ki0 mean values show little R1,0-selection dependence between fixed or VFA fitted R1,0 (results using VFA R1,0, excluding data from one vendor platform with unreliable VFA measurements, are not shown).
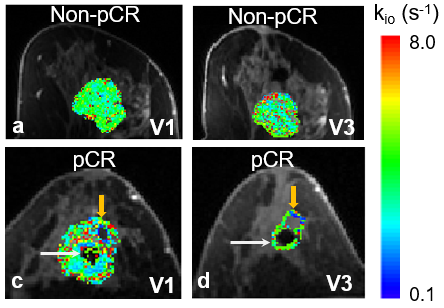
Figure 3 Filtered tumor ROI kio color maps overlaid on a zoomed post-contrast DCE image at two visits (V1, V3) for a non-pCR (top) and a pCR (bottom) patient are shown. In all the panels, kio maps on the center slice of the respective tumors are shown. The white arrows in (c) and (d) point to the artefacts caused by a metal biopsy clip. A larger area in the pCR tumor was also filtered out for unreliable kio at V3 (d, orange arrow) compared to a smaller filtered-out area at its V1 (c, orange arrow).