4617
Prediction of Neoadjuvant Systemic Treatment Response in Triple-Negative Breast Cancer Using a 3D Neural Network on Synthetic MR Images1Department of Imaging Physics, The University of Texas M.D. Anderson Cancer Center, Houston, TX, United States, 2Department of Cancer Systems Imaging, The University of Texas M.D. Anderson Cancer Center, Houston, TX, United States, 3Department of Biostatistics, The University of Texas M.D. Anderson Cancer Center, Houston, TX, United States, 4Department of Breast Imaging, The University of Texas M.D. Anderson Cancer Center, Houston, TX, United States, 5Department of Breast Medical Oncology, The University of Texas M.D. Anderson Cancer Center, Houston, TX, United States, 6Department of Abdominal Imaging, The University of Texas M.D. Anderson Cancer Center, Houston, TX, United States
Synopsis
Keywords: Breast, Breast
Motivation: There is an unmet need for noninvasive imaging biomarkers for accurate early prediction of therapy response in patients with triple negative breast cancer.
Goal(s): In this study, we investigated using a 3D convolutional neural network to predict response from quantitative T1, T2, and PD images acquired with the SyntheticMR technique.
Approach: A ResNet-101 network was extended to 3D with 3 channels of inputs, and trained and evaluated using 5-fold cross validation with 217 image datasets acquired after 2 and 4 cycles of therapy.
Results: Accuracy of response prediction ranged from 0.61-0.77 and dice similarity ranged from 0.68-0.77 when all time points were utilized.
Impact: Therapy response at mid-treatment may be determined by a neural network applied to a single multi-parameter mapping sequence, which may help guide treatment strategies for improved outcomes for patients with triple negative breast cancer.
Introduction
Triple-negative breast cancer (TNBC) is an aggressive subtype that lacks receptors for targeted therapies. Patients with TNBC are typically treated with 12-16 weeks of neoadjuvant systemic therapy (NAST), which carries a highly toxicity and a rate of pathological complete response (pCR) of less than 50% [1]. Noninvasive imaging biomarkers for accurate and early prediction of NAST response in patients with TNBC may guide treatment strategies for improved outcomes. Synthetic MRI enables fast and simultaneous quantification of tissue T1, T2, and PD [2,3], which has demonstrated some value for predicting pCR when evaluated with radiomic analysis [4]. Similarly, convolutional neural networks (CNN) with densely connected multilayer perceptrons can learn unique features of an image for classification purposes. Previous work developed a hybrid 2D deep learning network that includes the slice-to-slice correlations in 3-channel (T1, T2, PD), multislice Synthetic MRI data [5]. In this work, we propose a 3D CNN for prediction of NAST response in TNBC patients on multislice, quantitative Synthetic MR images.Methods
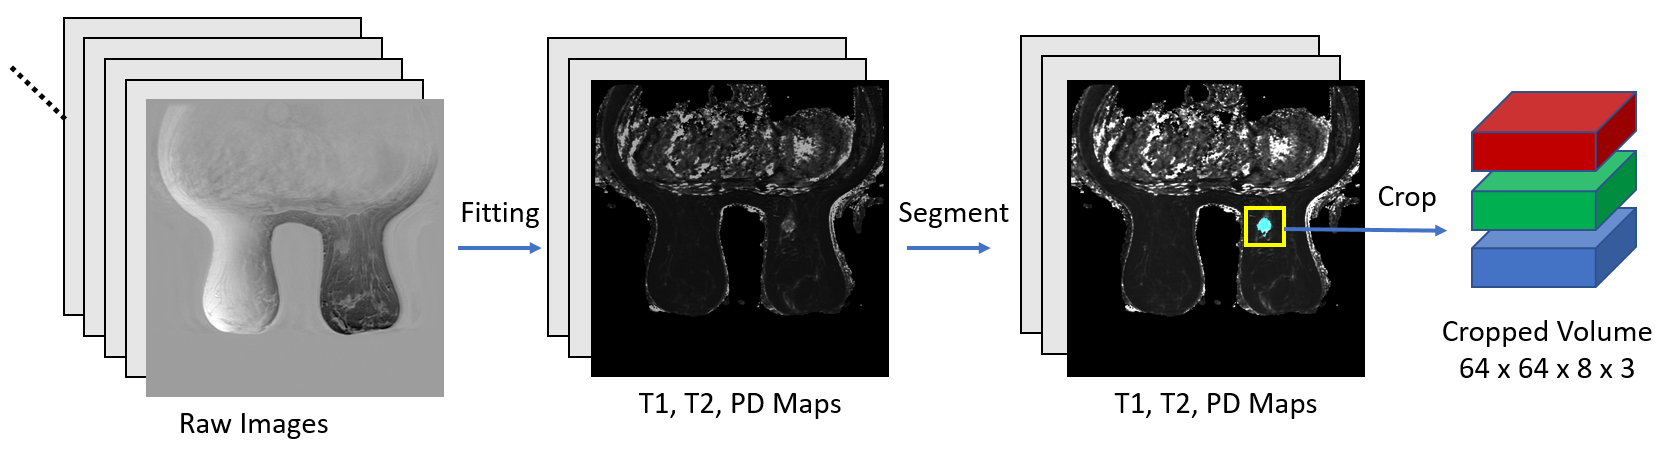
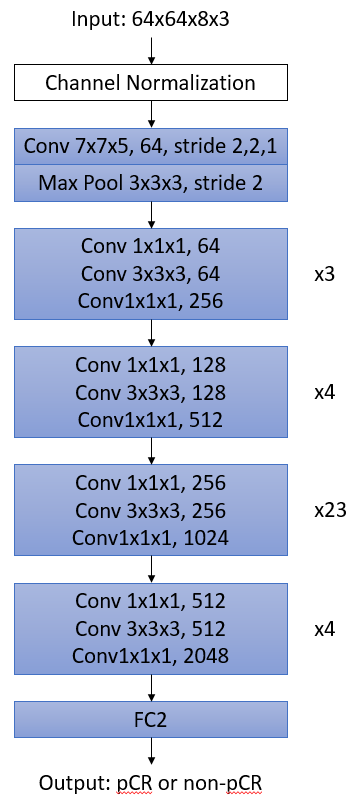
125 participants in an IRB approved study were acquired with the Synthetic MRI sequence (MAGIC) on a GE 3.0T whole body scanner (GE Healthcare, Waukesha, WI, USA). The scan parameters for Synthetic MRI were FOV=34 cm×34 cm, matrix=320×256, slice-thickness/slice-gap=4/1mm, Nslice=30, TR=4500 ms, TE1/TE2=18/93 ms, RBW=±31.25kHz, ETL=14, ASSET acceleration factor = 2, and scan time = 6:08. No gadolinium-based contrast agent was administered before or during acquisition of the MAGIC sequence. 92 image sets were acquired after 2 cycles of therapy (C2), and 125 image sets were acquired after 4 cycles (C4). Multi-slice T1, T2 and proton-density (PD) maps were generated from each acquired image set, on which the tumor of interest was semi-automatically segmented, refined, edited, and modified slice by slice by two fellowship-trained breast radiologists. pCR status was determined by histopathology of the surgical specimen.From the reconstructed matrix of 512x512 pixels and 30 slices, all image sets were cropped to 64x64 pixels and 8 slices centered at the segmented volume of interest (Figure 1). A ResNet-101 network [6,7] was modified to accept these 3D volumes with 3 independently normalized channels representing T1, T2, and PD as input, and to output a binary classification of pCR or non-pCR (Figure 2). Training was performed over 50 epochs using an adaptive moment estimation optimizer with minibatch size of 128. The initial 3D convolution layer used a smaller kernel size and stride of 1 in the slice dimension due to the smaller number of slices. All 217 image sets from C2 and C4 were combined into a single data set and used for training and evaluation of the CNN by 5-fold cross validation, using 173-174 image sets in each fold for training and the remainder for validation. For each fold, accuracy, Dice similarity, sensitivity, specificity, and area under the receiver operating characteristics curve (AUC) were calculated between the predicted and reference values.
Results and Discussion
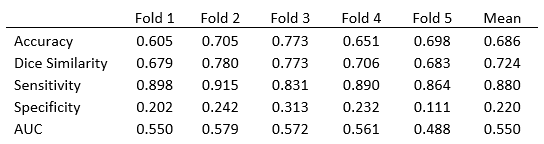
90.8% of the segmented volumes fit entirely within the cropped dimensions. Accuracy and Dice similarity results are shown in Table 1. Accuracy ranged from 0.605-0.773 with a mean of 0.686, while Dice similarity ranged from 0.679 to 0.780 with a mean of 0.724. Mean sensitivity, specificity, and AUC over the 5 folds was 0.88, 0.22, and 0.55, respectively.We have demonstrated the feasibility of using a 3D CNN for early prediction of pCR in TNBC patients undergoing NAST, a task that is challenging without the use of contrast agents. Investigators have reported an AUC of 0.6 when evaluating change in mean apparent diffusion coefficient for prediction of response across all subtypes of breast cancer and 0.57 in TNBC [8]. Using a larger data set of 181 participants, a radiomic model of 315 features trained on T1 images generated by the Synthetic MRI technique at C4 was reported to have an AUC of 0.72 on an independent testing cohort [4]. The use of quantitative values relaxes normalization strategies required for radiomic analysis but may have limited benefit for use with CNN's, since normalization occurs at multiple layers throughout the network. Independent channel normalization is intuitive and may help weight the channels equally but appears to have limited effect on training. Ultimately, the increased dimensionality of CNN's relative to radiomics requires greater number of image sets for training to be effective, especially for 3D multichannel networks. More data sets and/or data augmentation strategies may further improve the performance of the CNN.
Acknowledgements
This work was supported by the University of Texas MD Anderson Moon Shots Program and Robert D. Moreton Distinguished Chair Funds in Diagnostic Radiology. This study was supported by the NIH/NCI under award number P30CA016672.References
1. Sharma P. Biology and management of patients with triple-negative breast cancer. Oncologist 2016;21(9):1050–1062
2. Warntjes JBM, et al. Rapid magnetic resonancequantification on the brain: Optimization for clinical usage. Magn ResonMed 2008;60(2):320–329.
3. Hwang KP, Fujita S. Synthetic MR: Physical principles, clinical implementation, and new developments. Med Phys. 2022 Jul;49(7):4861-4874.
4. Hwang KP, et al. A Radiomics Model Based on Synthetic MRI Acquisition for Predicting Neoadjuvant Systemic Treatment Response in Triple-Negative Breast Cancer. Radiol Imaging Cancer. 2023 Jul;5(4):e230009.
5. Son JB, et al. Predicting breast cancer treatment response using a hybrid deep learning network on multislice SyntheticMR images. Proc. ISMRM, 2022.
6. He K, et al. Deep residual learning for image recognition. Proc IEEE Comput Soc Conf Comput Vis Pattern Recognit. 2016:770-778.
7. Ebrahimi, Amir, et al. “Convolutional Neural Networks for Alzheimer’s Disease Detection on MRI Images.” Journal of Medical Imaging, vol. 8, no. 02, SPIE-Intl Soc Optical Eng, Apr. 2021
8. Partridge SC, et al. Diffusion-weighted MRI findings
predict pathologic response in neoadjuvant treatment of breast cancer: The
ACRIN 6698 multicenter trial. Radiology 2018;289(3):618–627.
Figures