4609
Multi b-value Reverse Polarity Gradient Distortion Correction for Breast Diffusion-Weighted MRI1Radiology, UCSD, San Diego, CA, United States, 2Surgical Sciences, Radiology, Uppsala University, Uppsala, Sweden, 3Radiation oncology, UCSD, San Diego, CA, United States, 4Bioengineering, UCSD, San Diego, CA, United States, 5Neurosciences, UCSD, San Diego, CA, United States
Synopsis
Keywords: Breast, Breast, Diffusion, Distortion Correction
Motivation: DW-MRI holds great potential in improving specificity in breast cancer screening (BCS). This technique uses Echo-Planar imaging (EPI) and is sensitive to distortion due to spatial magnetic inhomogeneity. Correcting such distortion is key, especially when evaluating quantitative biomarkers.
Goal(s): To study multi b-value Reverse Polarity Gradient (mRPG), originally developed for prostate DWI (abstract #4789), in comparison to standard RPG and FSL topup.
Approach: A breast phantom scan and a BCS patient dataset were distortion corrected with the three methods.
Results: mRPG showed better performance than RPG and topup, especially in ADC maps where they yield a misleading improvement of EPI distortions.
Impact: mRPG demonstrated improved performance compared to RPG and topup in correcting distortions. Normalizing DWI volumes across b-values eliminates intensity changes resulting from distortions and solves overfitting issue where Jacobian intensity correction (JIC) makes up for underestimation of tissue displacement.
Introduction
Diffusion Weighted MRI (DW-MRI) is an advanced imaging technique that assesses tissue microstructure without the need for invasive contrast agents. It relies on diffusion gradients to measure water diffusivity, which reflects tissue cellularity. Echo-Planar Imaging (EPI) is commonly used for k-space encoding but is sensitive spatial magnetic field inhomogeneities. This sensitivity can lead to distortion artifacts in the phase encode (PE) direction, particularly problematic in high-resolution breast cancer screening (BCS) using DW-MRI.To mitigate distortion artifacts, various correction methods, like Reverse Polarity Gradient (RPG)1 and FSL topup2,3, have been developed. They entail collecting additional b0 images with negative PE (NPE) trajectories to correct the distortions symmetrically. However, the proton density correction process involving the Jacobian of the displacement field (JIC) can introduce artificial contrast4.
An alternative approach is to normalize the data by the sum of the signal across all collected b-values before image registration between positive (PPE) and NPE images. This method necessitates collecting multiple b-values for both positive (PPE) and NPE images and was developed initially for prostate DWI (as detailed in companion abstract #4789).
This study aims to assess distortion correction performances of a new proposed method (mRPG) regarding RPG and topup in breast DWI. Preliminary evaluation was conducted on a breast phantom (BP) and methods were also retrospectively tested on a larger dataset of BCS patients.
Methods
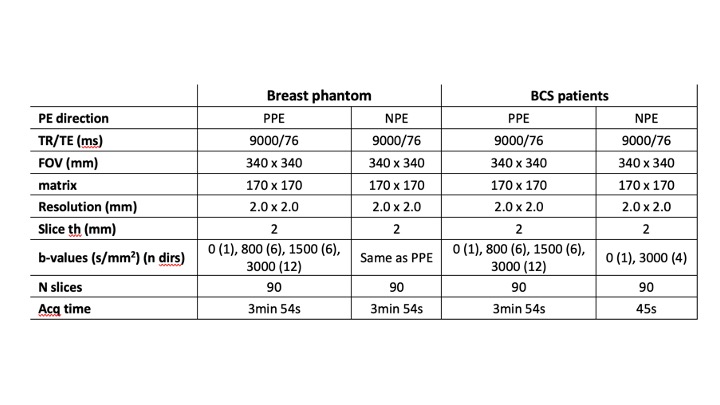
A BP designed by CaliberMRI (CaliberMRI, USA) was first scanned using a 3T MRI scanner (Signa Premier, GE Healthcare, USA) and a 16-channel breast coil (NeoCoil, USA). Then, a dataset of 85 BCS patients was retrospectively processed with distortion correction methods. Patients were scanned using the same type of scanner and coil. All imaging parameters are reported on Table 1.Images were processed using Matlab (R2017a, MathWorks). DWI b0 images and ADC maps were corrected using RPG and topup as gold standard method, both with and without JIC, and with mRPG. ADC maps were calculated using b0 and b800 for the BP and using b0 and b3000 for BCS patients.
In mRPG, both PPE and NPE volumes acquired at each b-value were first averaged together. Averaged images are then normalized by their sum across all b-values. The normalized data is then used for registration between PPE and NPE images with a penalty for large displacements. Finally, the estimated displacements are applied to the original images without JIC.
Pearson correlation coefficient between PPE and NPE volumes were calculated before and after each correction. Statistical differences were assessed using SPSS (IBM, USA) with two-sided paired sampled t-tests.
Results
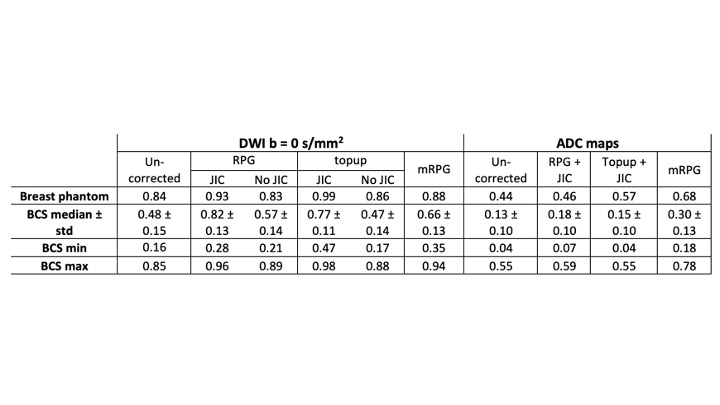
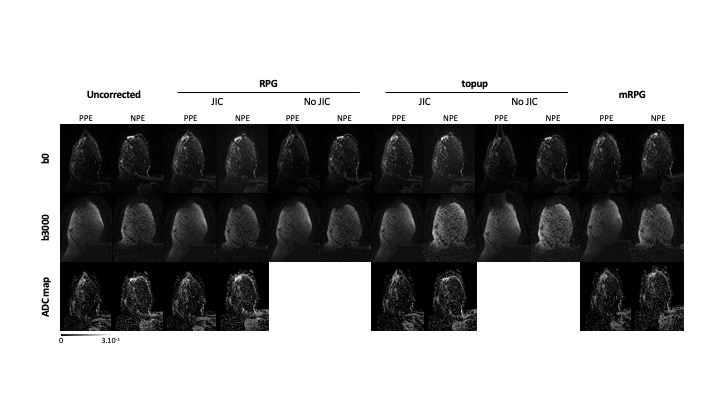
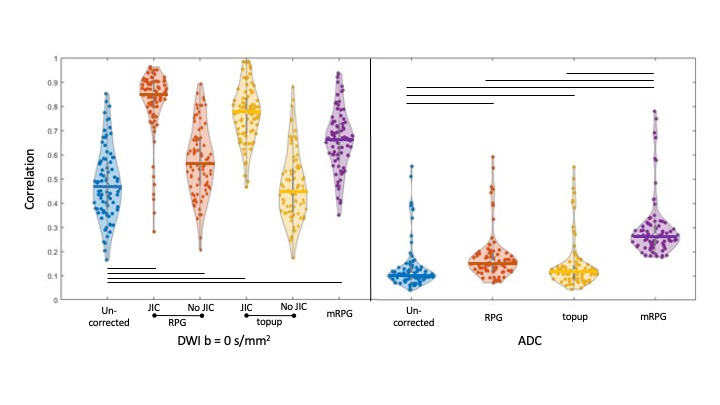
On the BS, PPE and NPE correlation increased in b0 with RPG + JIC (0.84 vs 0.93) and with topup + JIC (0.99) and did not when JIC is not applied (0.83 with RPG, 0.86 with topup). PPE and NPE correlation did not increase in ADC for RPG + JIC (0.44 vs 0.46 but increased with topup + JIC (0.57). mRPG showed correlation increase both between b0 and ADC (0.88 and 0.68, respectively).In BCS, similar results are reported. A case example is shown on Figure 1. For PPE and NPE b0, all methods improved correlations significantly (all p-values < 0.001) except for topup with no JIC (p = 0.12). mRPG had lower PPE/NPE correlation than RPG and topup with JIC, but higher PPE/NPE correlation than RPG and topup with no JIC. In ADC, all groups were significantly different from each other and mRPG had the highest PPE/NPE correlation. All results are summarized in Table 2 and Figure 2.
Discussion
In this study, we applied mRPG both on a BP and on a BCS dataset. This method does not involve JIC, contrarily to RPG and topup. Of concern, the JIC appears to make up for signal intensities in DWI volumes but reaches limits when data is then used for quantitative evaluations, as ADC minimally improves in PPE/NPE correlation. Signal curves are shifted up or down by JIC, but do not change the rate of signal decay. mRPG shows satisfying performances in spin bunching correction without JIC.ADC maps were computed using b0 and b3000 in BCS patients for both PPE and NPE as they were the only two b-values available in the NPE acquisition. This choice of b-values is suboptimal for ADC measurements but has little bearing here as intrinsic ADC values are not evaluated.
Only b3000 was added to b0 in NPE scan for BCS as clinical time constraints only allowed one extra b-value. This value was chosen to account for distortions in potential malignancies, but further attention should be given for optimization.
Acknowledgements
GE Healthcare research grant
Krueger-Wyeth award
References
1. Holland D, Kuperman JM, Dale AM. Efficient correction of inhomogeneous static magnetic field-induced distortion in Echo Planar Imaging. NeuroImage. 2010;50(1):175-183. doi:10.1016/j.neuroimage.2009.11.044
2. Andersson JLR, Skare S, Ashburner J. How to correct susceptibility distortions in spin-echo echo-planar images: application to diffusion tensor imaging. NeuroImage. 2003;20(2):870-888. doi:10.1016/S1053-8119(03)00336-7
3. Smith SM, Jenkinson M, Woolrich MW, et al. Advances in functional and structural MR image analysis and implementation as FSL. NeuroImage. 2004;23 Suppl 1:S208-219. doi:10.1016/j.neuroimage.2004.07.051
4. Rodríguez-Soto AE, Fang LK, Holland D, et al. Correction of Artifacts Induced by B0 Inhomogeneities in Breast MRI Using Reduced-Field-of-View Echo-Planar Imaging and Enhanced Reversed Polarity Gradient Method. J Magn Reson Imaging. 2021;53(5):1581-1591. doi:10.1002/jmri.27566
Figures