4606
The Application of High Temporal Resolution Semi-quantitative Dynamic Contrast Enhanced MRI in Predicting Ki-67 Expression in Breast Cancer1Radiology, The First Hospital of Lanzhou University, Lanzhou, China, 2GE HealthCare MR Research, Beijing, China, 3Breast Disease, The First Hospital of Lanzhou University, Lanzhou, China, 4Pathology, The First Hospital of Lanzhou University, Lanzhou, China
Synopsis
Keywords: Breast, Breast, MRI; DISCO; DCE; Ki-67
Motivation: It was hoped that a method can come under observation to capture the semi-quantitative hemodynamic characteristics of tumor enhancement, so as to provide richer and more accurate information for the early clinical diagnosis of breast cancer.
Goal(s): To investigate the application value of semi-quantitative parameters of three enhanced sequences of MRI techniques in predicting Ki-67 expression in breast cancer.
Approach: The semi-quantitative parameters of the enhanced images of the three groups were calculated respectively. The predictive parameters of Ki-67 expression in breast cancer were obtained by statistical analysis.
Results: ROI1+54-per-brevity of enhancement was valuable for predicting the expression of Ki-67 in breast cancer(P=0.032).
Impact: The DISCO-MRI with fast scanning speed and high time resolution needs to be further studied whether it can replace the traditional DCE-MRI scanning in the future, and it also needs to find a suitable post-processing mode.
Introduction
As a proliferation biomarker, Ki-67 index has been utilized to distinguish the subtypes of breast tumors (luminal A or luminal B) in estrogen receptor-positive individuals, and it is also an important sign of aggressive growth of breast cancer 1. Some previous studies 2-4 have tried to use MRI (especially dynamic contrast-enhanced, DCE-MRI) techniques to noninvasively predict the Ki-67 expression in breast cancer. However, because of its low temporal-resolution (>30 s per phase), conventional DCE-MRI can only collect several phases in breast imaging, which may affect the accuracy of semi-quantitative calculation 5-6. Differential subsampling with cartesian ordering (DISCO) is a novel image acquisition and reconstruction scheme which based on the “view-sharing” concept and can provide DCE-MRI with both high temporal and high spatial resolution 7. This study aims to investigate the effect of improving the temporal resolution on the semi-quantification accuracy of DCE-MRI, as well as the application value of DISCO-based high temporal resolution DCE-MRI in predicting Ki-67 expression in breast cancer.Methods
Participants:This study was approved by the Institutional Ethics Committee. From September 2022 to August 2023, a total of 73 cases of breast cancer patients confirmed by pathology were recruited. The Picture Archiving and Communication Systems of our institution was used to find patients meeting the following inclusion criteria:(a) all patients were pathologically diagnosed as breast cancer and the pathologic report included the results of Ki-67; (b) all patients underwent MRI examination before surgery; (c) for patients with multicentric or multifocal tumors, only the tumors with the largest diameter were analyzed; (d) there was no statistically significant difference (P >0.05) in clinical and magnetic resonance morphological indicators, and no claustrophobia. The exclusion criteria were as follows:(a) unsatisfactory imaging quality due to movements during the MRI examination; (b) patients with insufficient imaging data.
Data acquisition:
All participants were scanned after obtaining written informed consent. All MR examinations were performed on a 3.0 T MR scanner (SIGNATM Architect, GE Healthcare, Milwaukee WI, USA) equipped with a 8-channel breast coil. The main scan parameters were listed in Table 2. Participants were are divided into three groups according to the different scan protocols. 25 cases were scanned using conventional DCE sequence which collected mask phase and 8 contrast-enhanced phases (DCE1+8 group). 19 patients underwent the DISCO sequence with relatively higher temporal resolution and more phases (DISCO1+35 group), while the remaining 29 cases were scanned using the DISCO sequence with the highest temporal resolution and the most phases (DISCO1+54 group).
Image analysis:
Intratumoral and peritumoral ROIs were drawn on the maximum enhancement leve images with 5-10 mm circular ROI by two radiologists with 10 and 8 years of breast imaging experience. Images with ROIs from different groups (DISCO1+54, DISCO1+35, DCE1+8) were processed using the Intelli Space Portal workstation. Semi-quantitative metrics including the value of max enhancement(%), time to peak(s), wash in rate(s-1), wash out rate(s-1), brevity of enhancement(s) and area under the curve (AUC) were measured subsequently8.
Pathological criteria:
Ki-67 positivity greater than 14% was considered to be high (10 cases) and otherwise was considered to be low (63 cases)9. The expression of Ki-67 was determined by immunohistochemical staining.
Statistical analysis:
Statistical analysis was conducted using SPSS software (version 25.0, IBM Corporation, Armonk, NY, USA) at a two-sided significance level of 5% (P<0.05 indicates statistical significance). The differences of the MRI semi-quantitative metrics (the intra-tumoral and peritumoral metrics were represented by -In and -per suffix, respectively) between the low-Ki-67 expression group and high-Ki-67 expression group were analyzed by Shapiro Wilk-test (evaluate the normality of distribution for continuous variables), Chi Square-test(test of classified data), student’s T-test(test of normal distribution data) and Mann Whitney U-test(test of non-normal distribution data) of two independent samples, and the diagnostic efficacy of the metrics were evaluated by receiver operating characteristic (ROC) curves. All drawings were done on MedCalc statistical software(version 20.02, Belgium) and GraphPad Prism software(version 9.51, Boston).
Results
ROI1+54-Per-Brevity of Enhancement was valuable for predicting the expression of Ki-67 in breast cancer (P<0.05).The median of ROI1+54-Per-Brevity of Enhancement of high expression group of Ki-67 was higher than that of the low group.Discussion
DISCO1+54-per-brevity of enhancement was able to predict Ki-67 status what might explain whether the expression of Ki-67 in breast cancer had a bearing on the time between wash-in and wash-out 10. Although the first and second groups were DISCO sequences, the results obtained were also different, which may be correlated with the time resolution.Conclusion
Different dynamic enhancement sequence may be different in predicting Ki-67 status of breast cancer. High time resolution maybe improve the quantitative accuracy of DCE.Acknowledgements
The authors would like to thank Dr. Yuhui Xiong for his contribution.References
- Ferguson N L, Bell J, Heidel R, et al. Prognostic value of breast cancer subtypes, Ki‐67 proliferation index, age, and pathologic tumor characteristics on breast cancer survival in Caucasian women[J]. The breast journal, 2013, 19(1): 22-30.
- Jiang T, Song J, Wang X, et al. Intratumoral and peritumoral analysis of mammography, tomosynthesis, and multiparametric MRI for predicting Ki-67 level in breast cancer: a radiomics-based study[J]. Molecular Imaging and Biology, 2021: 1-10.
- Ma W, Ji Y, Qi L, et al. Breast cancer Ki67 expression prediction by DCE-MRI radiomics features[J]. Clinical radiology, 2018, 73(10): 909. e1-909. e5.
- Fan M, Yuan W, Zhao W, et al. Joint prediction of breast cancer histological grade and Ki-67 expression level based on DCE-MRI and DWI radiomics[J]. IEEE journal of biomedical and health informatics, 2019, 24(6): 1632-1642.
- Morrison C K, Bancroft L C H, DeMartini W B, et al. Novel high spatiotemporal resolution versus standard-of-care dynamic contrast-enhanced breast MRI: comparison of image quality[J]. Investigative radiology, 2017, 52(4): 198.
- Touillaud M, Fournier B, Pérol O, et al. Connected device and therapeutic patient education to promote physical activity among women with localised breast cancer (DISCO trial): protocol for a multicentre 2× 2 factorial randomised controlled trial[J]. BMJ open, 2021, 11(9): e045448.
- Saranathan M, Rettmann D W, Hargreaves B A, et al. Differential subsampling with cartesian ordering (DISCO): a high spatio‐temporal resolution dixon imaging sequence for multiphasic contrast enhanced abdominal imaging[J]. Journal of Magnetic Resonance Imaging, 2012, 35(6): 1484-1492.
- Cristel G, Esposito A, Briganti A, et al. MpMRI of the prostate: is there a role for semi-quantitative analysis of DCE-MRI and late gadolinium enhancement in the characterisation of prostate cancer? [J]. Clinical Radiology, 2019, 74(4): 259-267.
- Goldhirsch A, Wood W C, Coates A S, et al. Strategies for subtypes—dealing with the diversity of breast cancer: highlights of the St Gallen International Expert Consensus on the Primary Therapy of Early Breast Cancer 2011[J]. Annals of oncology, 2011, 22(8): 1736-1747.
- Macchini M, Ponziani M, Iamurri A P, et al. Role of DCE-MR in predicting breast cancer subtypes[J]. La radiologia medica, 2018, 123: 753-764.
Figures
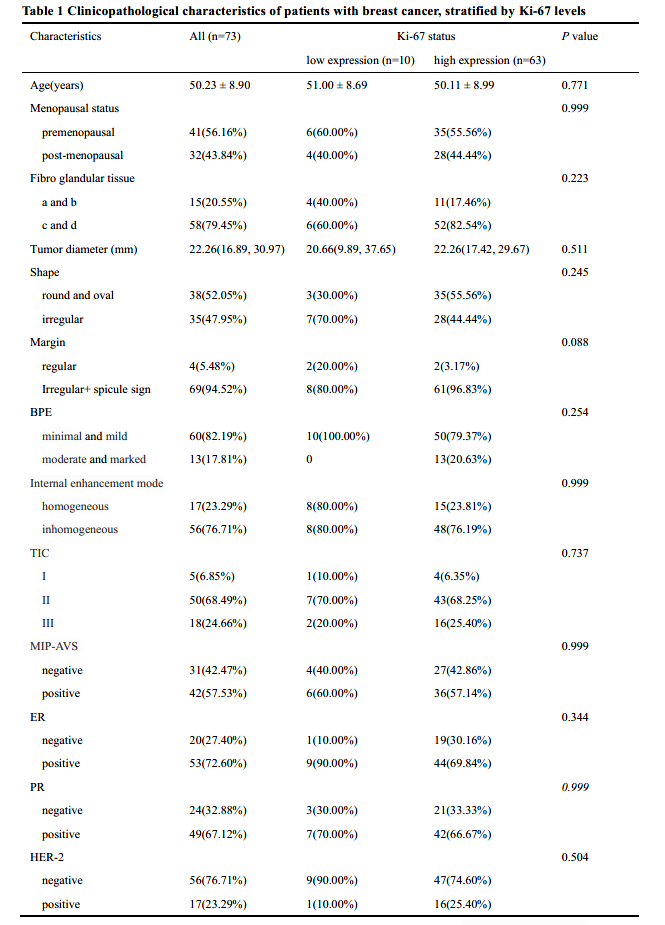
Table 1 Clinicopathological characteristics of patients with breast cancer, stratified by Ki-67 levels
HER-2, human epidermal growth factor receptor-2; BPE, background parenchymal enhancement; TIC, time-intensity curve; ER, estrogen receptor; PR, progesterone receptor; ALN, axillary lymph node; TNBC, triple-negative breast cancer.
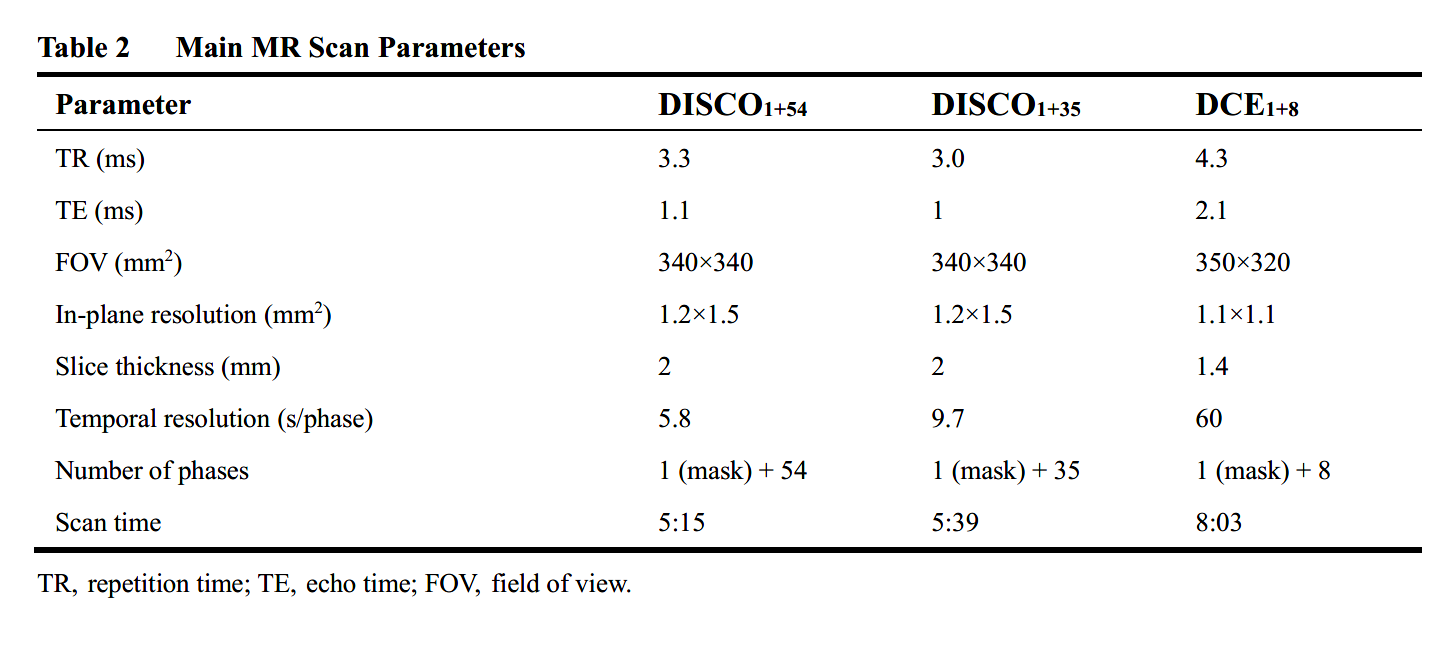
Table 2 Main MR Scan Parameters
TR, repetition time; TE, echo time; FOV, field of view.
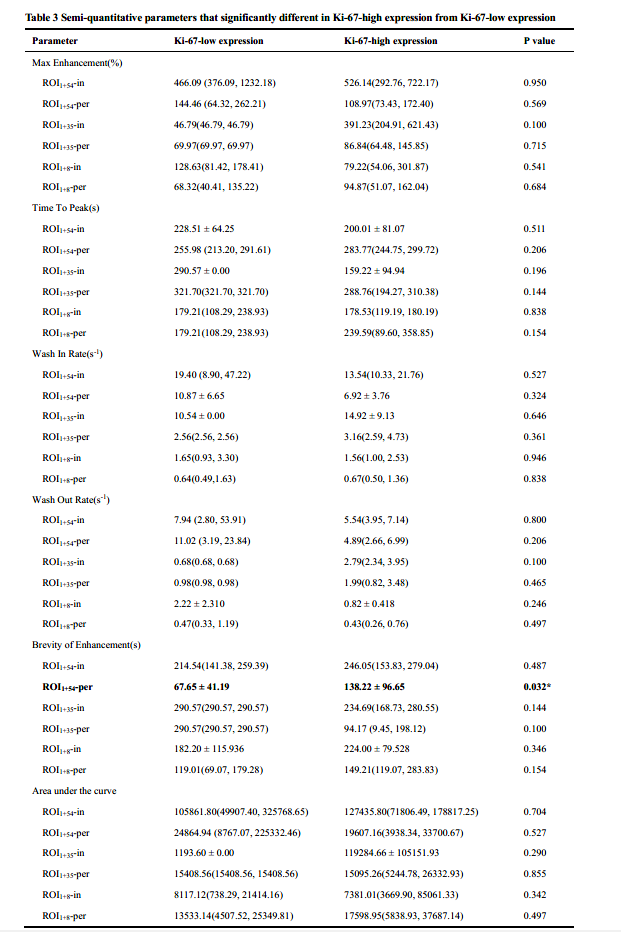
Table 3 Semi-quantitative parameters that significantly different in Ki-67-high expression from Ki-67-low expression
*indicates statistical significance at P < 0.05
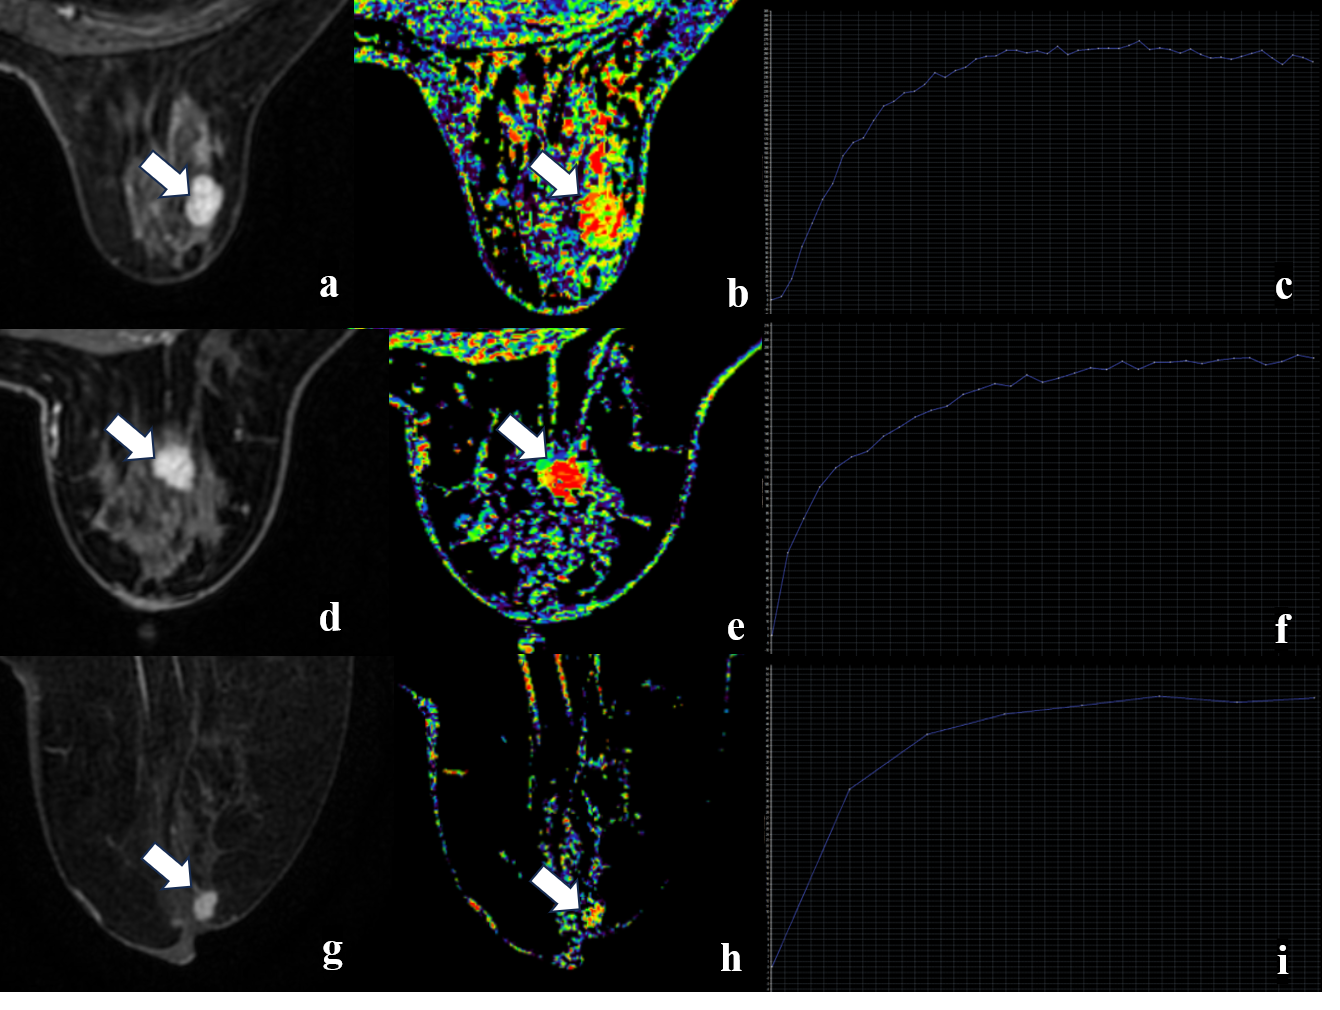
Figure1. Three examples of right invasive breast cancer
DISCO1+54, a-c; DISCO1+35, d-f; DCE1+8, g-I. Fig a, d and g were Maximum enhancement level; Fig b, e and h were Brevity of Enhancement maps; Fig c, f and i were TIC. The white arrow points to the tumor.
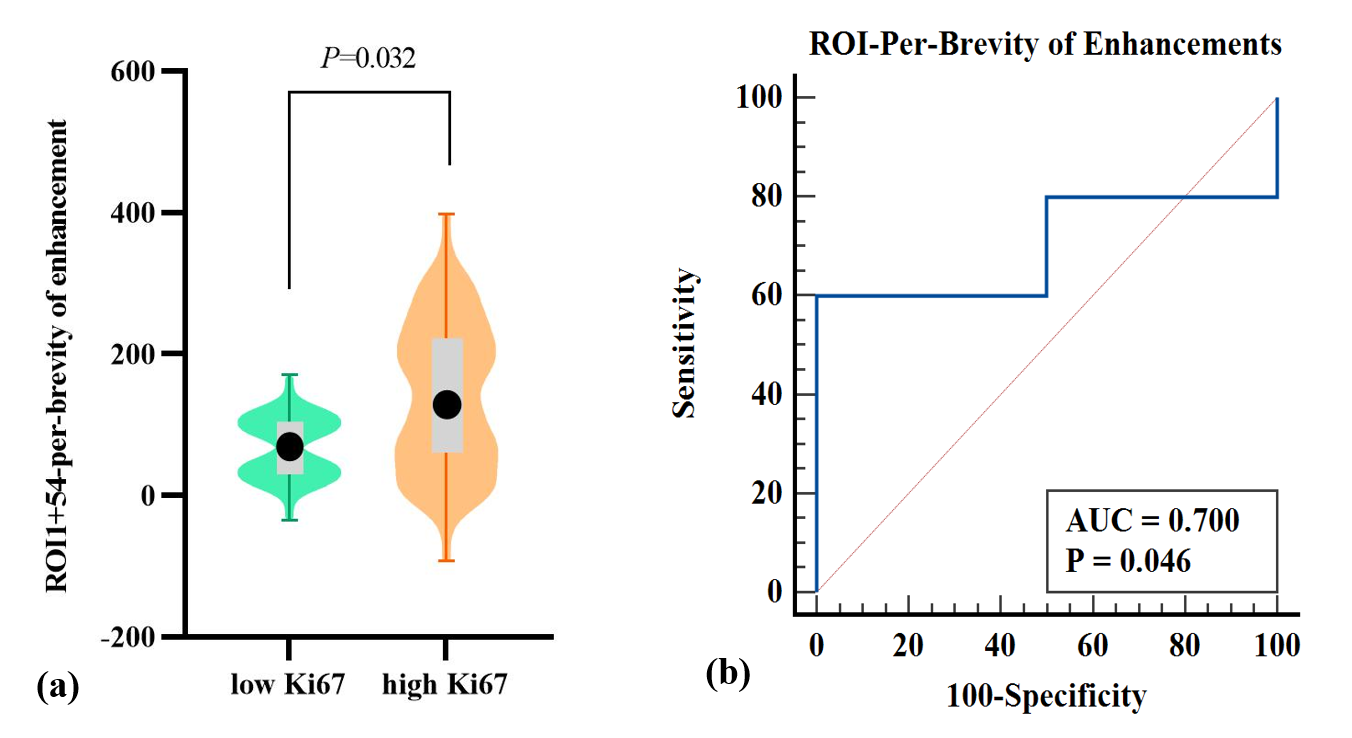
Figure 2. Violin plot of the comparison of parameters and the ROC curves of the ROI1+54-Per-Brevity of Enhancement.
(a) The width of the violin plot represents the probability density. The box plots represent the Q3, median, Q1 (the top line, black dot, and bottom line of the box, respectively), maximum and minimum values(the highest and lowest points of a line segment). (b) The area under the ROC curve was 0.700(95% CI, 0.511, 0.889; cut off value, 108.72s).