4603
Radiomics of voxelwise DCE-MRI TIC profiles map enables quantifying temporal and spatial hemodynamic heterogeneity in breast lesions1National Cancer Center/National Clinical Research Center for Cancer/Cancer Hospital & Shenzhen Hospital, Chinese Academy of Medical Sciences and Peking Union Medical College, Shenzhen, China, 2Paul C. Lauterbur Research Center for Biomedical Imaging, Shenzhen Institute of Advanced Technology, Chinese Academy of Sciences, Shenzhen, China, 3MR Research, GE Healthcare, Beijing, China, Beijing, China
Synopsis
Keywords: Breast, Cancer, Breast cancer; DCE-MRI; Hemodynamic heterogeneity
Motivation: An effective approach that enables simultaneous quantification of spatial and temporal heterogeneity based on DCE-MRI is lacking.
Goal(s): To develop a data-driven model-free approach to quantify spatial and temporal hemodynamic heterogeneity.
Approach: We introduced radiomics analysis based on voxelwise mapping of DCE-MRI time-intensity-curve (TIC) profiles to quantify temporal and spatial hemodynamic heterogeneity and investigated its value in differentiating malignant and benign breast lesions.
Results: Radiomics features and composition ratio of voxelwise TIC profiles showed good performance in differentiating malignant and benign breast lesions.
Impact: We provide a novel data-driven model-free approach for visualizing and quantifying temporal and spatial hemodynamic heterogeneity simultaneously, which shows potential for a variety of clinical implications concerning individualized management of breast lesions.
Introduction
Breast cancer, the leading cancer worldwide with high mortality rates1, exhibits tumor heterogeneity in angiogenesis at the intertumoral and intratumoral levels, impacting its behavior, growth, metastasis, treatment response, and prognosis2. Thus, there is a need for a noninvasive tool that can spatially and temporally visualize and quantify inter- and intratumoral hemodynamic heterogeneity. While DCE-MRI has demonstrated excellent lesion depiction and the ability to reveal hemodynamic heterogeneity3, currently available methods (qualitative, semiquantitative, and model-based quantitative analysis) have limitations in the clinical setting. Qualitative analysis lacks comprehensive information on intratumoral spatial hemodynamic heterogeneity, suffers from nonwhole-tumor coverage, ROI selection bias, and interobserver variability, and fails to reflect spatial heterogeneity quantitatively4. Similarly, semiquantitative analysis is constrained by ROI selection bias, average effects, and inconsistent definitions across studies5. Moreover, for quantitative analysis, the complexity and inconsistency of various quantitative ideal models, susceptible to multiple factors (i.e., MRI parameters, precontrast tissue T1 value, arterial input function, noise level, image deformation, and/or low temporal resolution, etc.) and artifacts, hinder their clinical applicability6,7. To overcome these limitations, we propose a novel model-free data-driven approach that visually maps hemodynamic heterogeneity and quantifies temporal and spatial heterogeneity through radiomics analysis of intralesional voxelwise time-intensity curve (TIC) profiles derived from DCE-MRI.Materials and methods
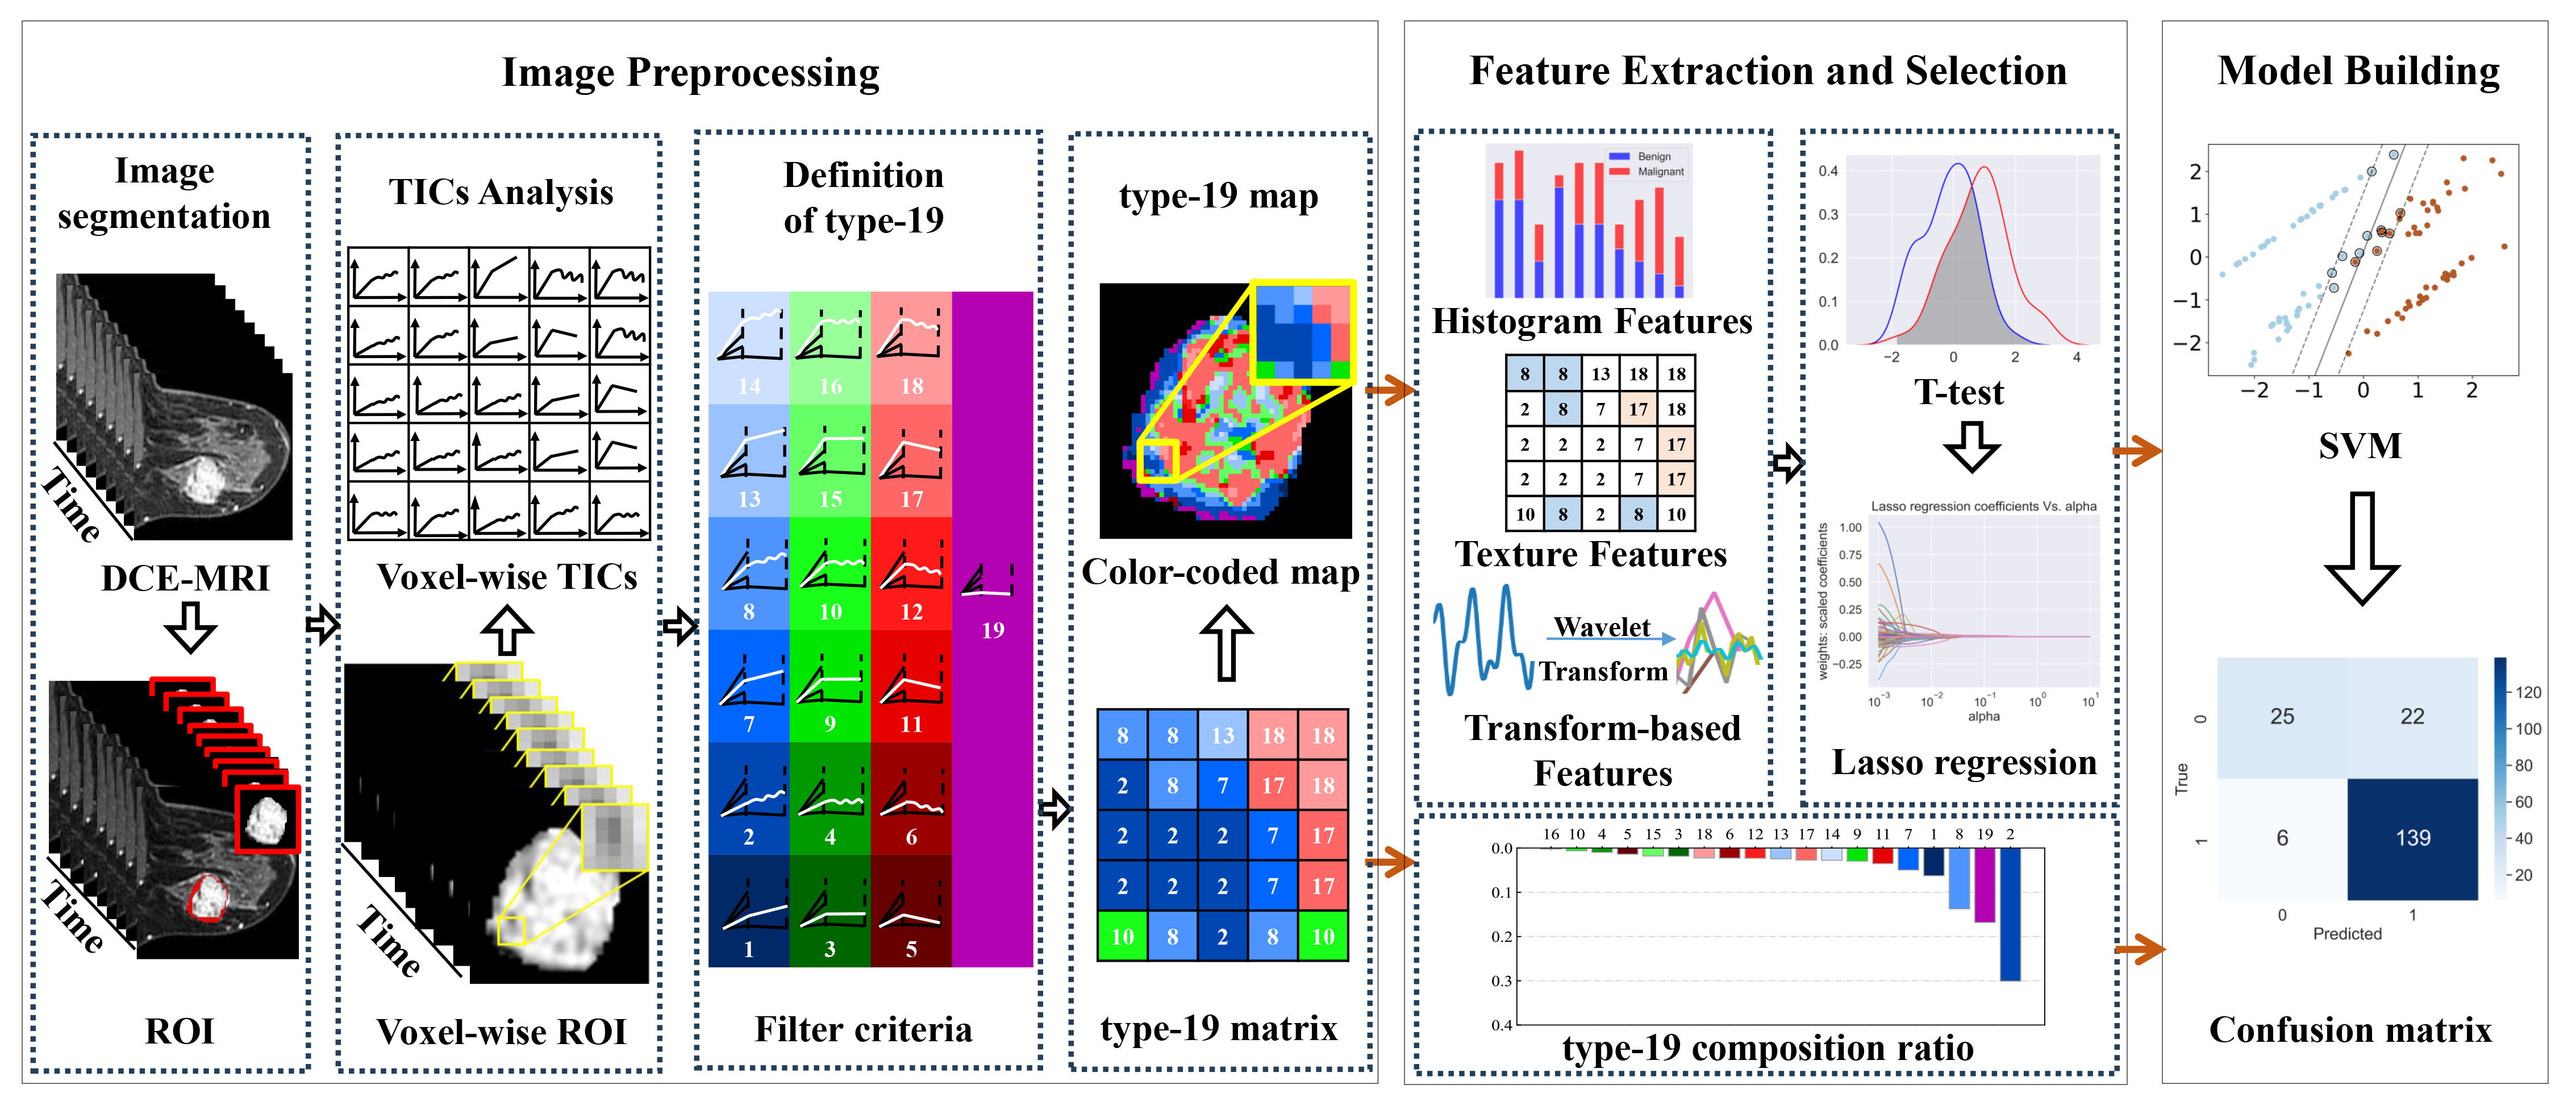
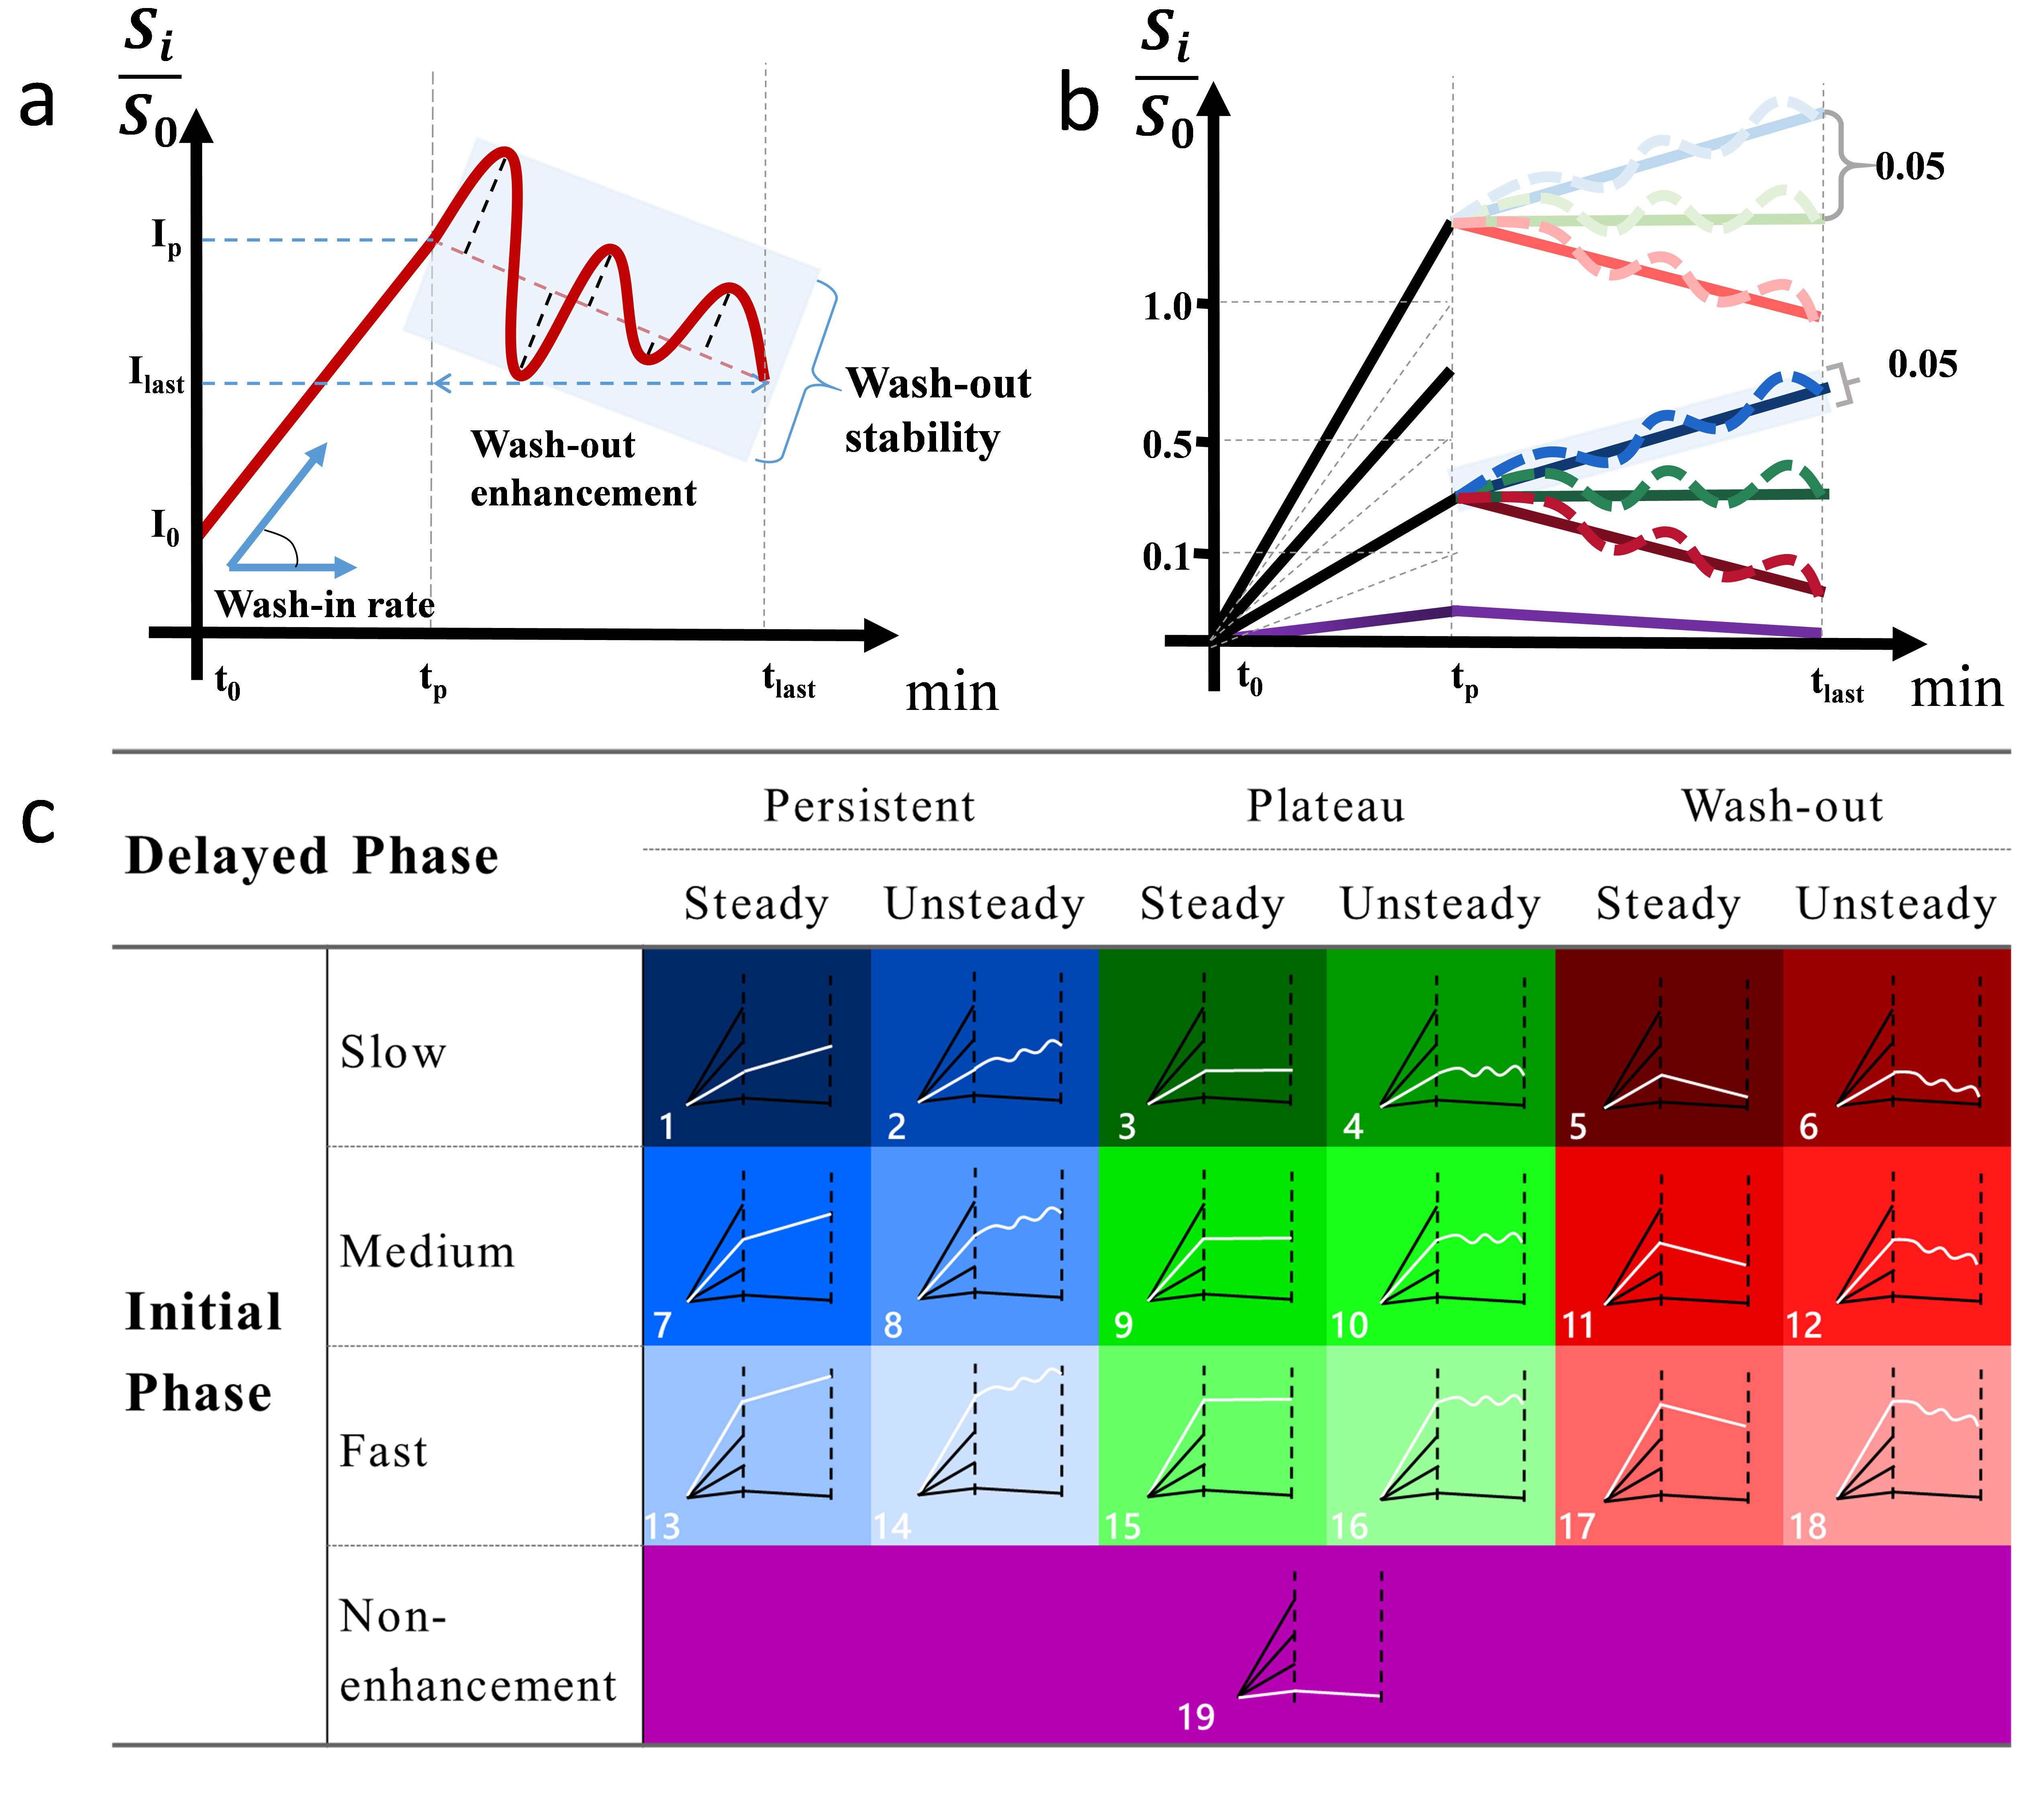
From December 2018 to August 2022, 428 patients with 639 breast lesions (malignant: benign = 495: 144) and available DCE-MRI data were retrospectively enrolled. The whole process of this study is shown in Figure 1. The TIC of each voxel within the manually segmented 3D lesion was classified into 19 subtypes based on wash-in rate (nonenhanced, slow, medium, and fast), wash-out enhancement (persistent, plateau, and decline), and wash-out stability (steady and unsteady) (Figure 2). The composition ratio, the spatial heterogeneity of these 19 TIC profile subtypes using radiomics analysis, and radiomics features based on third-phase DCE-MRI images were calculated as three feature sets separately, including type-19, type-19-radiomics, and phase-3-radiomics. Using the holdout scheme (training: testing = 7:3), Student’s t test and least absolute shrinkage and selection operator (Lasso) were performed sequentially to select the most informative features on the training set. In total, four models (type-19, type-19-radiomics, type-19-combined, and phase-3-radiomics) were built for distinguishing benign and malignant breast lesions using a support vector machine (SVM) classifier. Receiver operating characteristic (ROC) curve analysis was used to evaluate the performance of the four models on the cross-validation set and independent testing set with the area under the curve (AUC) compared using the DeLong test.Results and Discussion
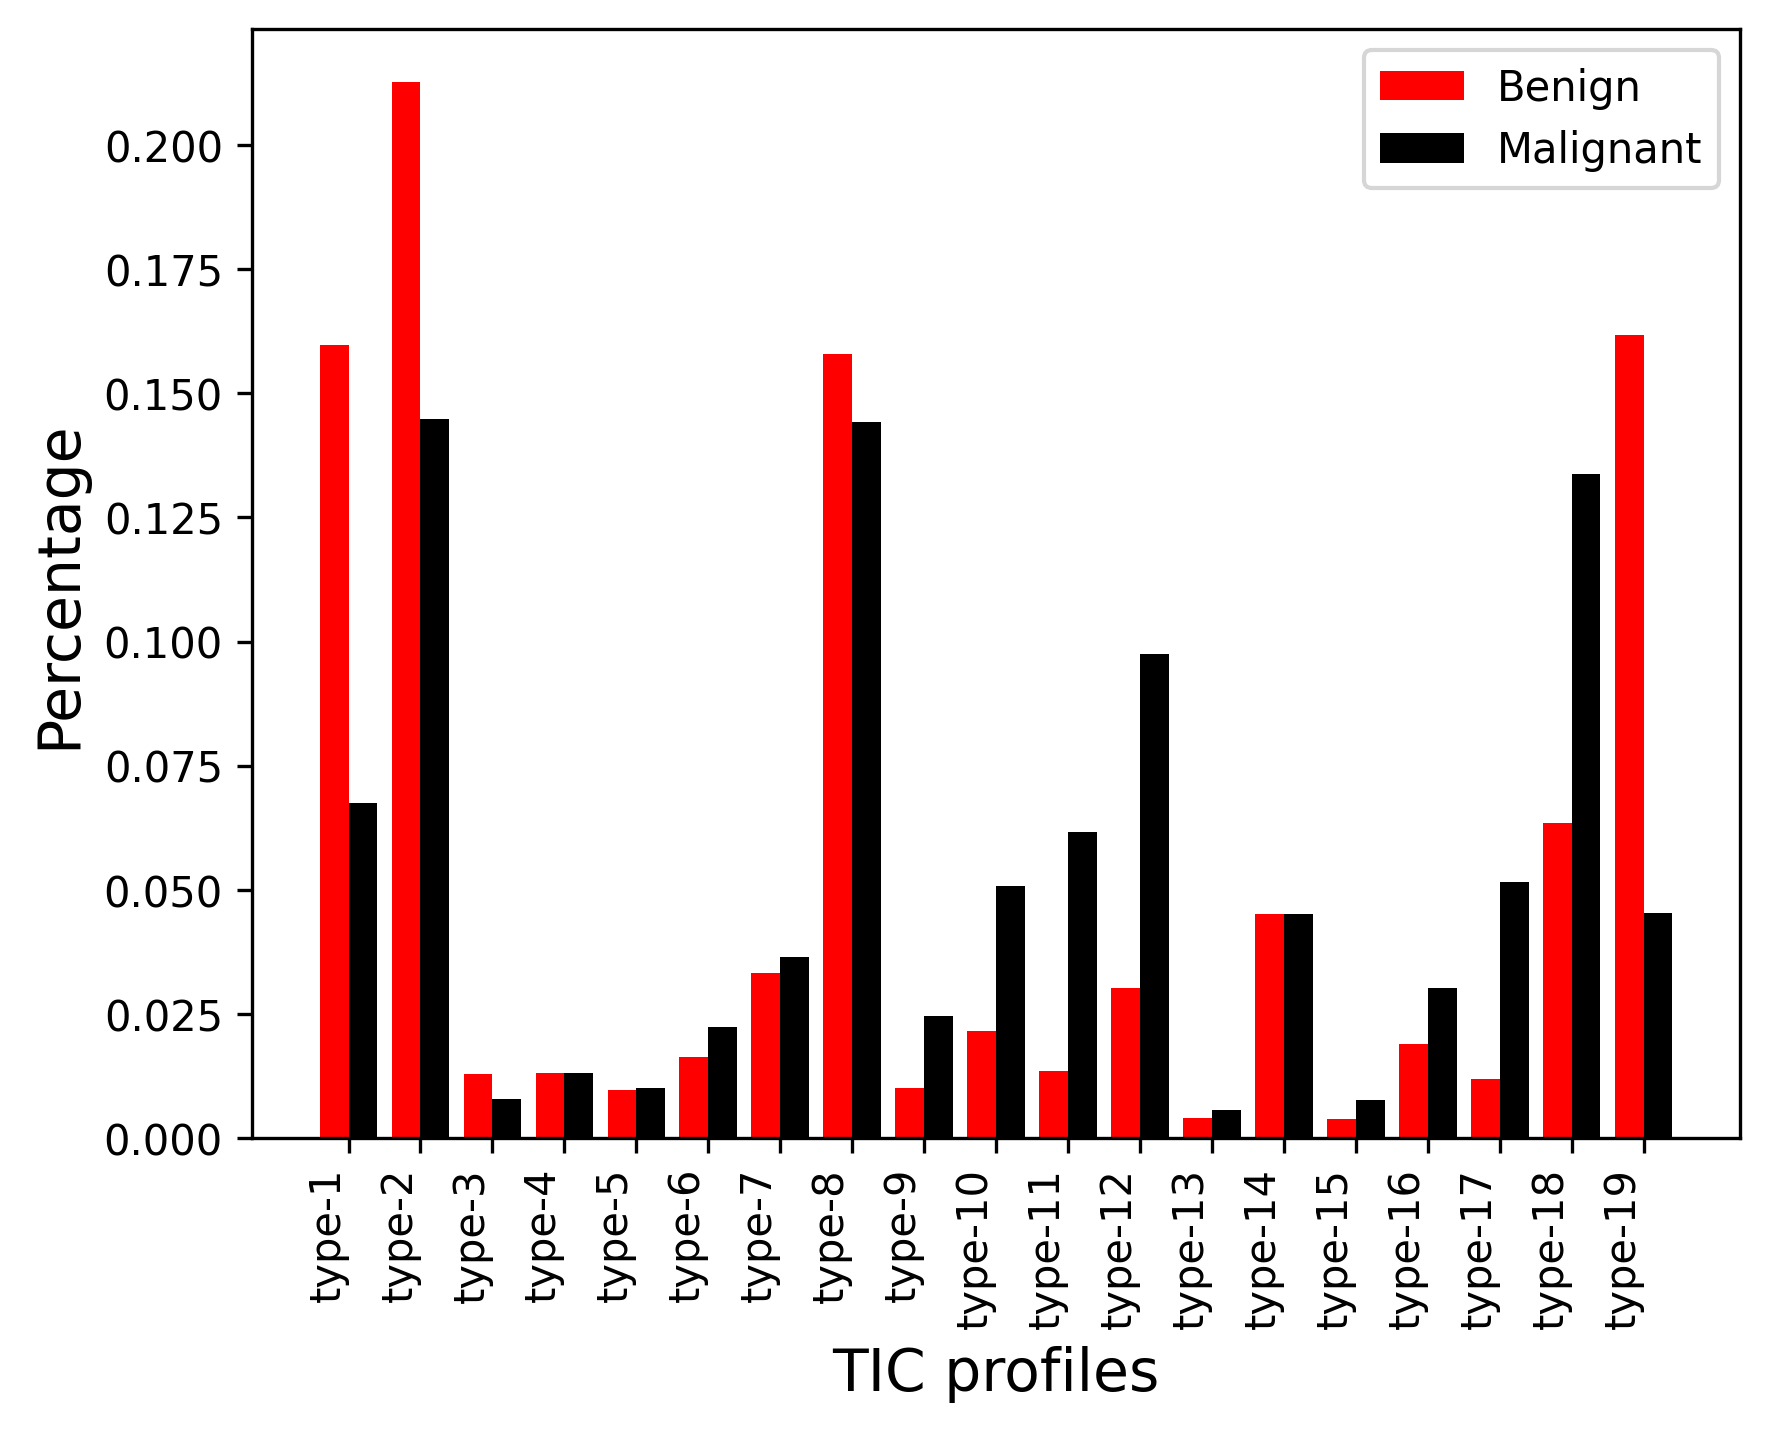
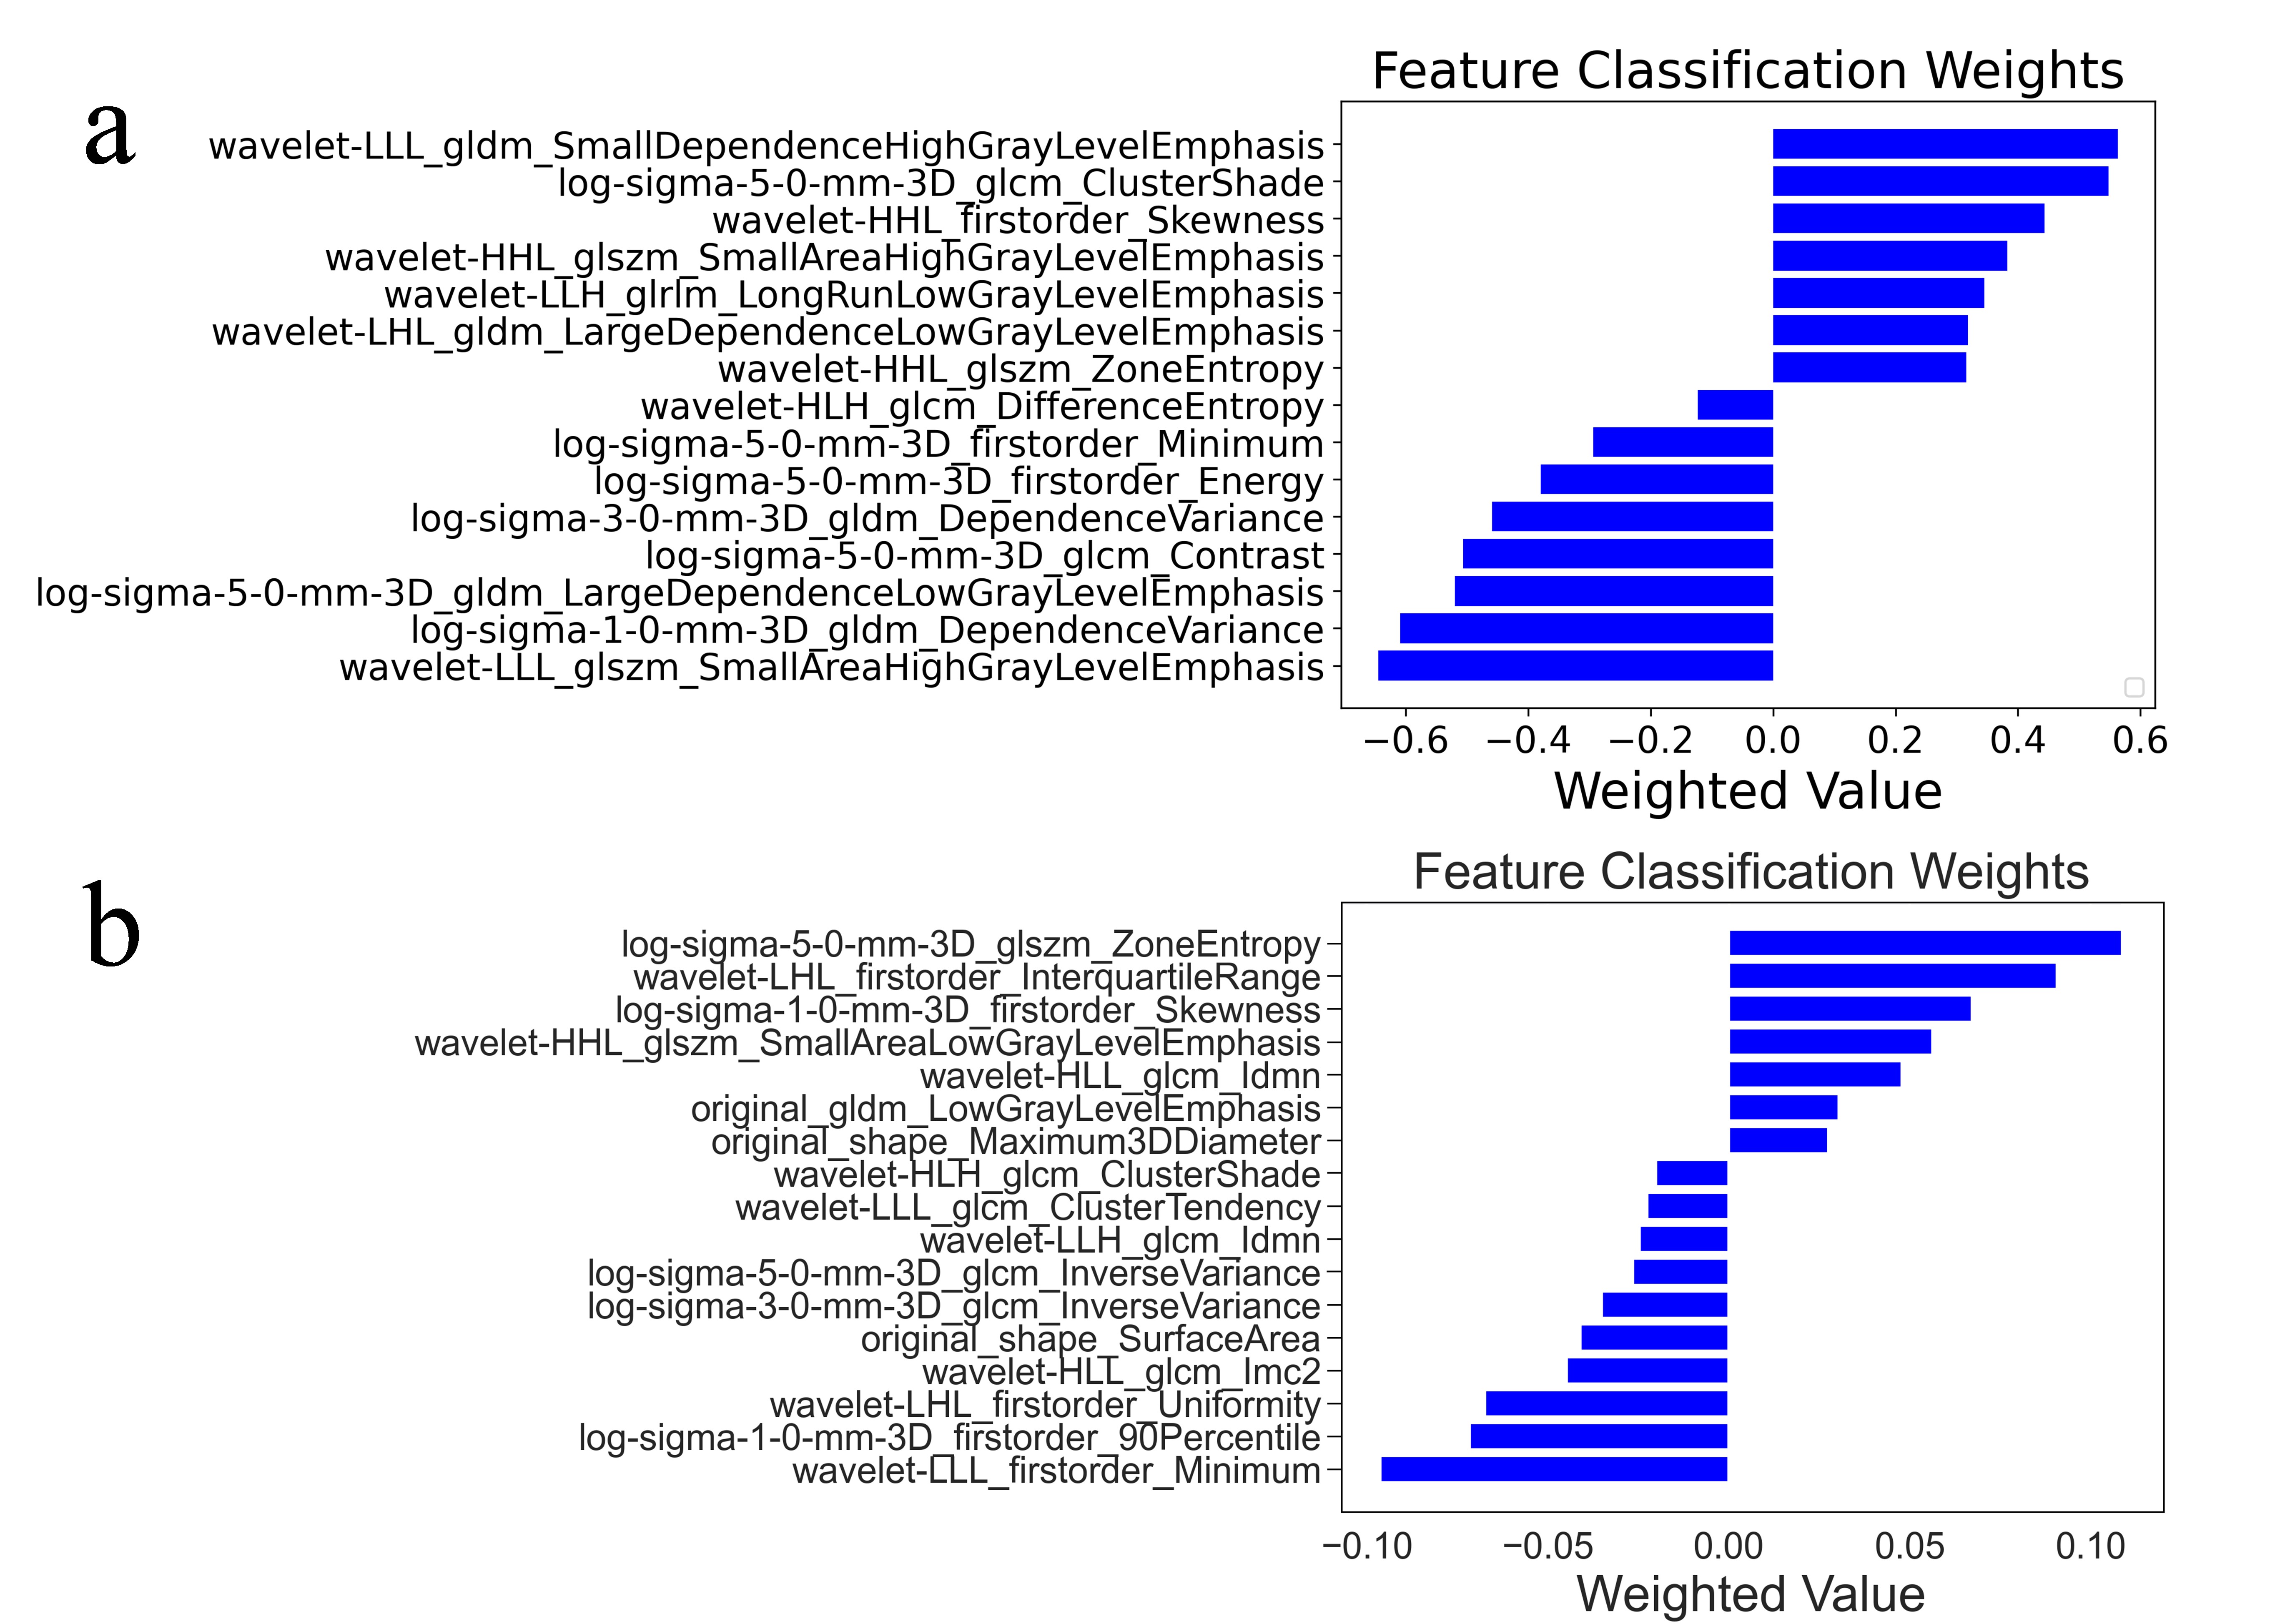
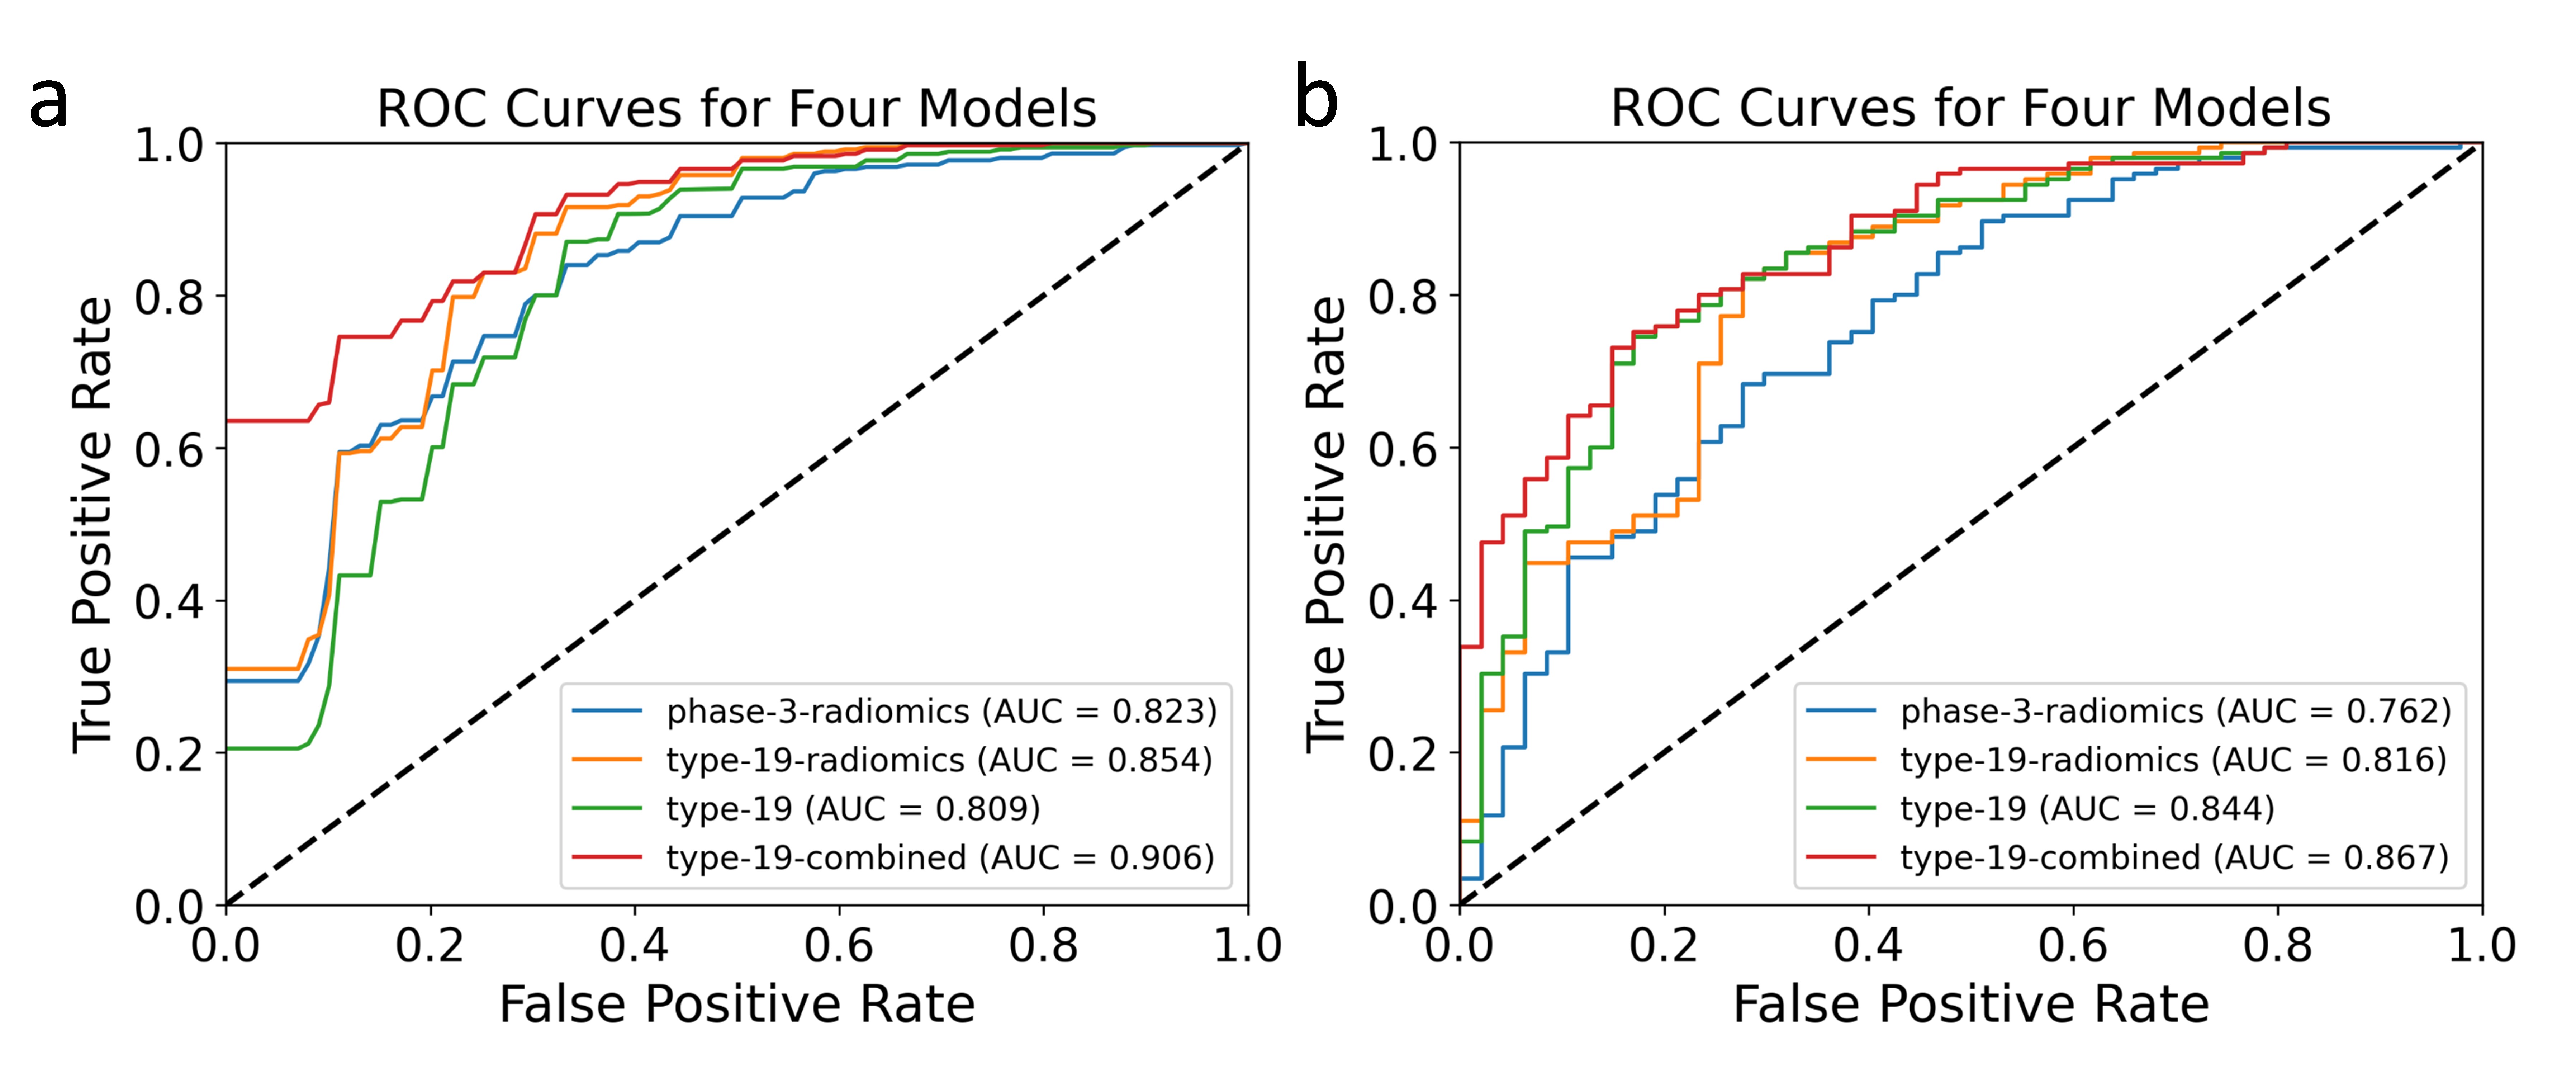
As shown in Figure 3, for all the voxels of the benign lesions, there was a significantly higher percentage of the 1st, 2nd, 3rd and 19th subtypes and a lower percentage of the 9th, 10th, 11th, 12th, 15th, 16th, 17th, and 18th subtypes than that for the voxels of malignant lesions. For benign breast lesions, the slow wash-in and persistent enhancement TIC profiles (2nd+ 1st subtypes) were predominant, followed by the medium wash-in and persistent enhancement with oscillation (8th subtype) and no-enhancement TIC profile (19th subtype). Unlike benign lesions with only a few predominant TIC profile subtypes, TIC profiles for malignant lesions were more evenly distributed. Through t tests and Lasso regression, 15 and 17 radiomics features were selected from the type-19 map and phase-3 DCE-MRI, respectively, among which texture features were predominant, suggesting that spatial heterogeneity makes the major contribution to differentiation, as shown in Figure 4. In differentiating the malignancy levels of lesions, both 10-fold cross-validation and independent testing showed that the type-19-combined model significantly outperformed the phase-3-radiomics model (AUC = 0.906 vs. 0.823, P < 0.001, AUC = 0.867 vs. 0.762, P = 0.026). However, in 10-fold cross-validation and independent testing, there was no significant difference in performance observed between the phase-3-radiomics model and the type-19 model (AUC = 0.823 vs. 0.809, P = 0.577, AUC = 0.762 vs. 0.844, P = 0.085), between the phase-3-radiomics model and the type-19-radiomics model (AUC = 0.823 vs. 0.854, P = 0.182, AUC = 0.762 vs. 0.816, P = 0.200), or between the type-19-radiomics model and the type-19 model (AUC = 0.854 vs. 0.809, P = 0.073, AUC = 0.816 vs. 0.844, P = 0.454) (Figure 5).Conclusion
In addition to conventional radiomics analysis based on single-phase DCE-MRI, radiomics analysis and composition ratio based on voxelwise mapping of DCE-MRI time-intensity-curve (TIC) profiles provide a novel approach for quantifying temporal and spatial hemodynamic heterogeneity simultaneously and show potential for the differentiation of malignant and breast lesions.Acknowledgements
We would like to thank Dr. Cui from GE Healthcare, Beijing China for his technical support.References
1. Giaquinto A N, Sung H, Miller K D, et al. Breast Cancer Statistics, CA Cancer J Clin, 2022, 72(6): 524-541.
2. Lee JY, Lee KS, Seo BK, et al.Radiomic machine learning for predicting prognostic biomarkers and molecular subtypes of breast cancer using tumor heterogeneity and angiogenesis properties on MRI, Eur Radiol, 2022, 32(1) : 650-660.
3. Leithner D, Wengert G.J, Helbich T.H, et al. Clinical role of breast MRI now and going forward, Clinical Radiology, 2018, 78(8): 700-714.
4. Goto M, Ito H, Akazawa K, et al. Diagnosis of breast tumors by contrast-enhanced MR imaging: comparison between the diagnostic performance of dynamic enhancement patterns and morphologic features, J Magn Reson Imaging, 2007, 25(1):104-112.
5. Liu HL, Zong M, Wei H, et al. Differentiation between malignant and benign breast masses: combination of semi-quantitative analysis on DCE-MRI and histogram analysis of ADC maps, Clin Radiol, 2018, 73(5):460-466.
6. Winfield JM, Payne GS, Weller A, et al. DCE-MRI, DW-MRI, and MRS in Cancer: Challenges and Advantages of Implementing Qualitative and Quantitative Multi-parametric Imaging in the Clinic. Top Magn Reson Imaging, 2016, 25(5): 245-254.
7. Roberto G F, Sandra B G, Anwar R P, et al. How clinical imaging can assess cancer biology, Insights into Imaging, 2019, 10(1):1-35.
Figures