4601
Quantitative Background Parenchymal Enhancement: Association with Lifetime Risk Factors on Breast Cancer Screening MRI1Department of Radiological Sciences, University of California, Los Angeles, Los Angeles, CA, United States, 2Department of Bioengineering, University of California, Los Angeles, Los Angeles, CA, United States
Synopsis
Keywords: Breast, Screening, Background parenchymal enhancement; Quantitative BPE; Breast cancer; Lifetime risk; BRCA germline mutation
Motivation: Breast MRI background parenchymal enhancement (BPE) has been associated with breast cancer risk. The association of BPE with various breast cancer lifetime risk factors remains controversial.
Goal(s): Our goal was to determine which risk factors are associated with BPE, specifically quantitative BPE due to variability in qualitative BPE.
Approach: We used linear regression to evaluate the association between quantitative BPE and BRCA gene mutation status, age, body mass index (BMI), menopausal status, hormonal treatment, and fibroglandular tissue (FGT) level.
Results: Both univariate and multivariate analyses of quantitative BPE showed significant correlations with age, BMI, menopausal status, and FGT level.
Impact: Quantitative background parenchymal enhancement (BPE) is correlated with lifetime risk factors, such as age, BMI, menopausal status, and FGT level, on breast cancer screening MRI. This can provide potential insight into the cancer pathophysiological mechanisms underlying lifetime risk models.
Introduction
Predicting breast cancer risk can guide patient-specific screening approaches. Previous studies have revealed a possible correlation between background parenchymal enhancement (BPE) and breast cancer risk1. However, the correlation between BPE and lifetime risk factors in existing risk models remains uncertain2–4. Such studies may uncover the role of BPE as an underlying physiological factor behind the existing risk models. Radiologist-assigned BPE categories have high variability, emphasizing the need for quantitative BPE studies. Our study aimed to explore which clinical factors in classical risk models are associated with quantitative BPE measurements among radiologically normal women. Those women had different lifetime risks and BRCA mutation status. Additionally, we investigated whether differences in BPE remained after adjusting for clinical factors that might influence BPE.Methods
In this retrospective study, we reviewed 4,859 bilateral breast MRI exams from women between January 2017 and December 2019. The exclusion criteria include patients with prior breast cancer, and MRI scans not for screening purposes. A fully automated method was utilized for fibroglandular tissue (FGT) and breast tissue segmentation5. We calculated six quantitative BPE measurements on DCE-MRI: percent enhancement (PE) features including PEFGT and PEBreast, signal enhancement ratio (SER) features including SERFGT and SERBreast, and principal component analysis-based features6 including initial enhancement ratio (IER) and delayed enhancement ratio (DER). Fig. 1 shows an overview of the BPE quantification process.Linear regression analysis evaluated the association between BPE measurements and clinical factors, including age, BMI, menopausal status, hormonal treatment, FGT level, and BRCA gene mutation status. We reported correlation coefficients with 95% confidence intervals and corresponding p-values with a significance level of 0.05. We compared BPE measurements between patients with different BRCA1/2 mutation status and lifetime risks higher and lower than 20%. We further applied propensity score matching to adjust for confounders that demonstrated correlation with BPE in linear regression analysis and compared BPE measurements in matched groups. All comparisons were reported adjusted p-values with a significance level of 0.1 after accounting for multiple testing issues.
Results
The clinical and radiographic characteristics of the 535 patients in the final cohort are summarized in Fig. 2. Univariate analysis significantly correlated age and menopausal status with all BPE measurements, while multivariate analysis correlated only menopausal status with all BPE measurements. Given that PEBreast is one of the most used calculation methods for quantitative BPE7, we show its linear regression results in Fig. 3. Both univariate and multivariate analyses of PEBreast showed significant correlations with age, BMI, menopausal status, and FGT level. Specifically, higher PEBreast was correlated with younger age, lower BMI, premenopausal status, and higher FGT levels.Before adjusting for confounders, high-risk women without BRCA mutation were significantly different from women without high-risk and women with BRCA mutation in PEBreast, SERFGT, IER, and DER values. After adjusting for confounders, including age, BMI, menopausal status, and FGT level, high-risk women without BRCA mutation showed no significant difference from women without high risk, but still showed significant differences from BRCA carriers in PEFGT and SERFGT (Fig. 4). Fig. 5 presents example images of two high-risk women. The woman without BRCA mutation (Fig. 5a) has higher BPE than the BRCA1-positive woman (Fig. 5b).
Discussion
In our study, we found clinical factors significantly affecting BPE, including age, BMI, menopausal status, and FGT level. BPE is known to be hormone-sensitive, which could explain the potential reason for the impact of age and menopausal status on BPE. FGT levels and BMI are related to the amount of body fat. As fat can be an important source of estrogen8, the effects of FGT levels and BMI on BPE may be attributed to the amount of hormone produced by fat. After adjusting for these confounding factors, the difference in BPE between BRCA carriers and non-carriers in high-risk women can still be observed. While high BPE levels have been associated with a greater risk of breast cancer, our findings suggest BRCA mutation carriers, typically at the highest cancer risk, had lower BPE than non-carriers. These results suggest continuous surveillance of breast cancer risk in BRCA mutation carriers with high levels of BPE.Conclusion
Quantitative BPE measures are associated with age, BMI, menopausal status, and FGT level. This finding provides a potential explanation for the cancer pathophysiological mechanisms underlying the lifetime risk model from the perspective of BPE. In the future, additional research is necessary to determine if quantitative BPE can function as an independent risk factor enhancing breast cancer risk stratification.Acknowledgements
No acknowledgement found.References
Figures
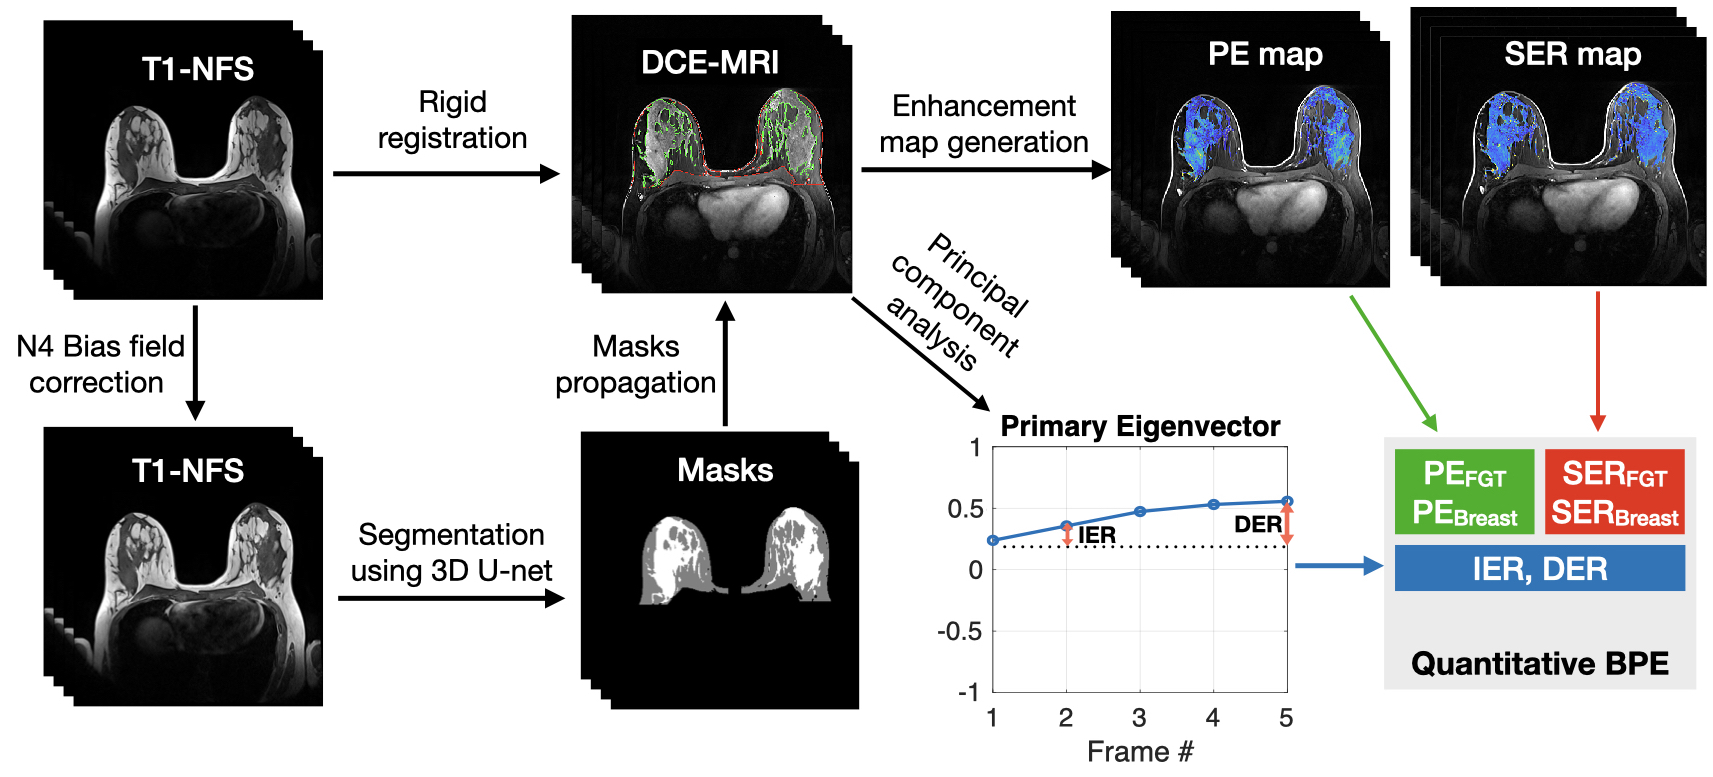
Fig. 1 Overview of BPE quantification process. The three-dimensional volumes of the breast (red outlines) and FGT (green) were segmented on T1-weighted non-fat-suppressed (T1-NFS) images and transferred to DCE-MRI. Two Enhancement maps were generated based on the masks, including the percent enhancement (PE) map and signal enhancement ratio (SER) map, from which PEFGT, PEBreast, SERFGT, and SERBreast were derived. The primary eigenvector of DCE-MRI was used to calculate another two BPE measurements, i.e., initial enhancement ratio (IER) and delayed enhancement ratio (DER).
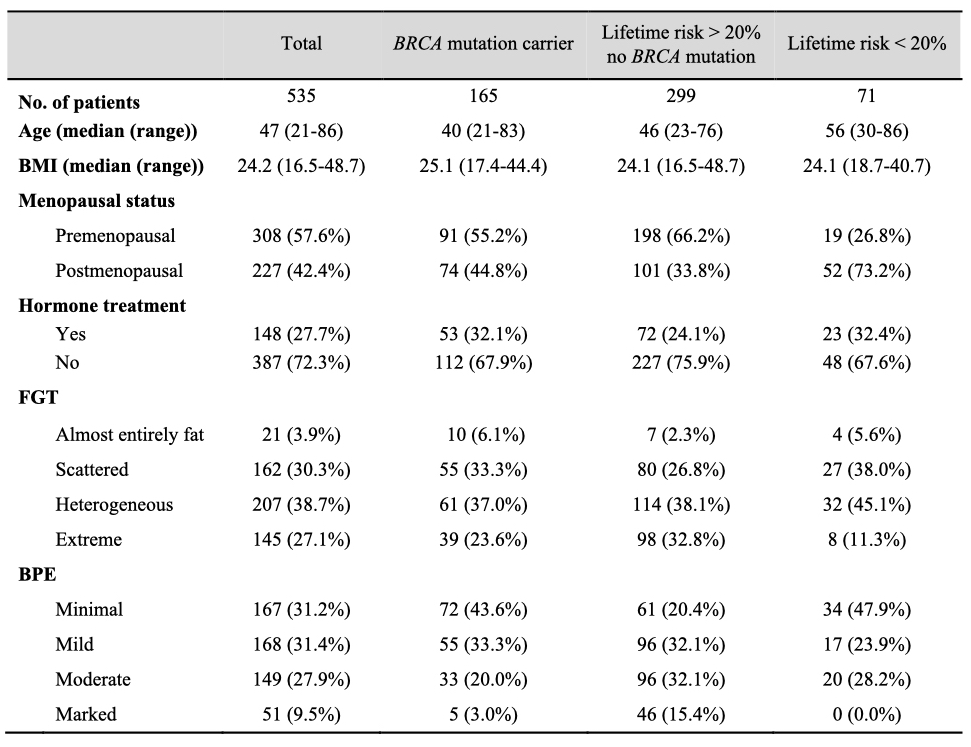
Fig. 2 Characteristics of study subjects. BMI, body mass index; BPE, background parenchymal enhancement; FGT, fibroglandular tissue.
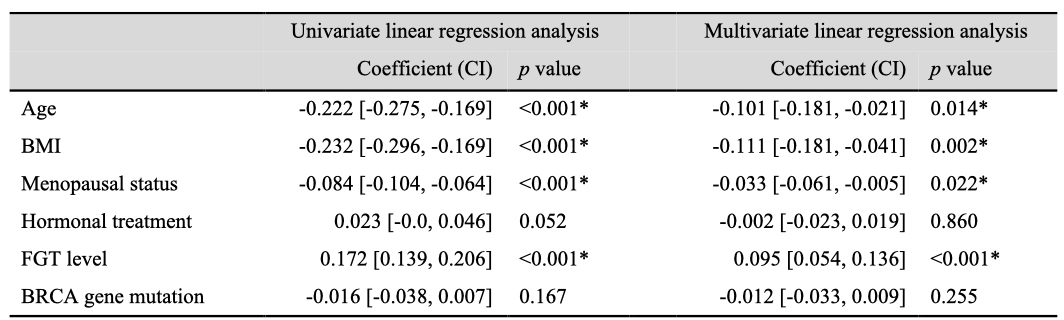
Fig. 3 Univariate and multivariate linear regression analysis for PEBreast increase in all women. Asterisks indicate significant differences with an unadjusted p-value < 0.05. BMI, body mass index; BPE, background parenchymal enhancement; PE, percent enhancement; SER, signal enhancement ratio; IER, initial enhancement ratio; DER, delayed enhancement ratio; FGT, fibroglandular tissue; CI, confidence interval.
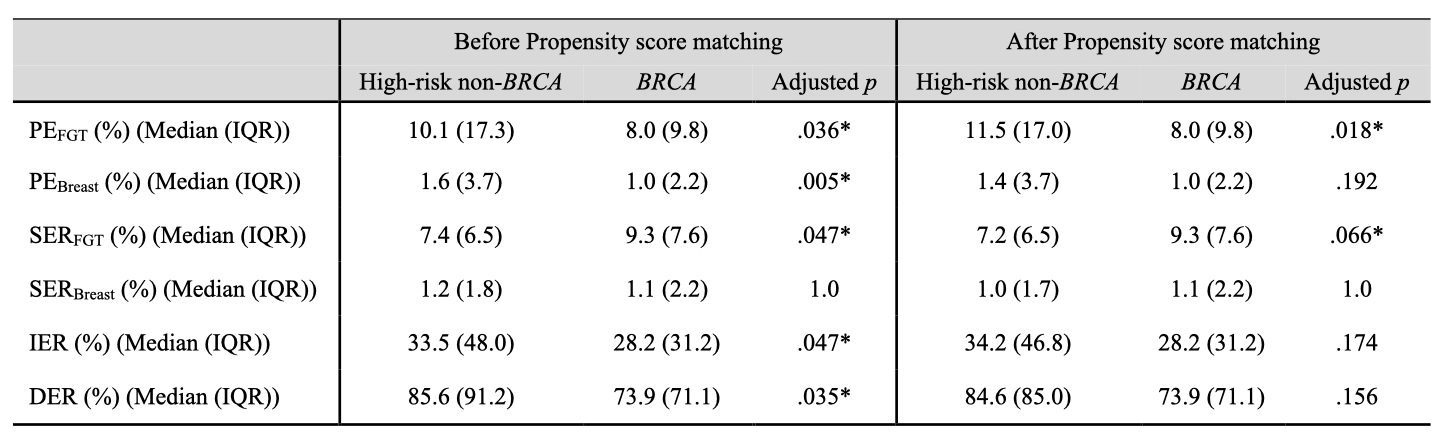
Fig. 4 Quantitative BPE comparison between BRCA carriers and non-carriers using Mann–Whitney U-test before and after propensity score matching adjusted for age, BMI, menopausal status, hormonal treatment history within six months before MRI, and FGT level. Asterisks indicate significant differences with adjusted p-value < 0.1. BPE, background parenchymal enhancement; PE, percent enhancement; SER, signal enhancement ratio; IER, initial enhancement ratio; DER, delayed enhancement ratio; FGT, fibroglandular tissue; IQR, interquartile range.
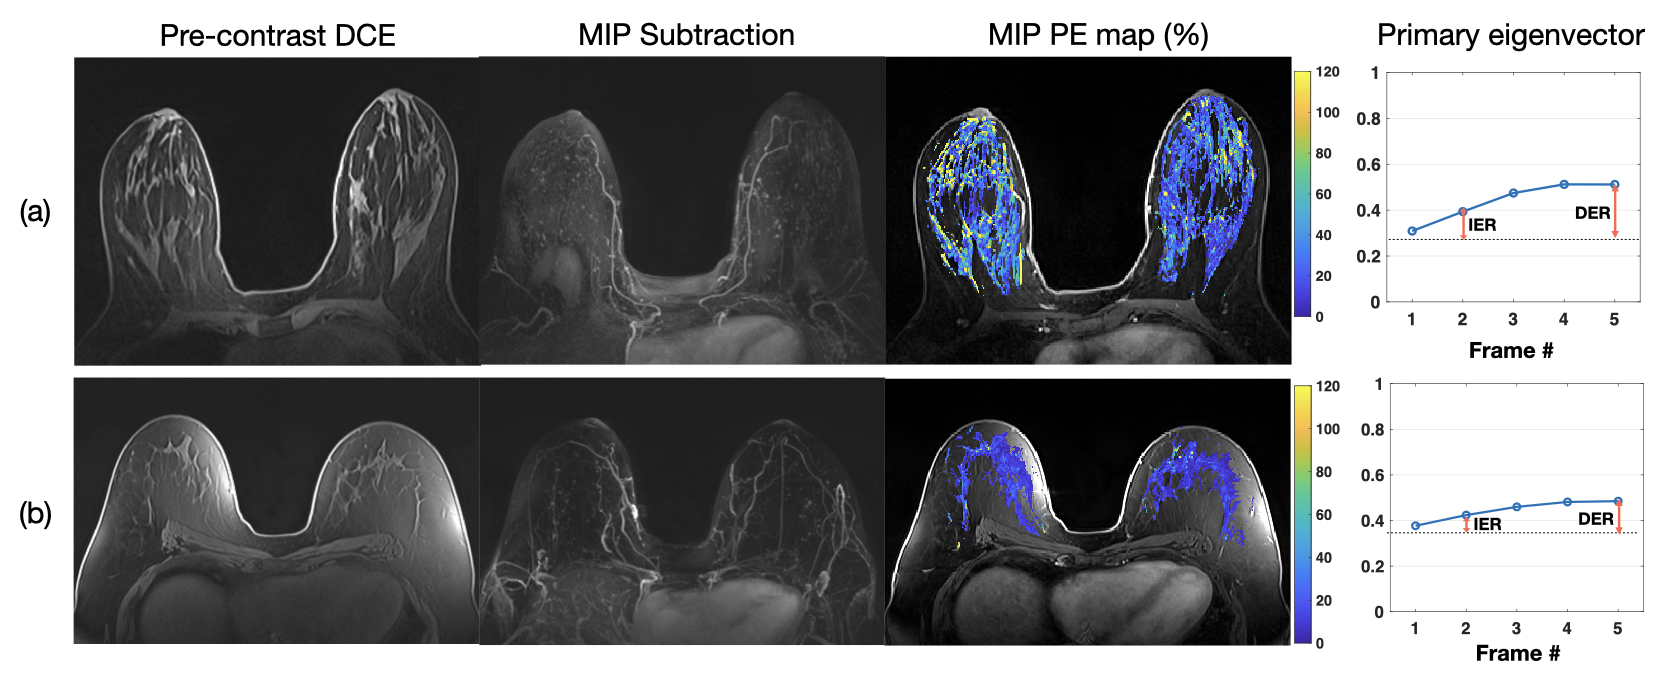
Fig. 5 MRIs and quantitative BPE illustration of two non-dense-breast overweight/obesity postmenopausal women with (a) high-risk without BRCA mutation and (b) BRCA mutation. MRI images include pre-contrast DCE MRI, MIP of first post-contrast subtraction DCE MRI, MIP of ten slices of PE map, and the primary eigenvector used to measure IER and DER. MIP, maximum-intensity-projection; PE, percent enhancement; IER, initial enhancement ratio; DER, delayed enhancement ratio.