4596
Reliability and repeatability of texture features extracted from quantitative T1 & T2 of fresh breast tumour specimens at 3T1Newcastle Magnetic Resonance Centre, Translational and Clinical Research Institute, Faculty of Medical Sciences, Newcastle University, Newcastle, United Kingdom, 2Institute of Medical Sciences, School of Medicine, Medical Sciences and Nutrition, University of Aberdeen, Aberdeen, United Kingdom, 3Pathology Department, Aberdeen Royal Infirmary, Aberdeen, United Kingdom, 4Breast Unit, Broomfield Hospital, Chelmsford, United Kingdom
Synopsis
Keywords: Breast, Breast
Motivation: Quantitative T1/T2 is known to alter in the presence of breast tumours, and texture analysis offers a measure to characterise unique tumour morphology.
Goal(s): We aimed to determine the reliability and repeatability of texture features extracted from T1/T2 images across acquisitions.
Approach: Five repeated acquisitions of T1/T2 were performed on 20 breast tumours to derive texture features of Mean, Standard deviation, Kurtosis, Skewness, and Entropy.
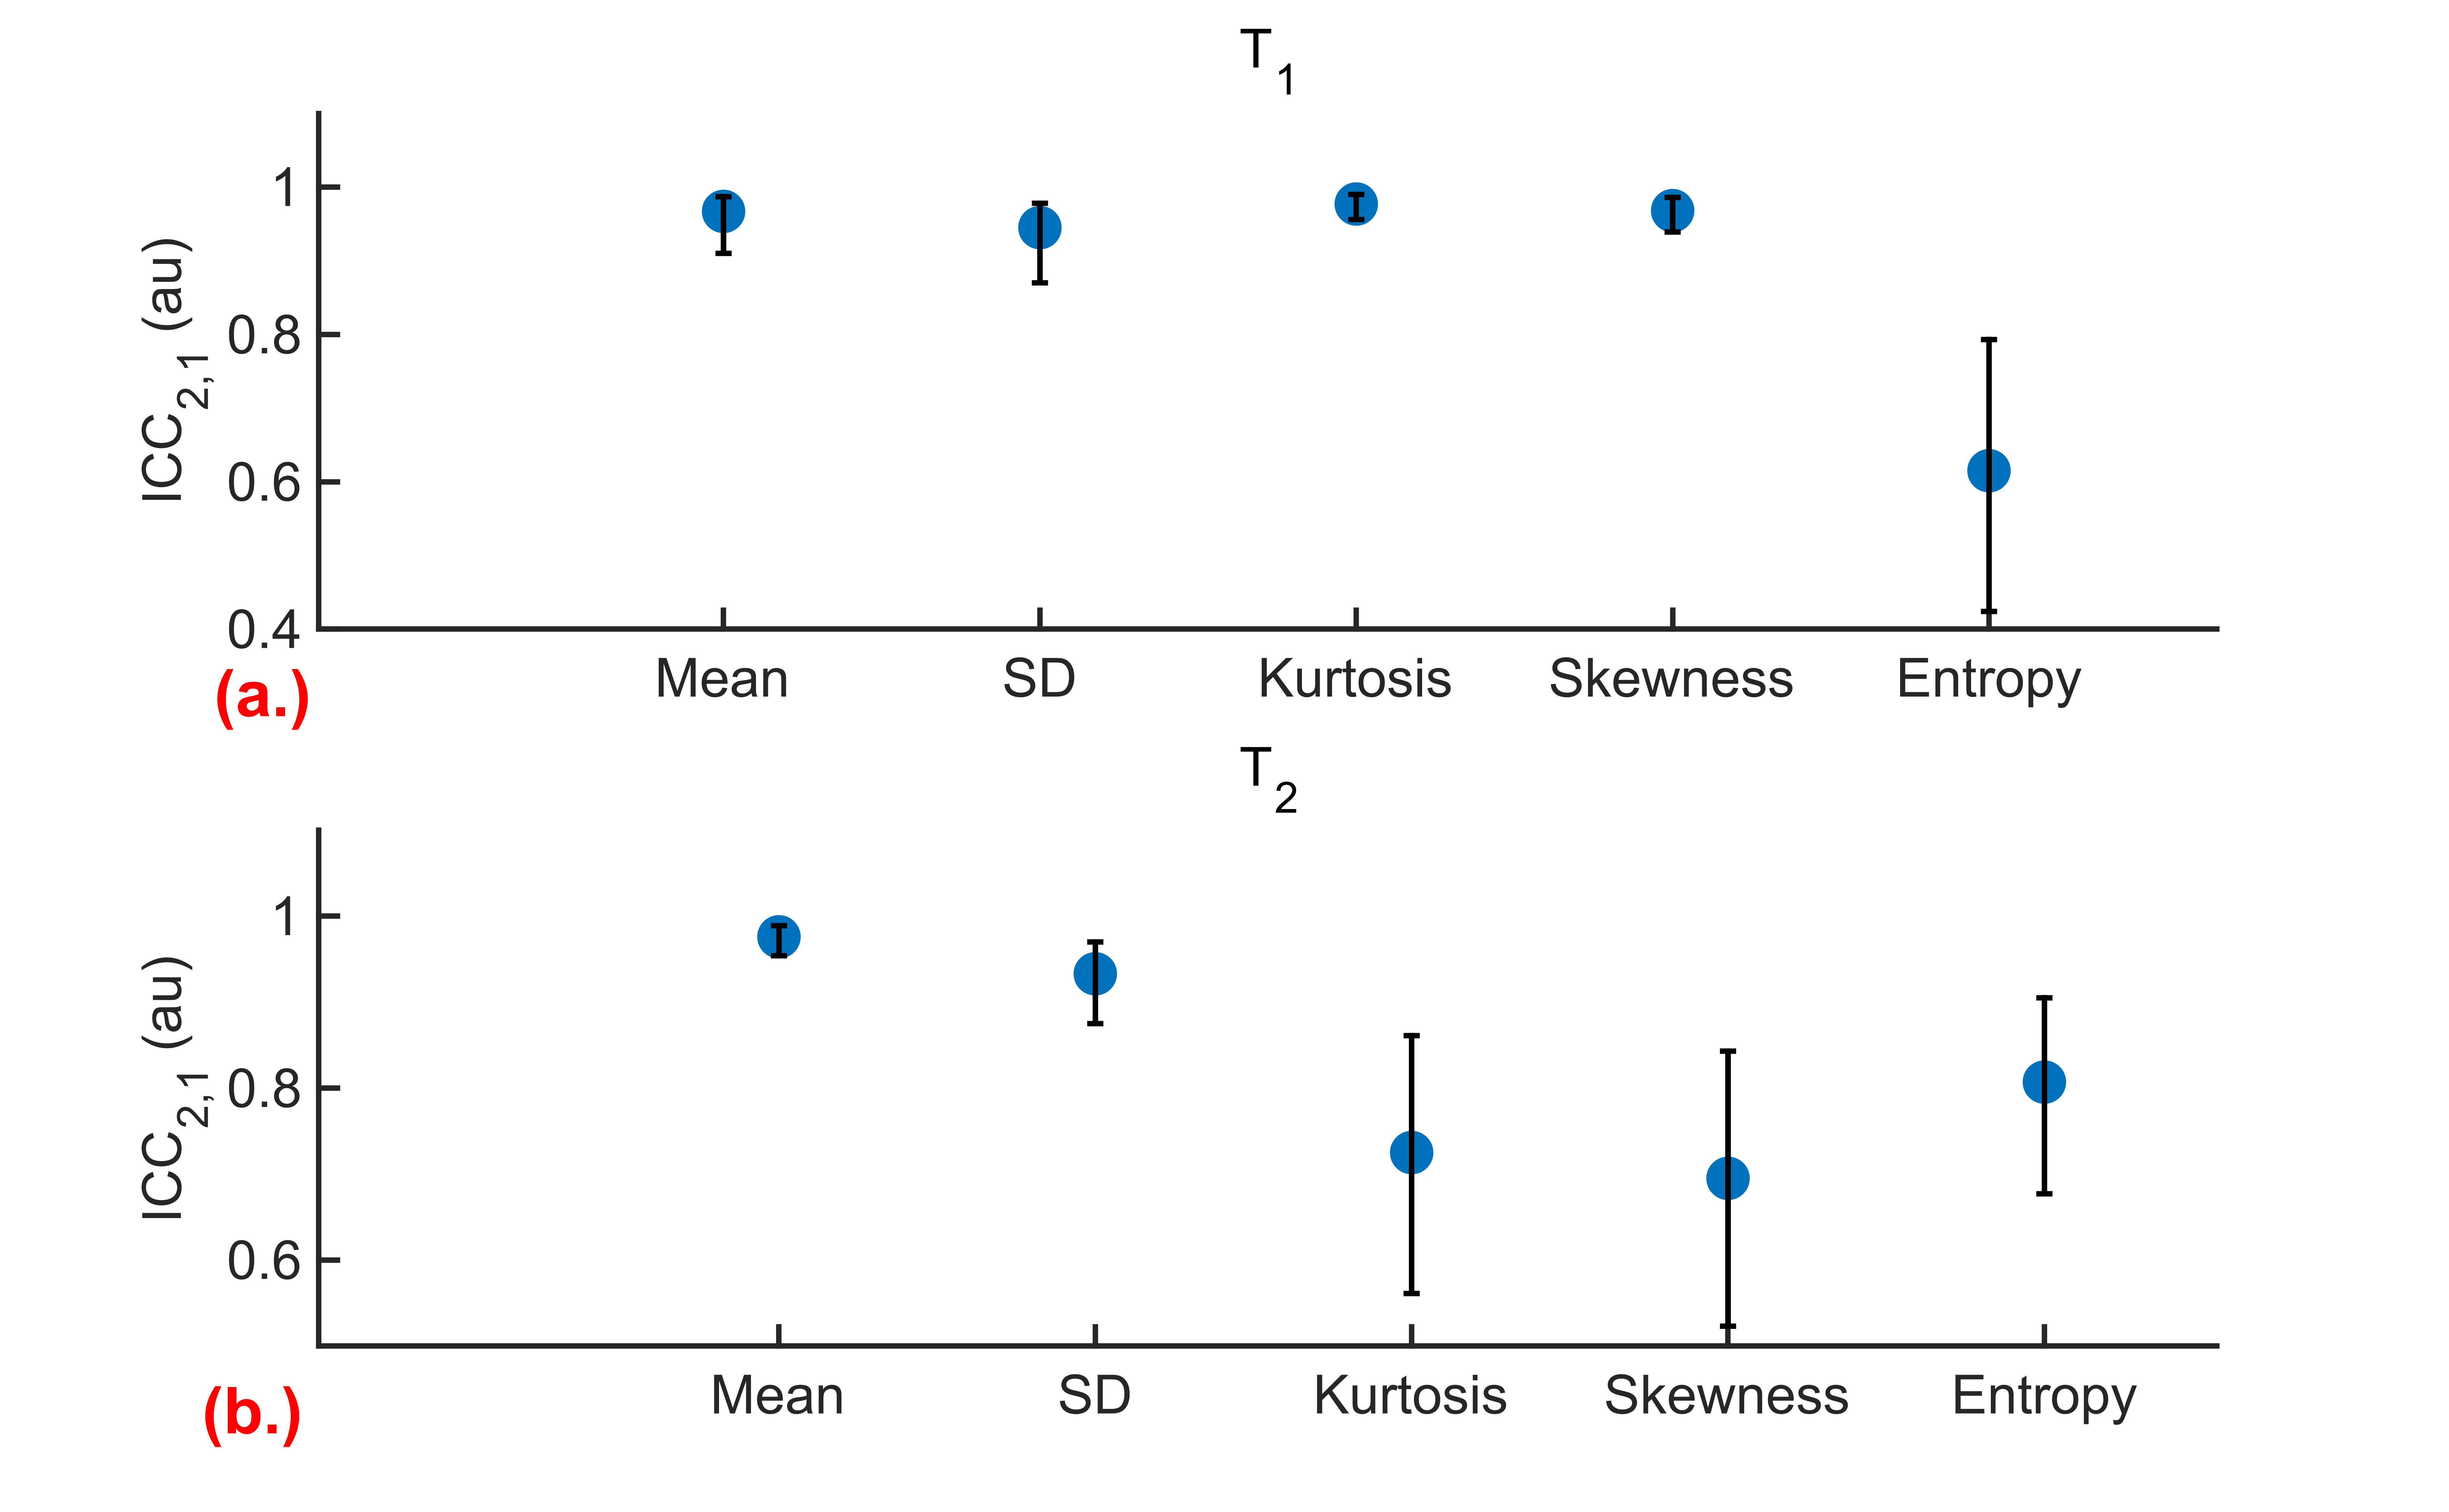
Results: There was excellent reliability and repeatability in all T1 texture features, except moderate reliability in Entropy. There was good to excellent reliability and excellent repeatability for most T2 textures, except Kurtosis and Skewness.
Impact: The reliability and repeatability of texture features extracted from relaxation property maps serves as a corner stone towards higher order analysis for breast cancer, to support clinical decision with confidence.
Introduction
Breast cancer is the most common cancer in women1, and precise understanding of disease load is central for precision treatment. Relaxation properties of T1 and T2 in the breast are known to alter in the presence of a tumour2, and the features extracted from texture analysis have shown significant potential in describing tumour pathology and predicting response to therapies3,4. However, measurement variability impacts the accurate determination of relaxation parameters. The repeatability analysis assesses within-subject measurement variations5, while reliability assesses variability between-subjects6,7. Hence, reliable and repeatable measurements are needed to ensure precise quantification of disease load in breast cancer. Therefore, we hypothesised that tumour features extracted from quantitative T1 and T2 images are highly reliable and repeatable across acquisitions.Methods
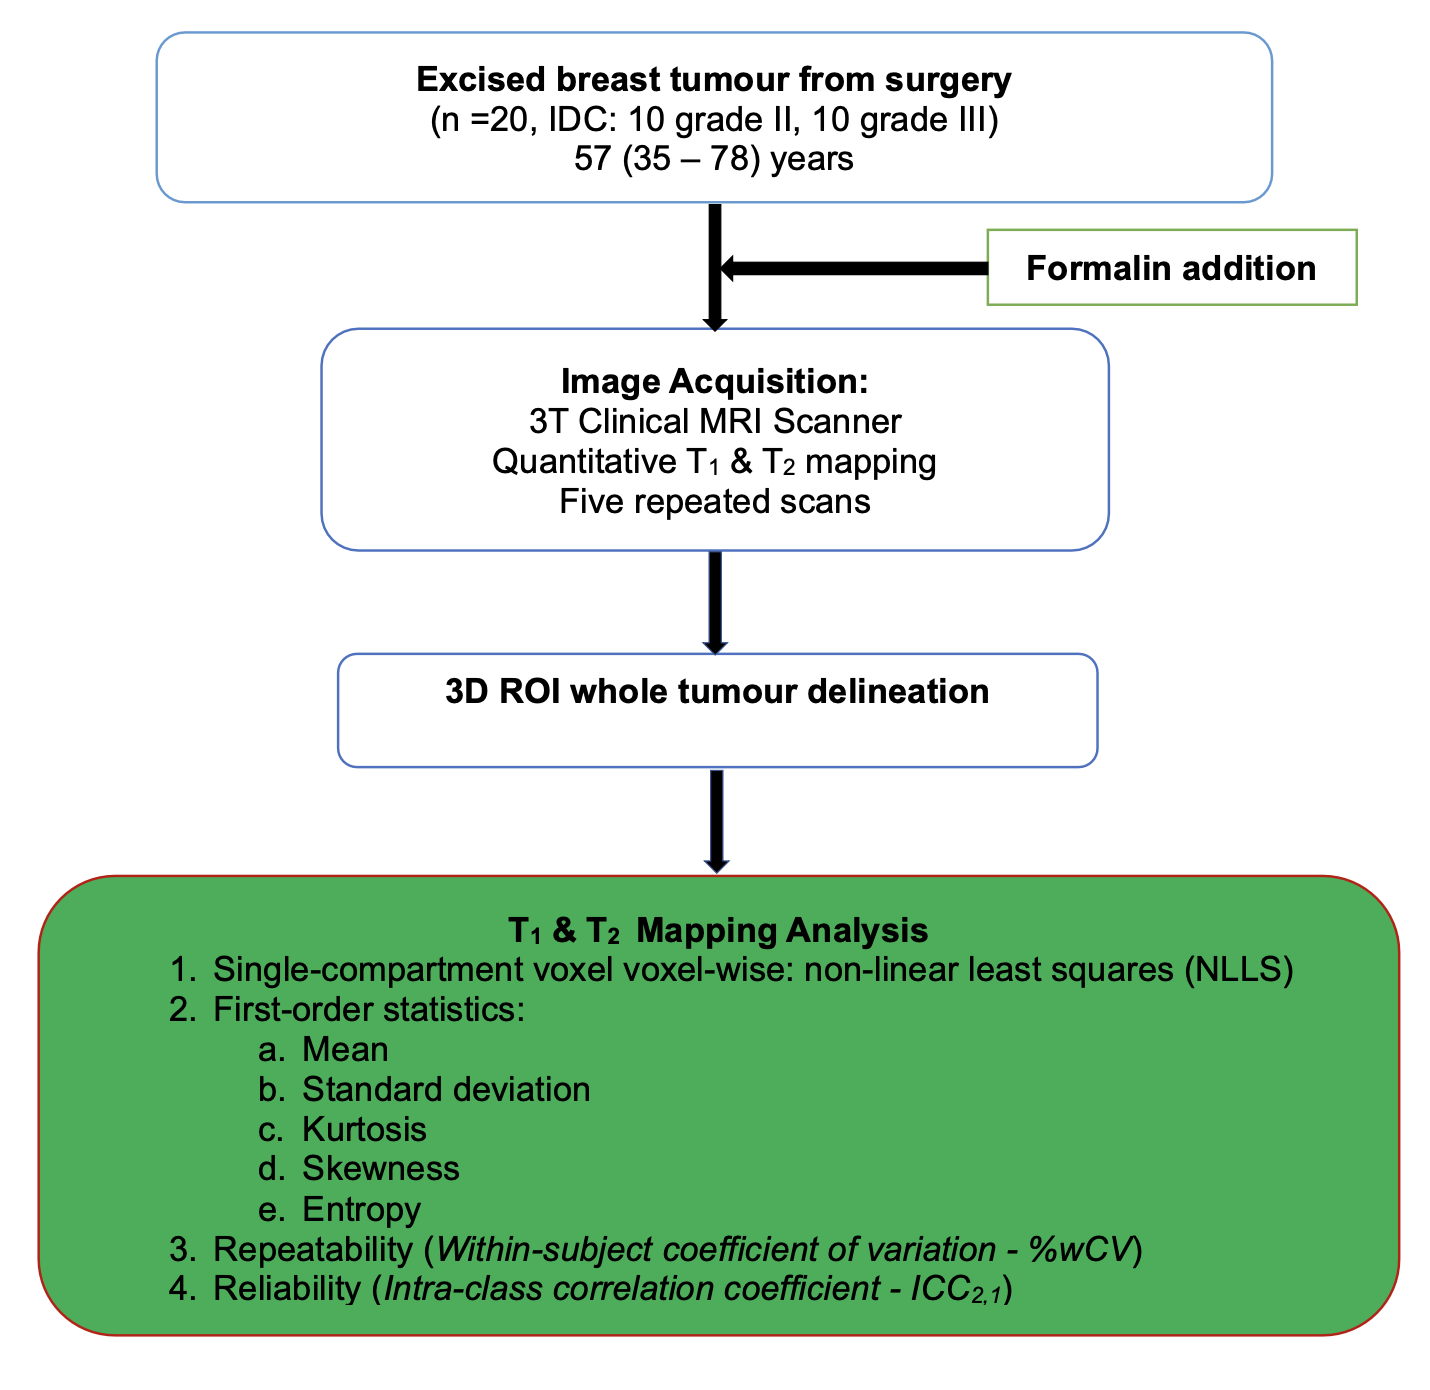
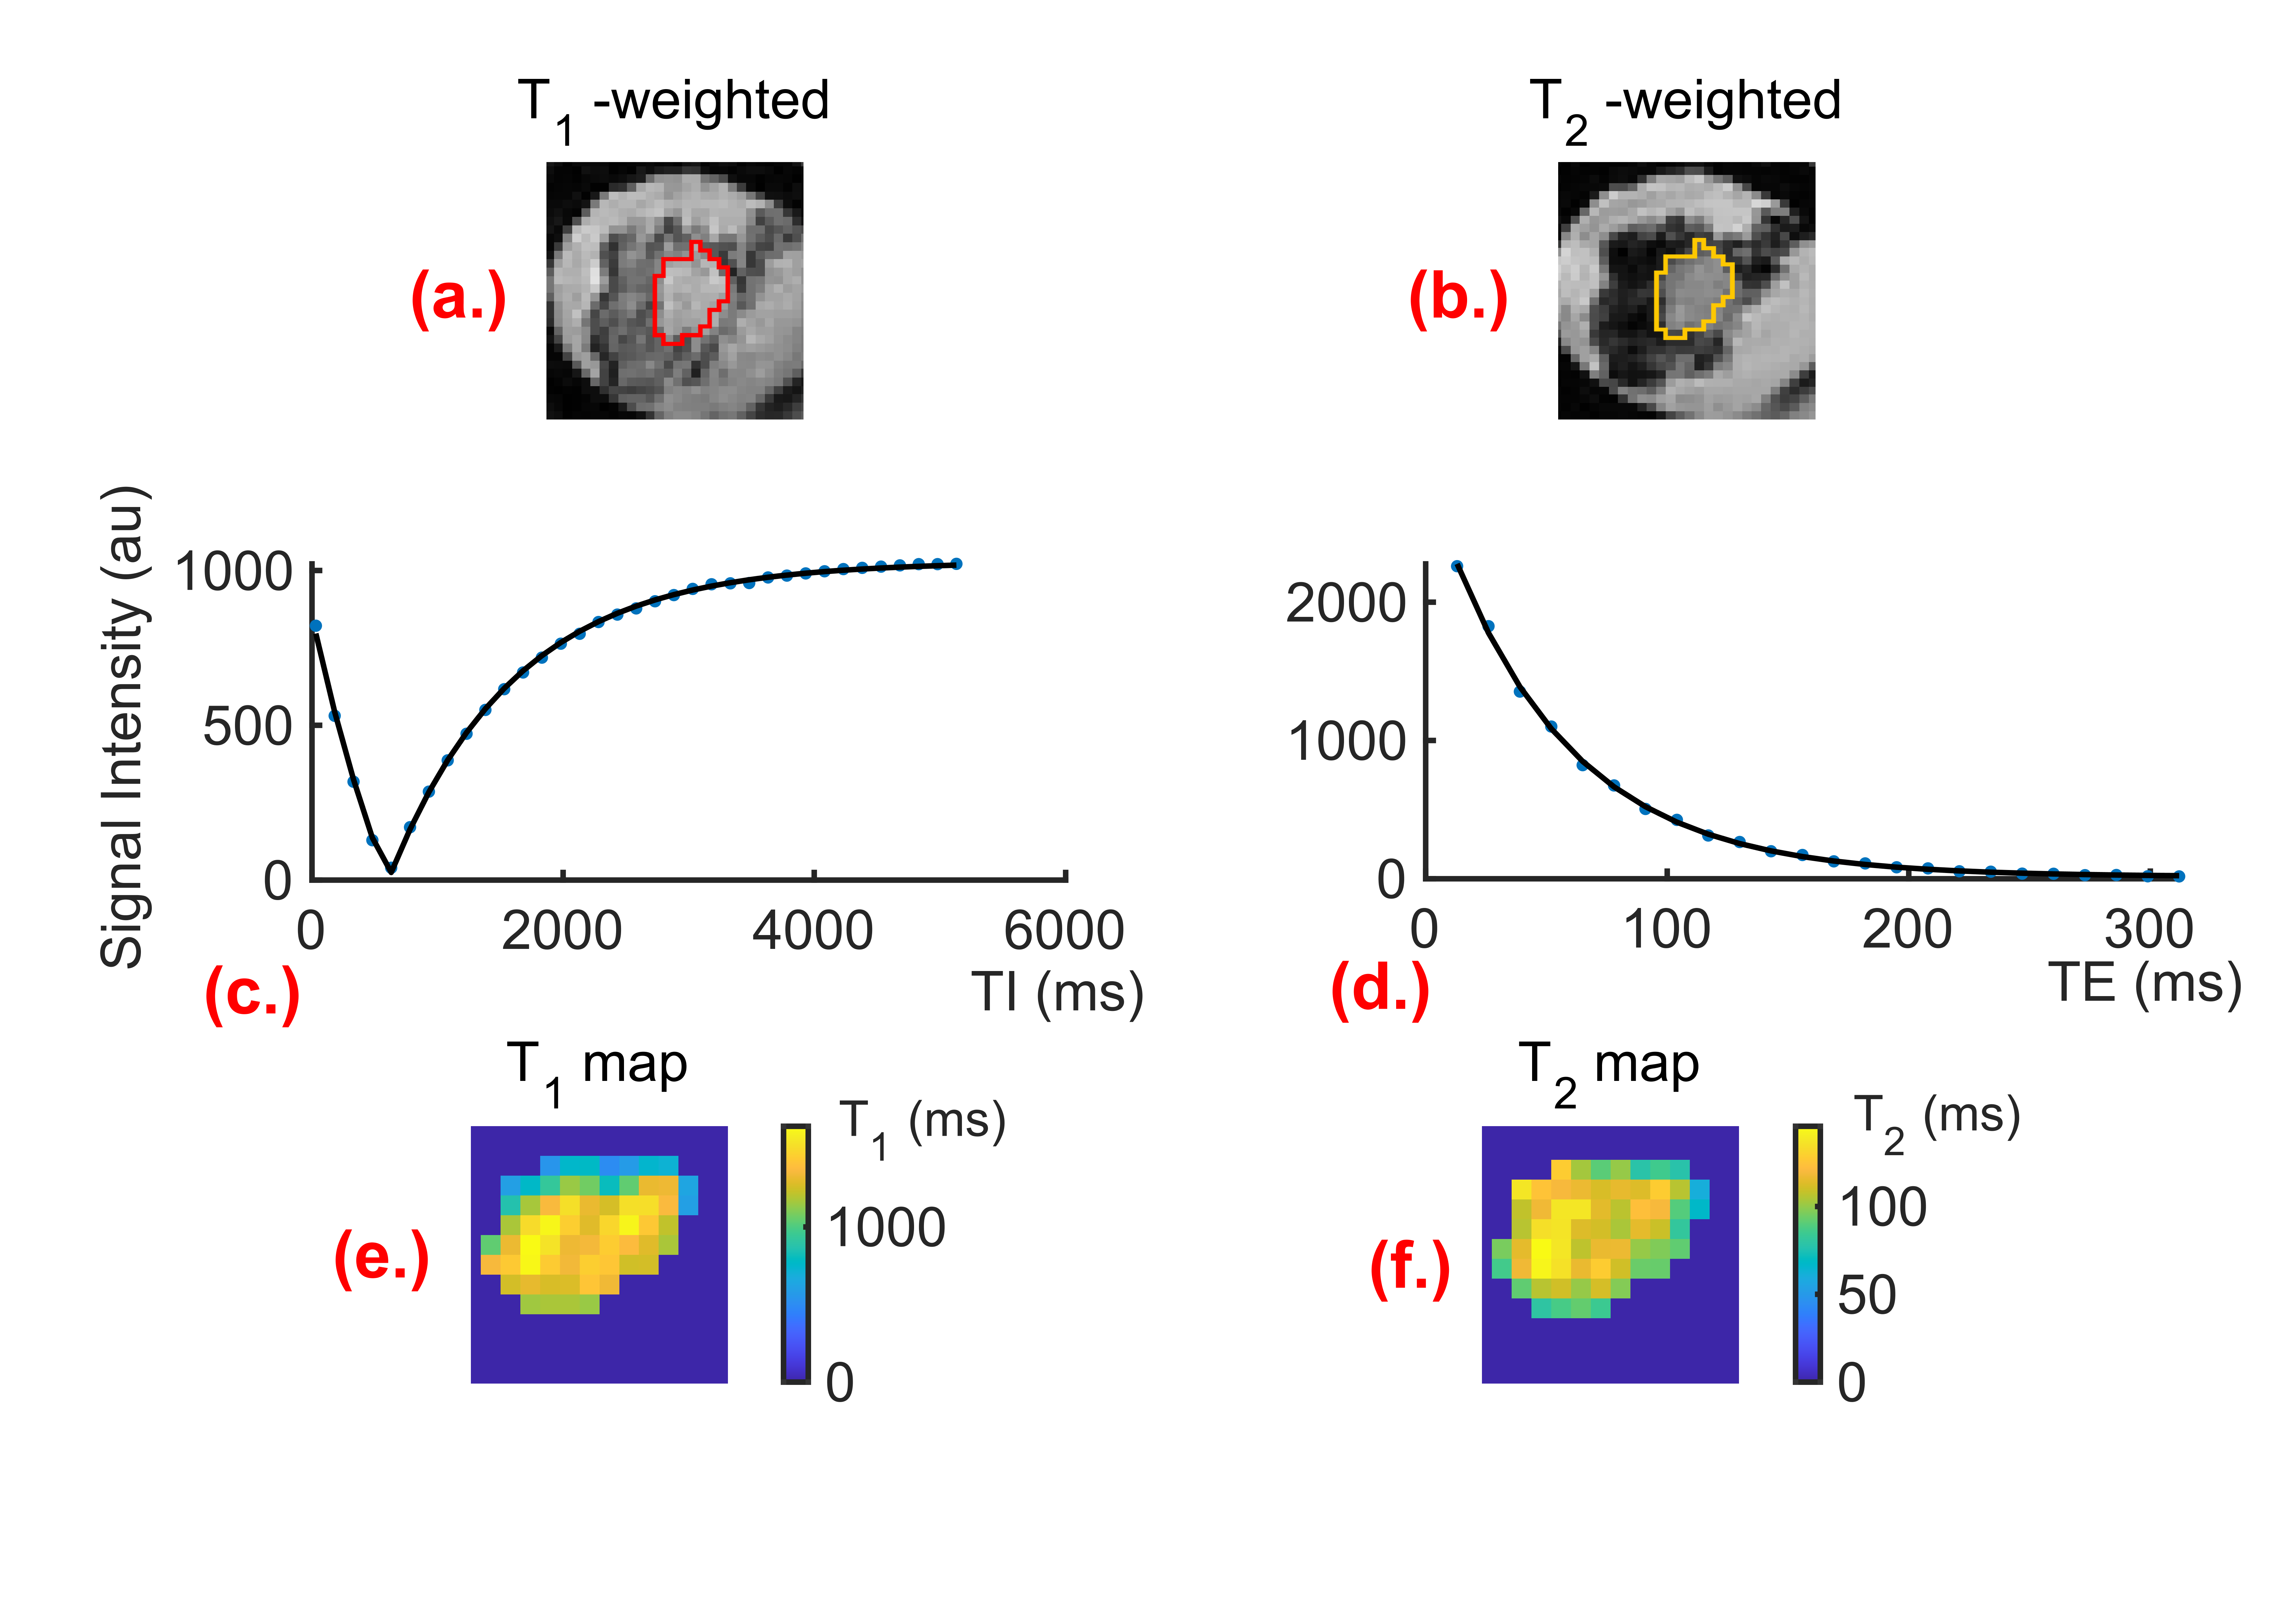
Twenty breast tumour specimens were removed from female patients undergoing wide local excision, with a mean (range) age of 57 (35 – 78) years, with invasive ductal carcinoma, 10 grade II and 10 grade III (Figure 1). Five repeated acquisitions of quantitative T1 and T2 scans were performed overnight. The study was approved by the North-West – Greater Manchester East Research Ethics Committee (Identifier: 16/NW/0221), with signed written informed consent obtained from all participants before entry into the study. Images were acquired on a clinical 3T MRI scanner (Achieva TX, Philips Healthcare, Best, Netherlands) using a body coil for uniform transmission and a 32-channel receiver coil for signal detection. T1 and T2 images had an FOV of 141 × 141 mm2, a slice thickness of 2.2 mm and an image resolution of 2.2 × 2.2 mm2. Quantitative T1 images were acquired using the multi-shot Look-Locker sequence with 5 k-space lines in a shot, 35 inversion curve sampling points from the first inversion time (TI) of 30 ms and an increment of 150.4 ms, excitation pulse flip angle of 4° and repetition time (TR) of 5450 ms. Quantitative T2 images were acquired using the multi-shot gradient and spin echo (GRASE) pulse sequence, with 24 echo times (TEs) from 13 ms to 312 ms. Voxel-wise mono-exponential fitting was performed using the non-linear least squares (NLLS) method based on the Levenberg-Marquardt algorithm to derive quantitative T1 and T2 maps in MATLAB (R2022a, MathWorks, Natick, USA) (Figure 2). Whole tumour delineation was conducted on Diffusion-weighted images acquired using a multi-shot pulsed gradient spin echo (PGSE) sequence with a b-value of 800 s.mm-2, FOV of 141 x 141 mm2 and image resolution of 2.2 x 2.2 x 2.2 mm3, using MRIcron (University of South Carolina, Columbia, USA) and extracted for texture analysis on T1 and T2 maps. Five first-order statistics texture features, Mean, standard deviation, Kurtosis, Skewness and Entropy, were calculated based on histogram analysis of the voxel values within the tumour. Statistical analysis was performed using the SPSS statistical software (IBM SPSS Statistics, Version 27.0, Armonk, USA). Repeatability was conducted using the within-subject coefficient of variation (%wCV)5 across the five repeated acquisitions. %wCV is a normalised measure of variation, enabling comparisons across measurements with different units. The reliability was conducted using the two-way intra-class correlation coefficient mixed effect model with absolute agreement (ICC2,1) across the 20 specimens with the five repeated acquisitions7. A p-value < 0.05 was considered statistically significant.Results
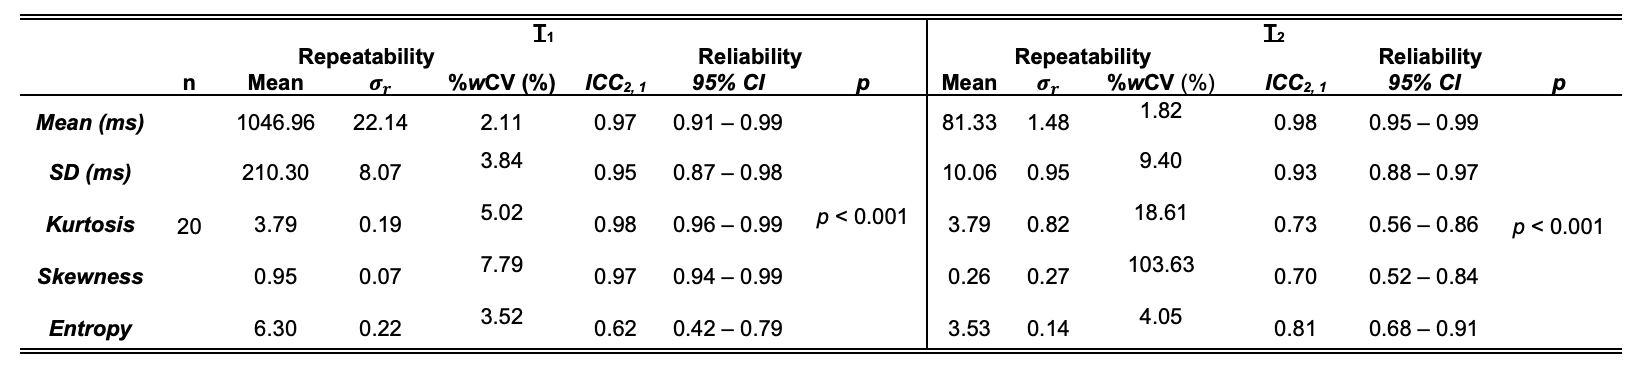
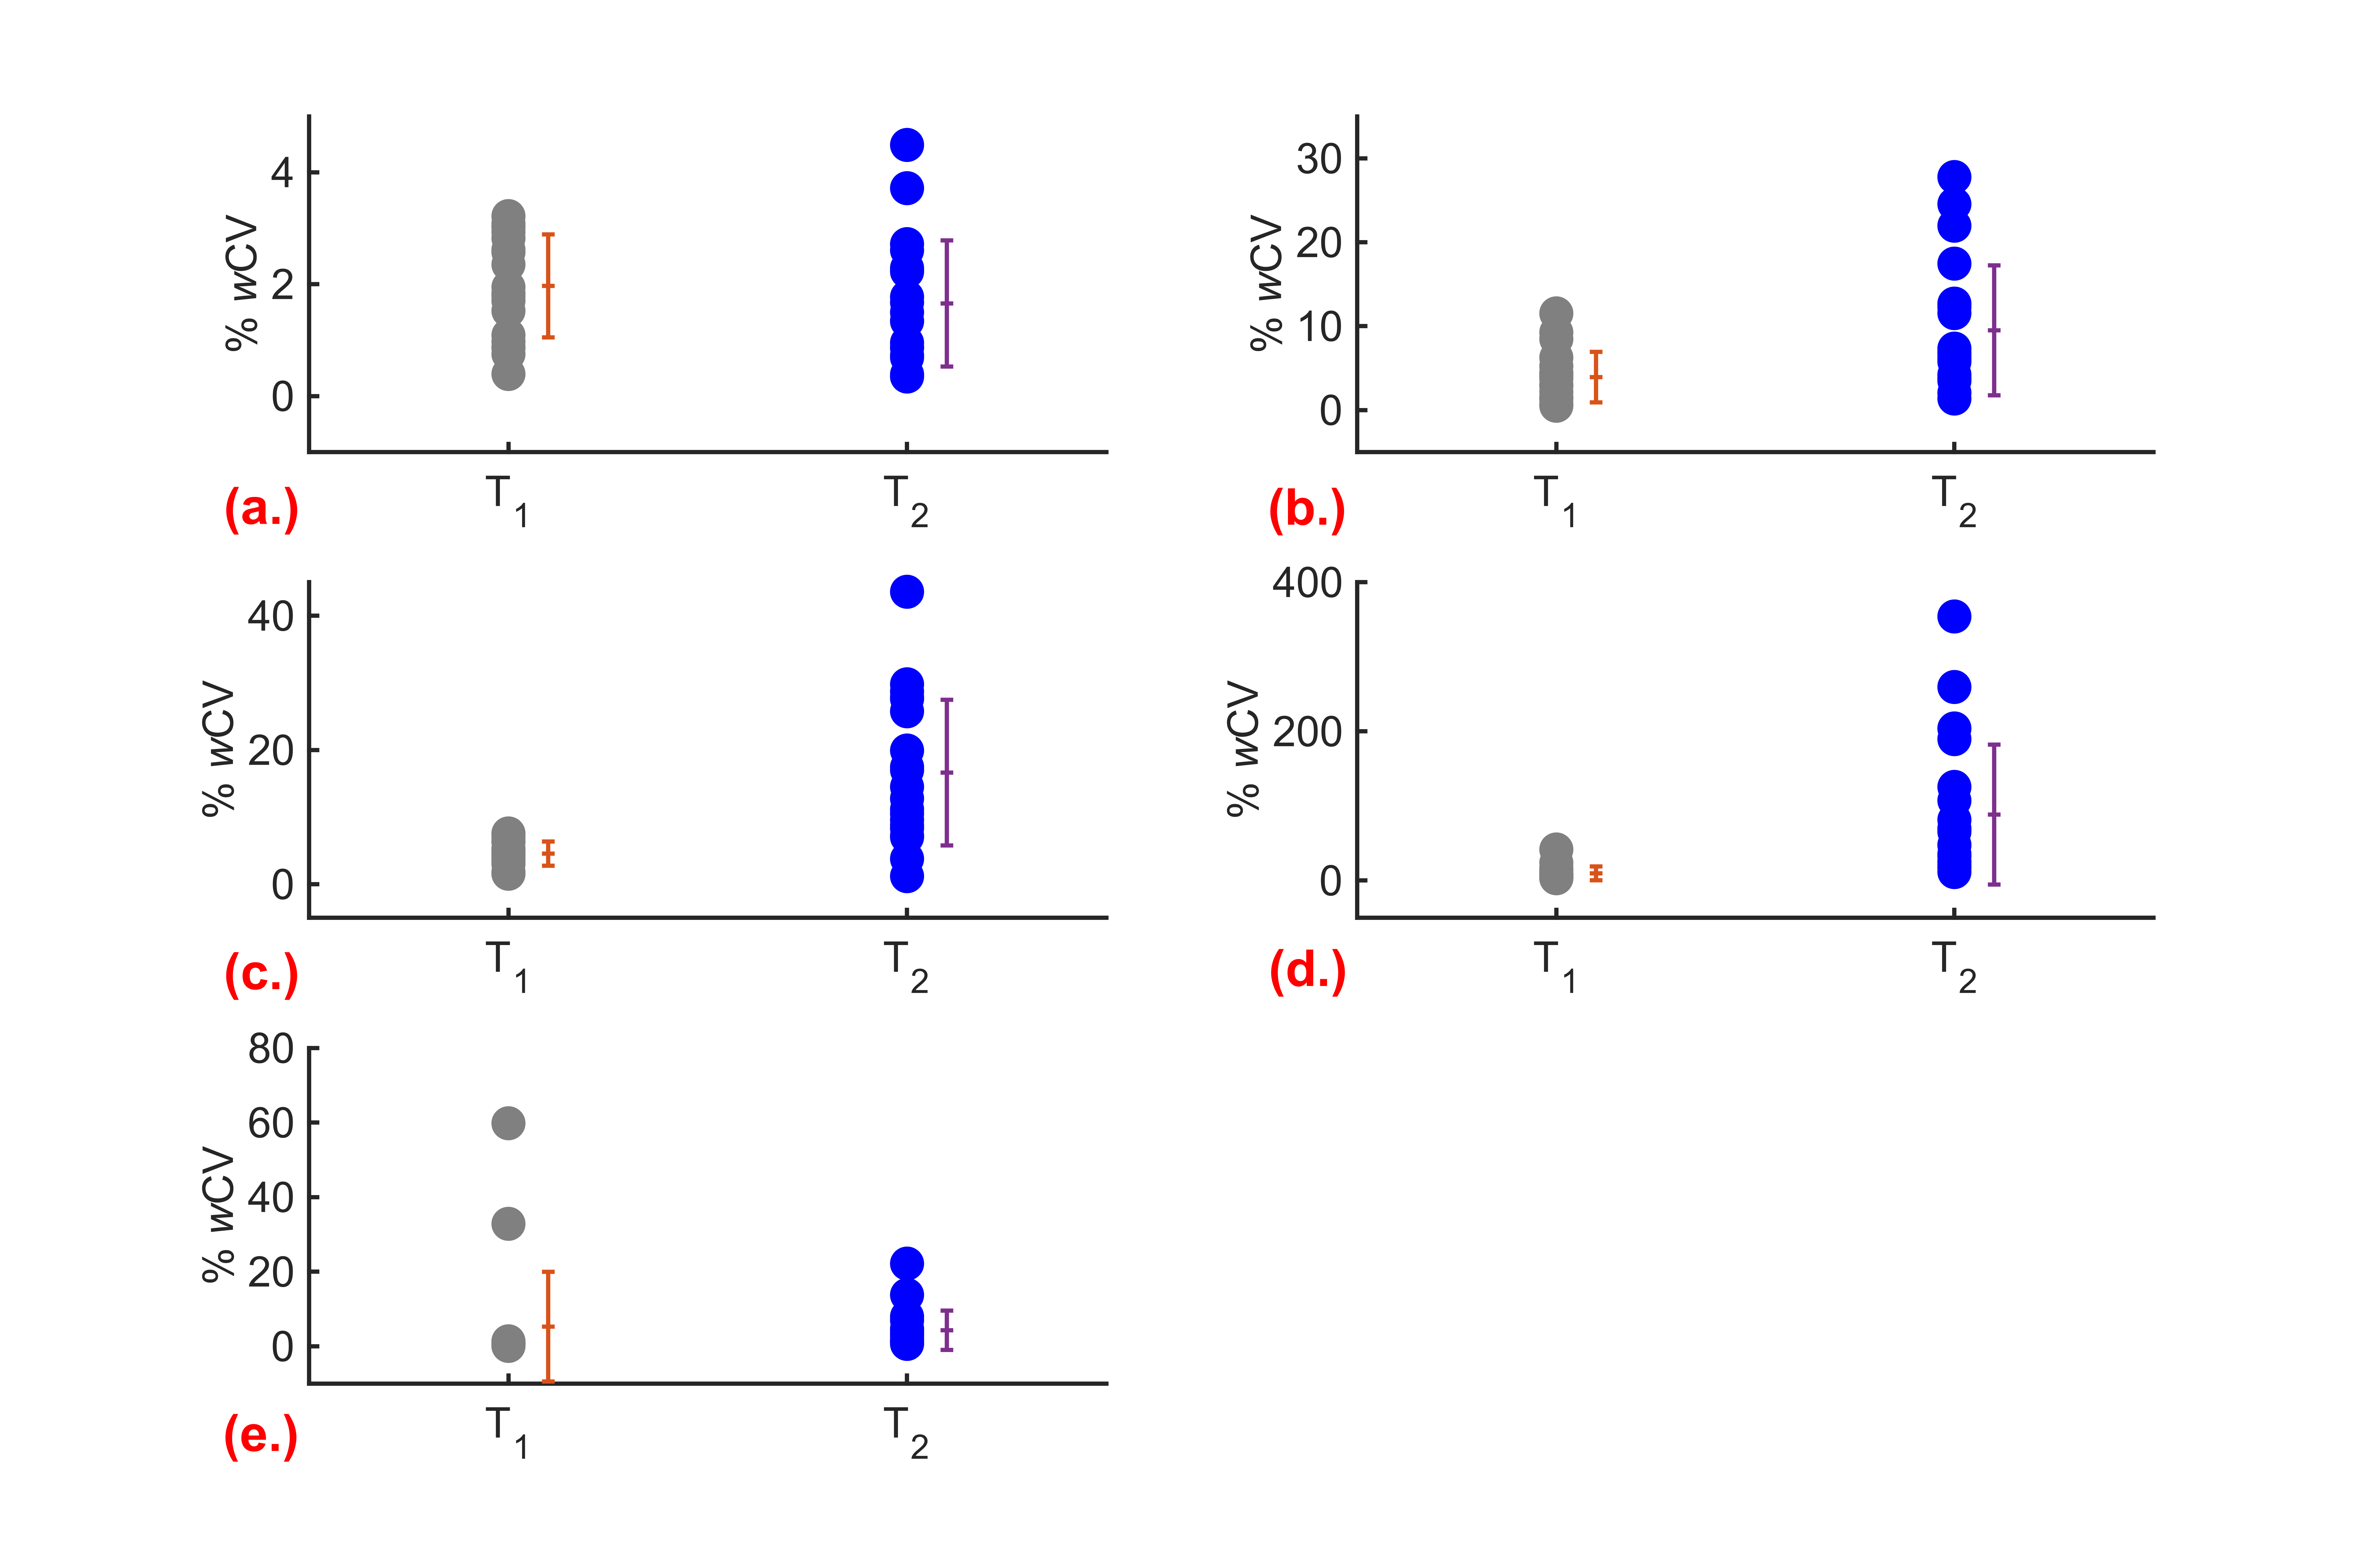
For T1, repeatability (%wCV) of the Mean, Standard deviation, Kurtosis, Skewness and Entropy were 2.11%, 3.84%, 5.02%, 7.79% and 3.52%, respectively (Table 1, Figure 3). The reliability (ICC2,1 (95% CI)) of the Mean, Standard deviation, Kurtosis, Skewness and Entropy were 0.97 (0.91 – 0.99), 0.95 (0.87 – 0.98), 0.98 (0.96 – 0.99), 0.97 (0.94 – 0.99) and 0.62 (0.42 – 0.79, respectively (Table 2, Figure 4). For T2, repeatability of the Mean, Standard deviation, Kurtosis, Skewness and Entropy were 1.82%, 9.40%, 18.61%, 103.63% and 4.05%, respectively (Table 1, Figure 3). The reliability (ICC2,1 (95% CI))of the Mean, Standard deviation, Kurtosis, Skewness, and Entropy texture features were 0.98 (0.95 – 0.99), 0.93 (0.88 – 0.97), 0.73 (0.56 – 0.86), 0.70 (0.52 – 0.84) and 0.81 (0.68 – 0.91), respectively (Table 1, Figure 4).Discussion
T1 metrics were highly repeatable and reliable, except for moderate reliability in Entropy. In T2, Mean, Standard deviation and Entropy were highly repeatable, with moderate repeatability in Kurtosis and poor repeatability in Skewness. The Mean, Standard deviation and Entropy were highly reliable, while Kurtosis and Skewness exhibited good reliability.Conclusion
Most first-order texture features from quantitative T1 and T2 are highly repeatable and reliable. Reliability and repeatability of texture features extracted from relaxation property maps serve as a cornerstone towards a higher-order analysis of breast cancer to support the clinical decision with confidence.Acknowledgements
The NHS Grampian Endowment Research Fund funded this work. The Commonwealth PhD Scholarship supports Kangwa Nkonde’s PhD study.References
1. Ferlay J, Colombet M, Soerjomataram I, et al. Cancer statistics for the year 2020: An overview. Int J Cancer. 2021.2. Liu L, Yin B, Geng DY, Lu YP, Peng WJ. Changes of T2 Relaxation Time From Neoadjuvant Chemotherapy in Breast Cancer Lesions. Iranian Journal of Radiology. 2016.3. Shur J, Blackledge M, D’Arcy J, et al. MRI texture feature repeatability and image acquisition factor robustness, a phantom study and in silico study. Eur Radiol Exp. 2021.4. Traverso A, Wee L, Dekker A, Gillies R. Repeatability and Reproducibility of Radiomic Features: A Systematic Review. Int J Radiat Oncol Biol Phys. 2018.5. Barnhart HX, Barboriak DP. Applications of the Repeatability of Quantitative Imaging Biomarkers: A Review of Statistical Analysis of Repeat Data Sets. Transl Oncol. 2009.6. Vaz S, Falkmer T, Passmore AE, Parsons R, Andreou P. The Case for Using the Repeatability Coefficient When Calculating Test–Retest Reliability. PLoS One. 2013.7. Weir JP. Quantifying test-retest reliability using the intraclass correlation coefficient and the SEM. J Strength Cond Res. 2005.Figures