4588
Multi-contrast Multi-resolution UTE for Myelin Fraction Mapping1Division of Medical Physics, Department of Diagnostic and Interventional Radiology, University Medical Center Freiburg, Faculty of Medicine, University of Freiburg, Freiburg, Germany, 2Bruker BioSpin, Karlsruhe, Germany, 3Deparment of Diagnostic and Interventional Radiology and Neuroradiology, University Medical Center Freiburg, Freiburg, Germany, 4Weldon School of Biomedical Engineering, Purdue University, West Lafayette, IN, United States, 5School of Health Sciences, College of Health and Human Sciences, Purdue University, West Lafayette, IN, United States
Synopsis
Keywords: Quantitative Imaging, Quantitative Imaging, Myelin, UTE, Bayesian
Motivation: The direct detection of myelin is not possible due to extremely short T2 of the myelin bilayer. Ultra-short T2* component can be calculated with ultra-short echo-time (UTE) sequences.
Goal(s): To evaluate the performance of the multi-contrast multi-resolution 3D-UTE sequence (mcUTE) in myelin fraction estimation.
Approach: Combining 1-1 binomial water-excitation pulses and zero-moment encoding in between, mcUTE enables simultaneous acquisition of quantitative and high-resolution water-excited structural images. Myelin fraction from mcUTE is compared to myelin water fraction method.
Results: Myelin fraction values were comparable with literature, and consistent within the subjects.
Impact: mcUTE can potentially be used as a single imaging modality for myelin fraction estimation since it produces both quantitative and a high resolution water-excited anatomical image data in 18mins with TE=20μs. Our results show the acquisition can be further accelerated.
Introduction
Multiple sclerosis is one of the most common neurologic diseases and a combination of neuroinflammation and degeneration leads to a reduced white matter myelin content which can be imaged with MRI. Conventional (i.e. qualitative) MRI techniques lack lesion specificity and sensitivity. In contrast, quantitative MRI (qMRI) yields additional information on the brain tissue and pathologies1. In particular, myelin water fraction (MWF) imaging was realized using T1, T2 or T2* information2–7. Magnetization transfer (MT) contrast8,9 and diffusion-weighted MRI (DWI)10 were proposed as more direct indicator of myelin content. Recently, ultra-short time echo (UTE) sequences11 were introduced as a potential biomarker of the myelin content. However, the reproducibility and specificity of qMRI is rather heterogeneous12 and a recent meta-analysis reported only limited correlation with histology13,14.Previously, we used a 1-1 binomial water excitation hard pulse in a UTE sequence to achieve high-resolution structural imaging, and added a bipolar gradient pair to acquire multi-contrast multi-resolution UTE (mcUTE) data sets15. In this study, this sequence was used to measure the ultra-short T2* (us-T2*) signal components in the brain to calculate myelin fraction (MF) maps. We represented the MR signal as weighted sum of three relaxation components and defined the ratio of the weighting of the us-T2* component to total weights of all components as MF. The sequence was tested in three healthy volunteers, and MF maps were obtained using Bayesian learning. Finally, MFs were compared to conventional MWF methods and literature values.
Methods
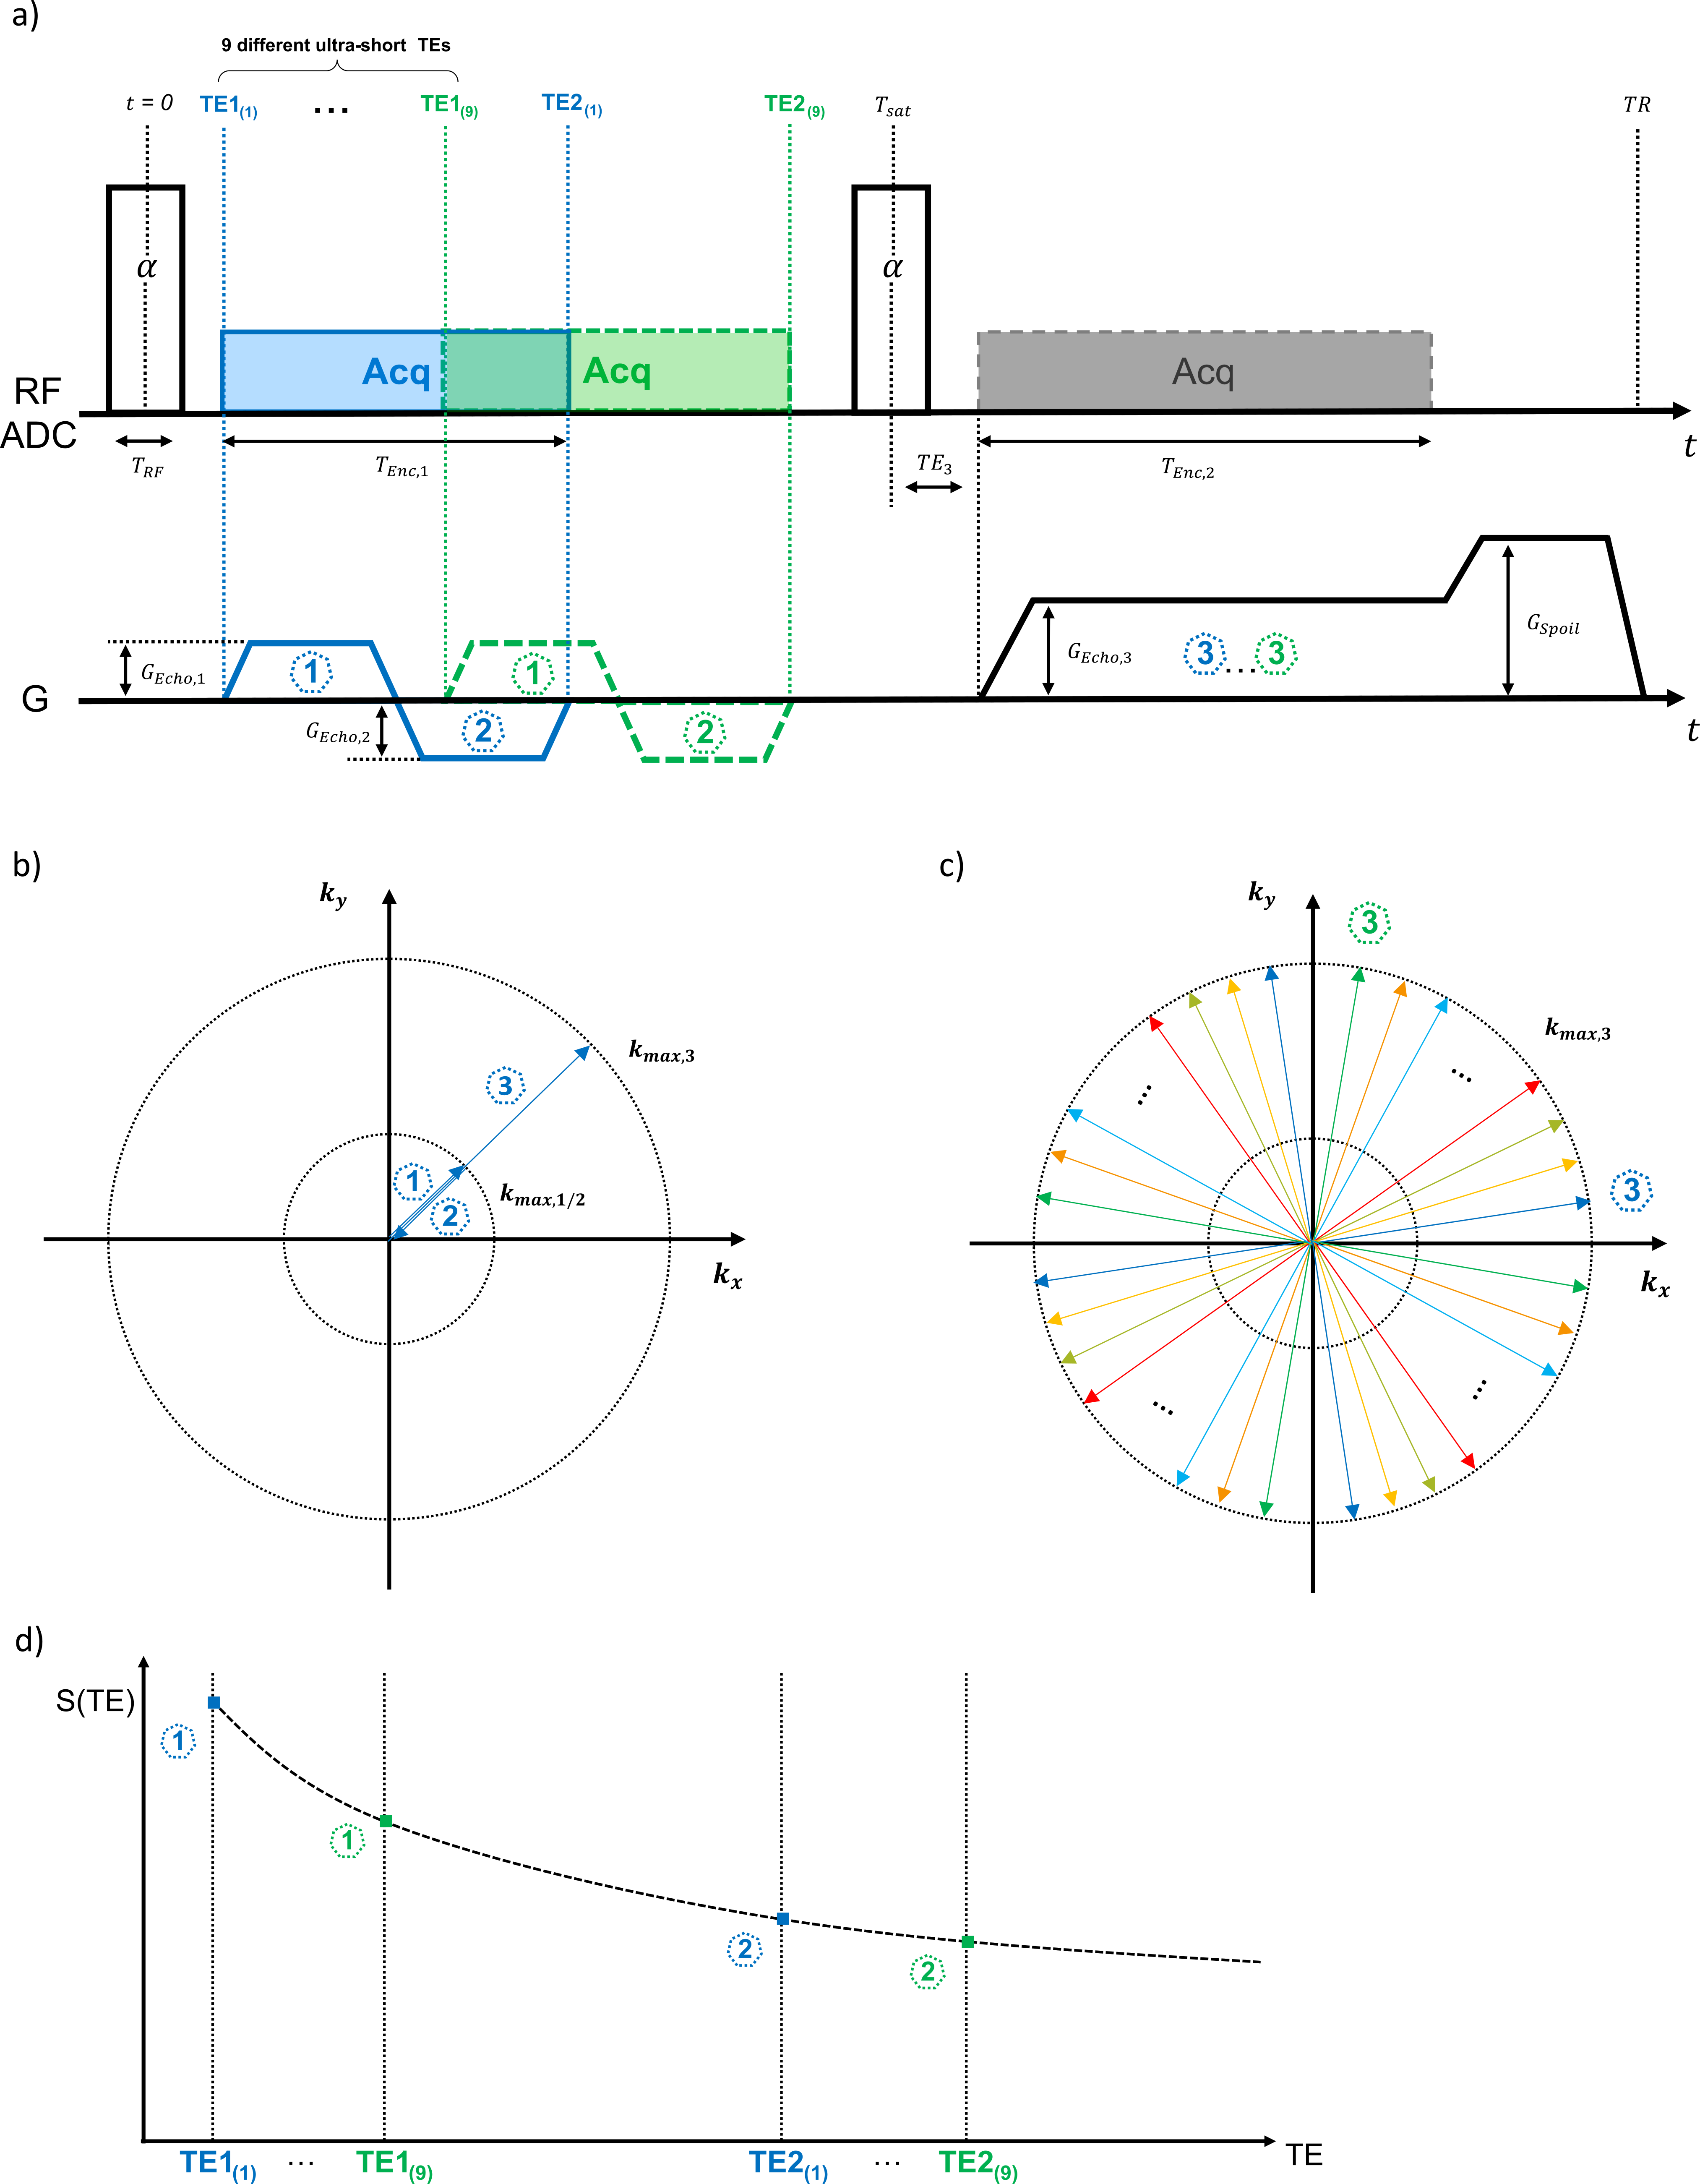
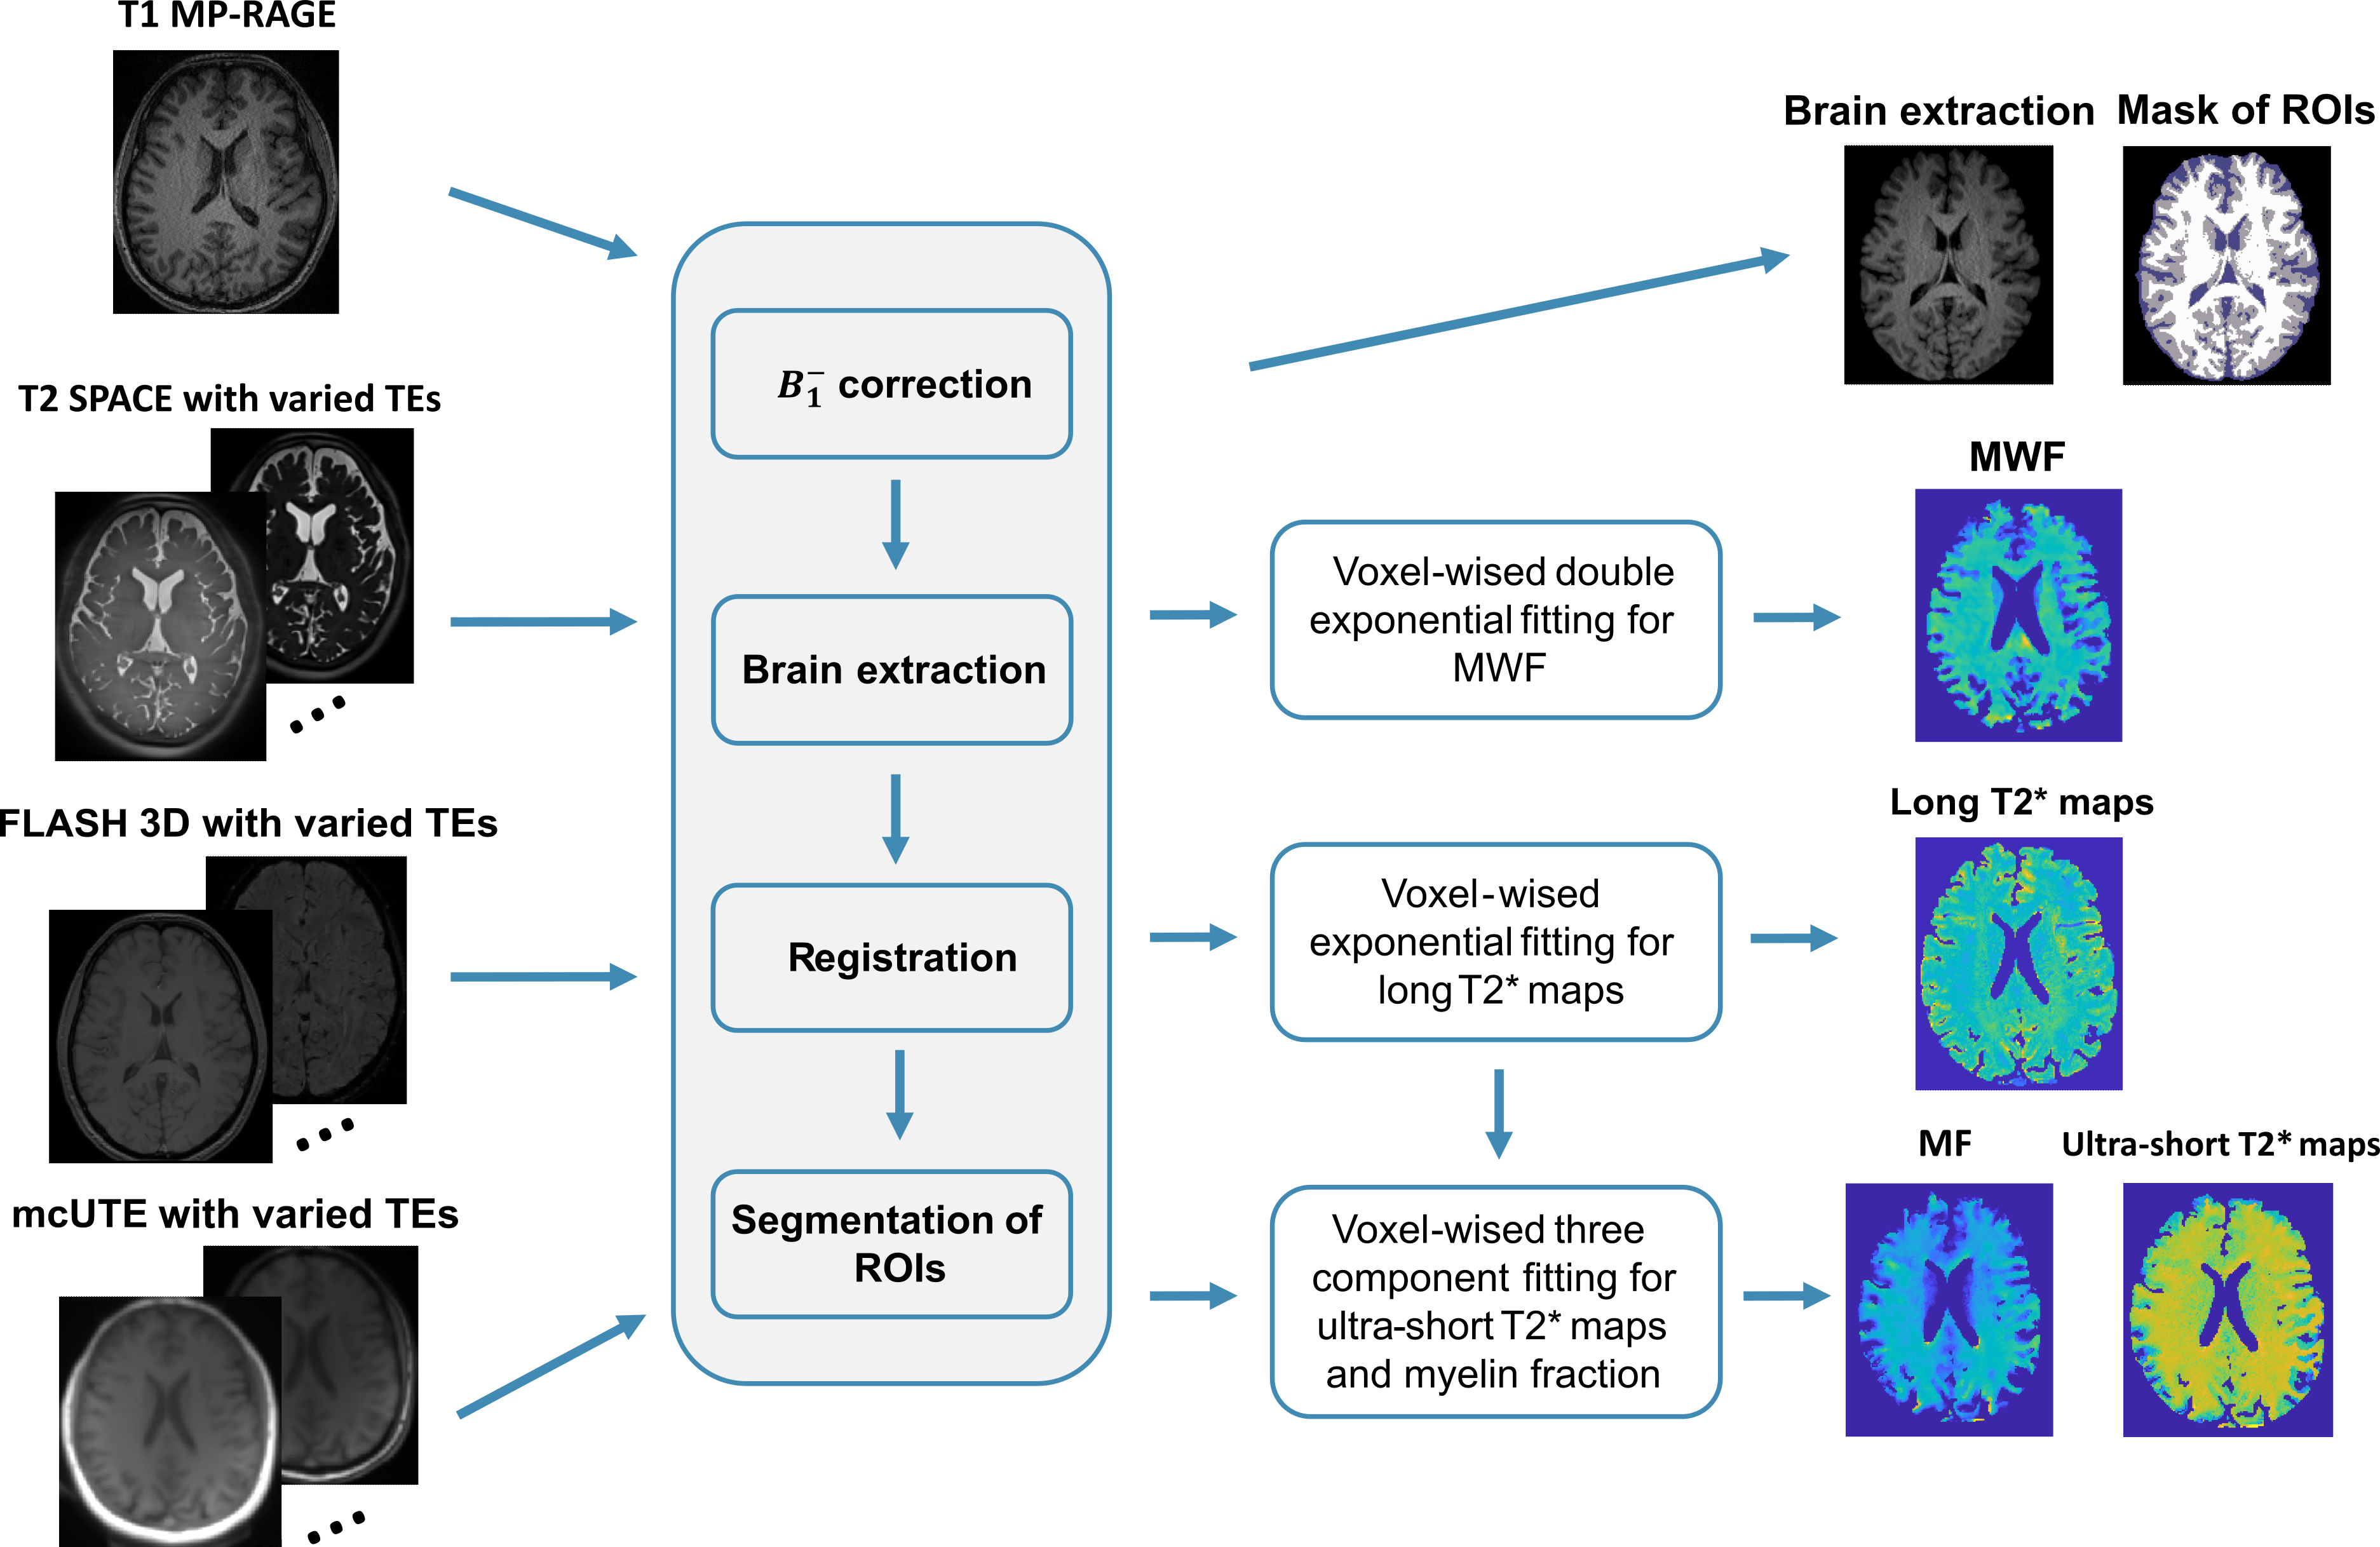
In mcUTE15, a bipolar readout gradient that acquires two echoes (TE1, TE2, bandwidth=635Hz/px, resolution=1.71mm) was inserted into a 1-1 binomial water excitation hard pulses (Fig.1). Immediately after the second RF pulse, a third echo (TE3) was acquired with TE3=20µs, bandwidth=635Hz/px, and resolution=0.50mm. To map us-T2* components, the mcUTE acquisition was repeated 9 times with different TEs for the TE1 and TE2. In Fig.2, T1w-MP-RAGE (TR=2000ms, FOV=224mm, resolution=1mm, α=8°, bandwidth=220Hz/px) and T2w-SPACE (TR=2500ms, FOV=224mm, resolution=1mm, α=90°, bandwidth=685Hz/px) sequences were acquired with varied TIs (850,900,980,1050,1200ms) and TEs (22,44,98,131,178ms) to obtain quantitative T1 and T2 maps for MWF. A 3D FLASH sequence (TR/TE=50/5,10,20,30,45ms, FOV=224mm, resolution=1mm, α=90°, bandwidth=350Hz/px) was used to quantify long T2* components, since it is impracticable to assign TE > 10ms for mcUTE. All sequences were tested in 3 healthy volunteers on a 3T MRI system (Magnetom PRISMA, Siemens).T2* and MF maps were computed voxel-wise from the signal intensity of different TEs obtained from mcUTE. A three-component model was used: $$$S(T E)=S_0 e^{-T E / T_{2, ultrashort}^*}+S_1 e^{-T E / T_{2, short }^*}+S_2 e^{-T E / T_{2, long }^*} $$$, where the long T2* information $$$T_{2, long }^* $$$ was obtained from a 3D FLASH acquisition. A two-component model without the long T2* value from 3D-FLASH was also tested, where the signal at TE=1160µs was subtracted from that of at the remaining TEs in mcUTE.
For model parameter estimation, we used a Bayesian estimator: $$$\tilde{x}_B(S)=\int x p(x \mid S) d x$$$, where x are the parameters ($$$ S_0, T_{2, ultrashort}^*, S_1, T_{2, short }^*, S_2 $$$) of the signal model. To find $$$\tilde{x}_B(S) $$$, we use a polynomial regressor to represent the mapping $$$\tilde{x}_B(S) $$$ and minimize the quadratic loss function $$$ L(\tilde{x}, x)=(\tilde{x}-x)^2$$$: $$$ \tilde{x}_B(S)=\underset{\tilde{x}}{\operatorname{argmin}} \int L(\tilde{x}(S), x) p(x, S) d x d S$$$, where the integral is computed by Monte Carlo methods16.
Results
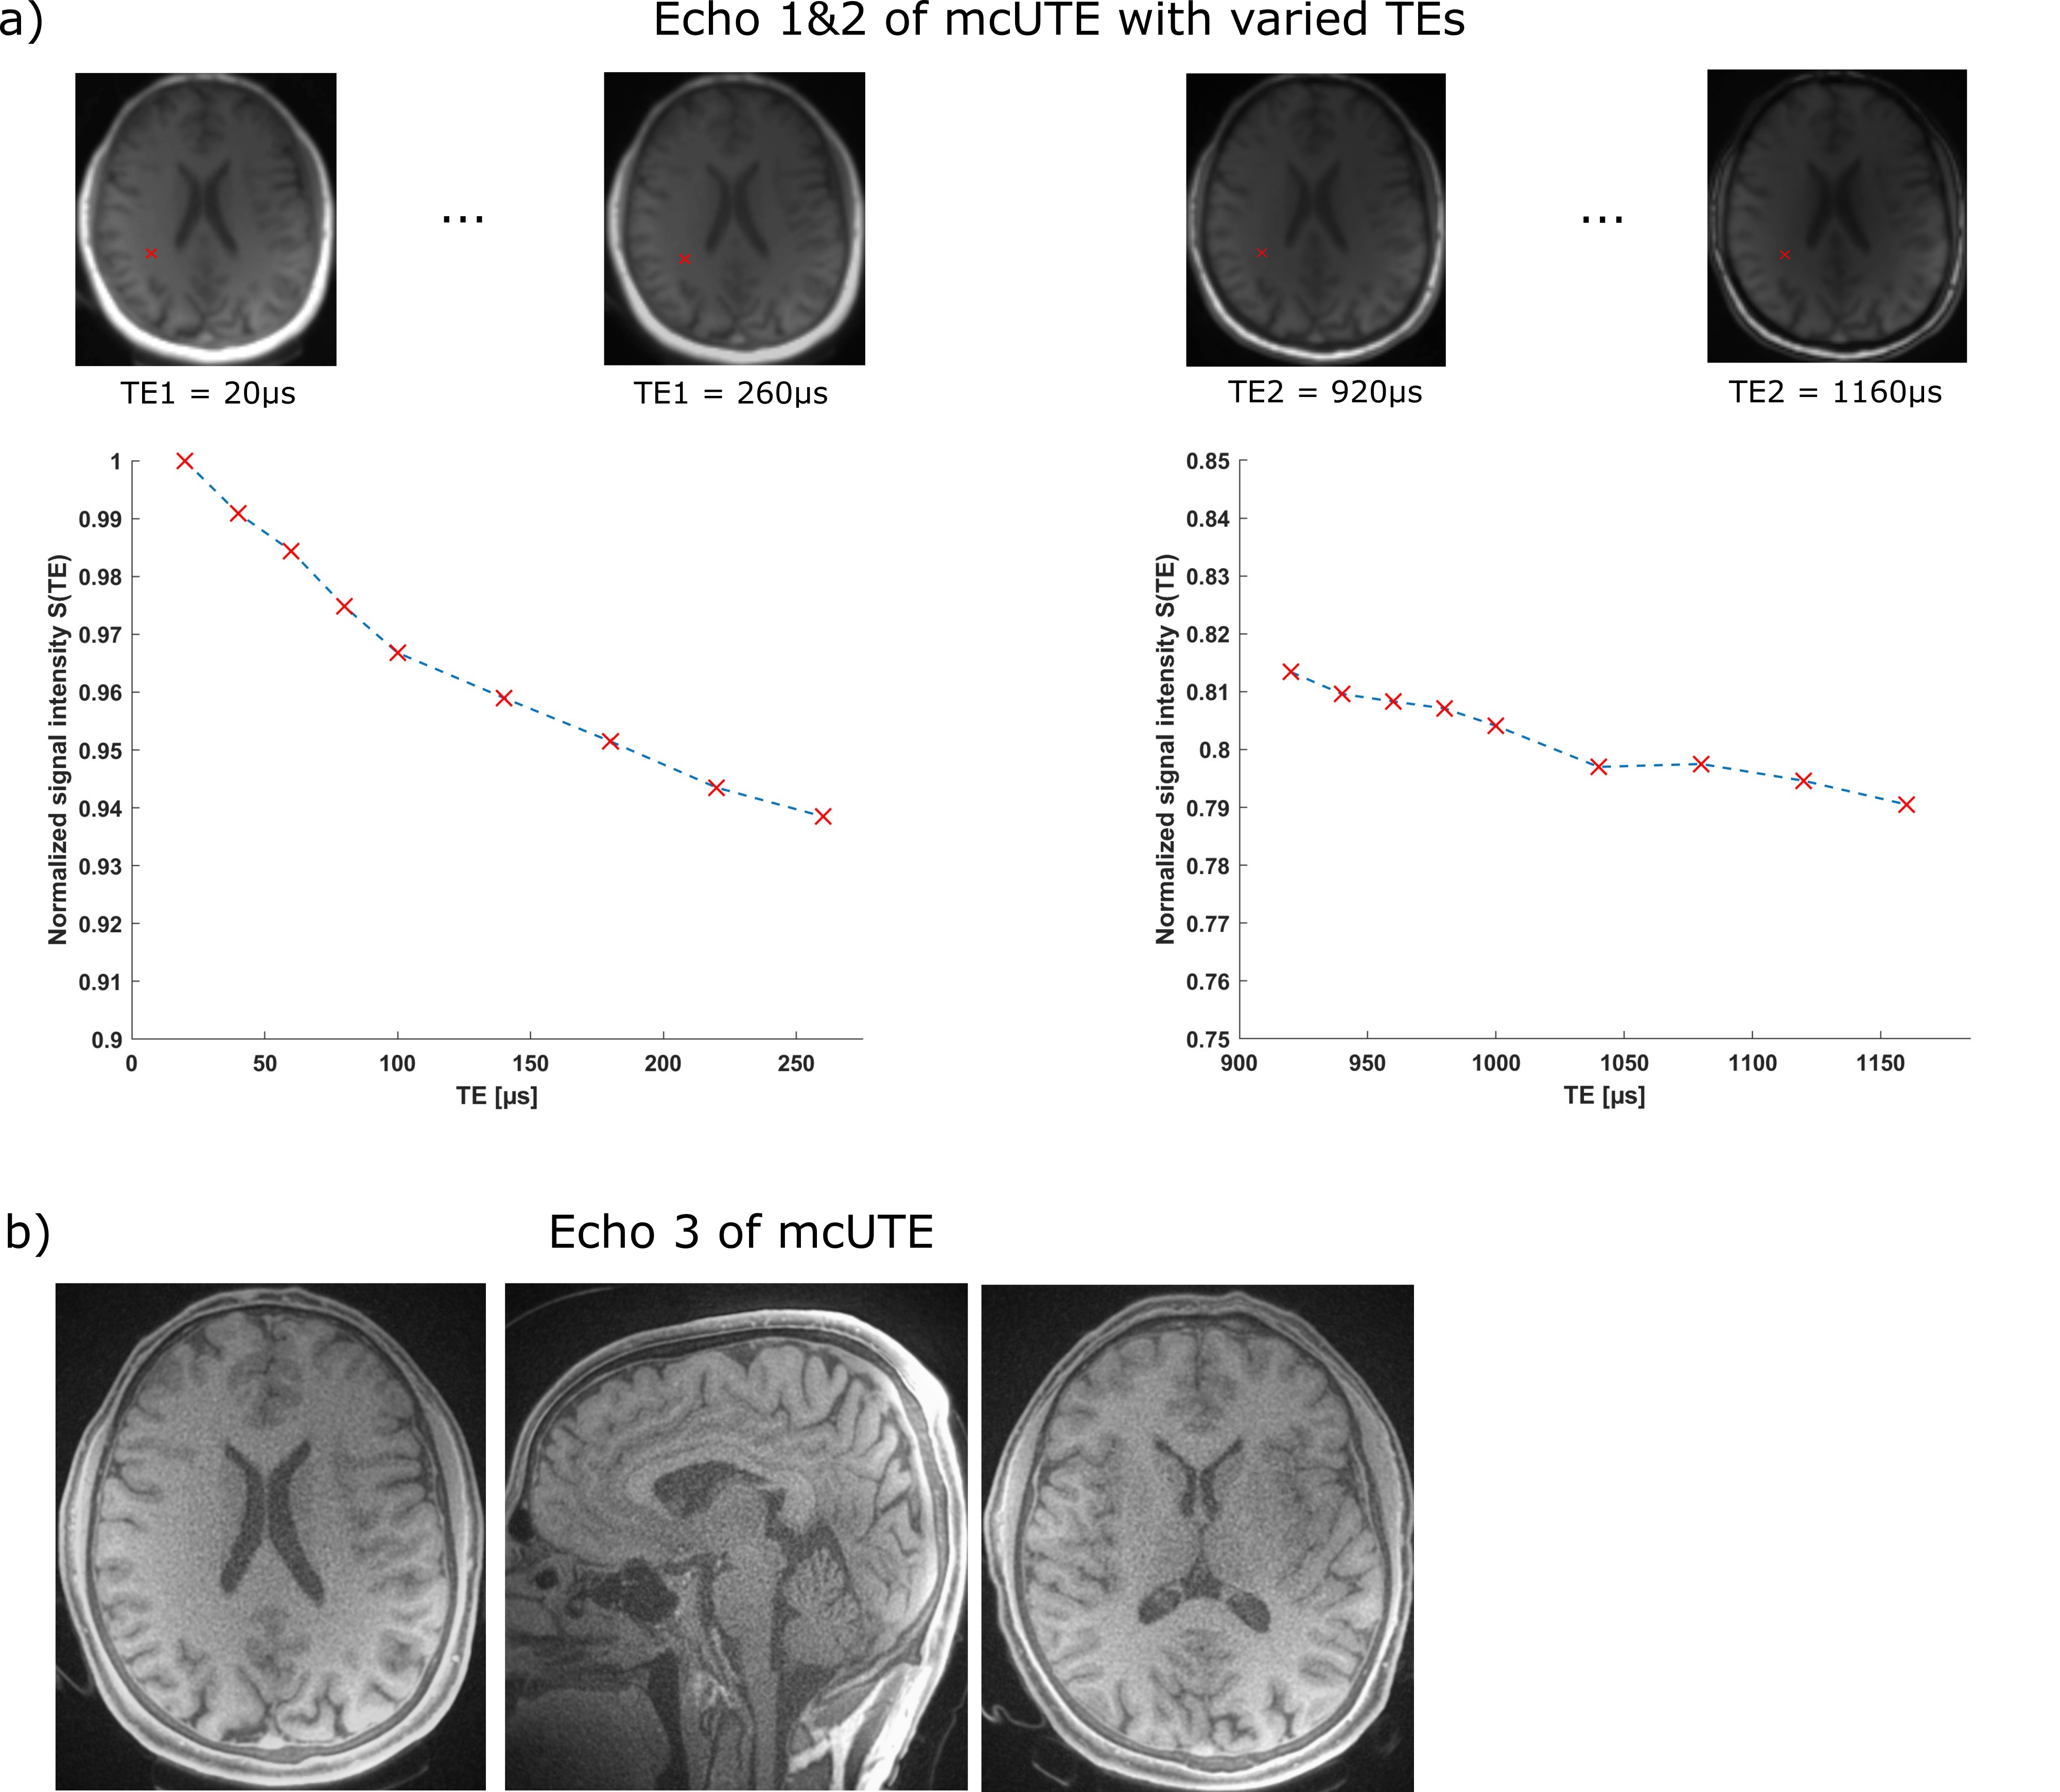
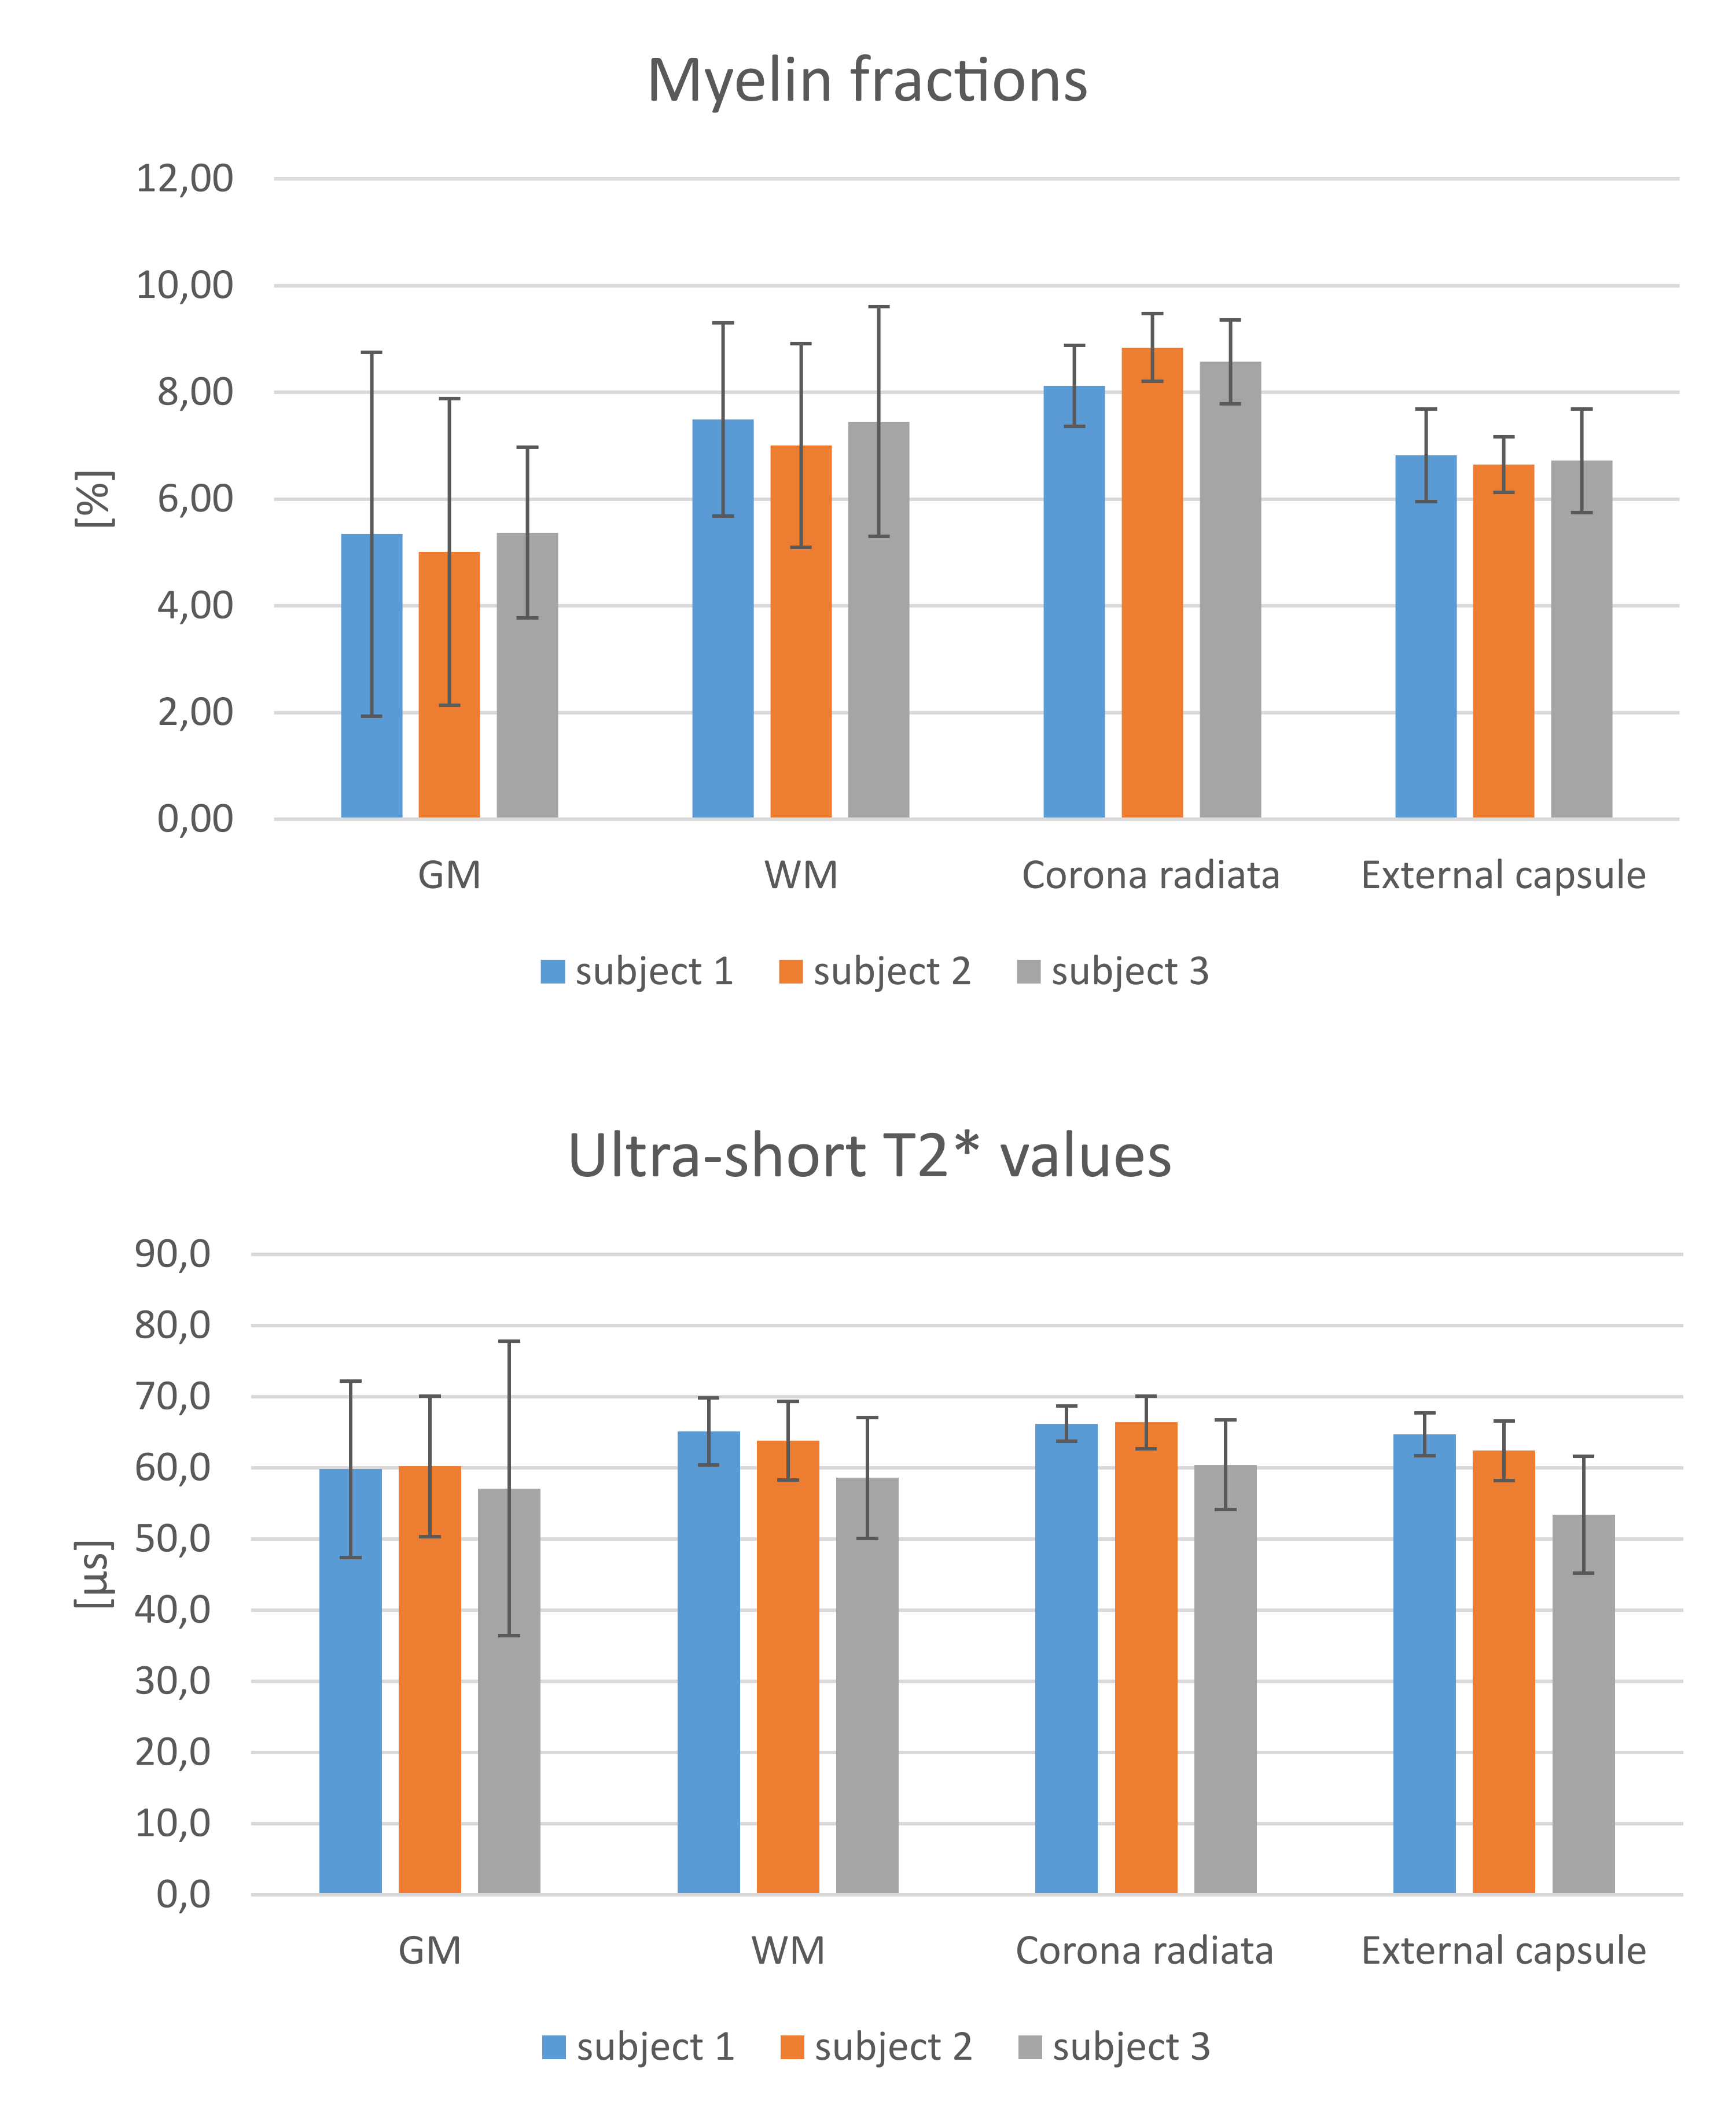
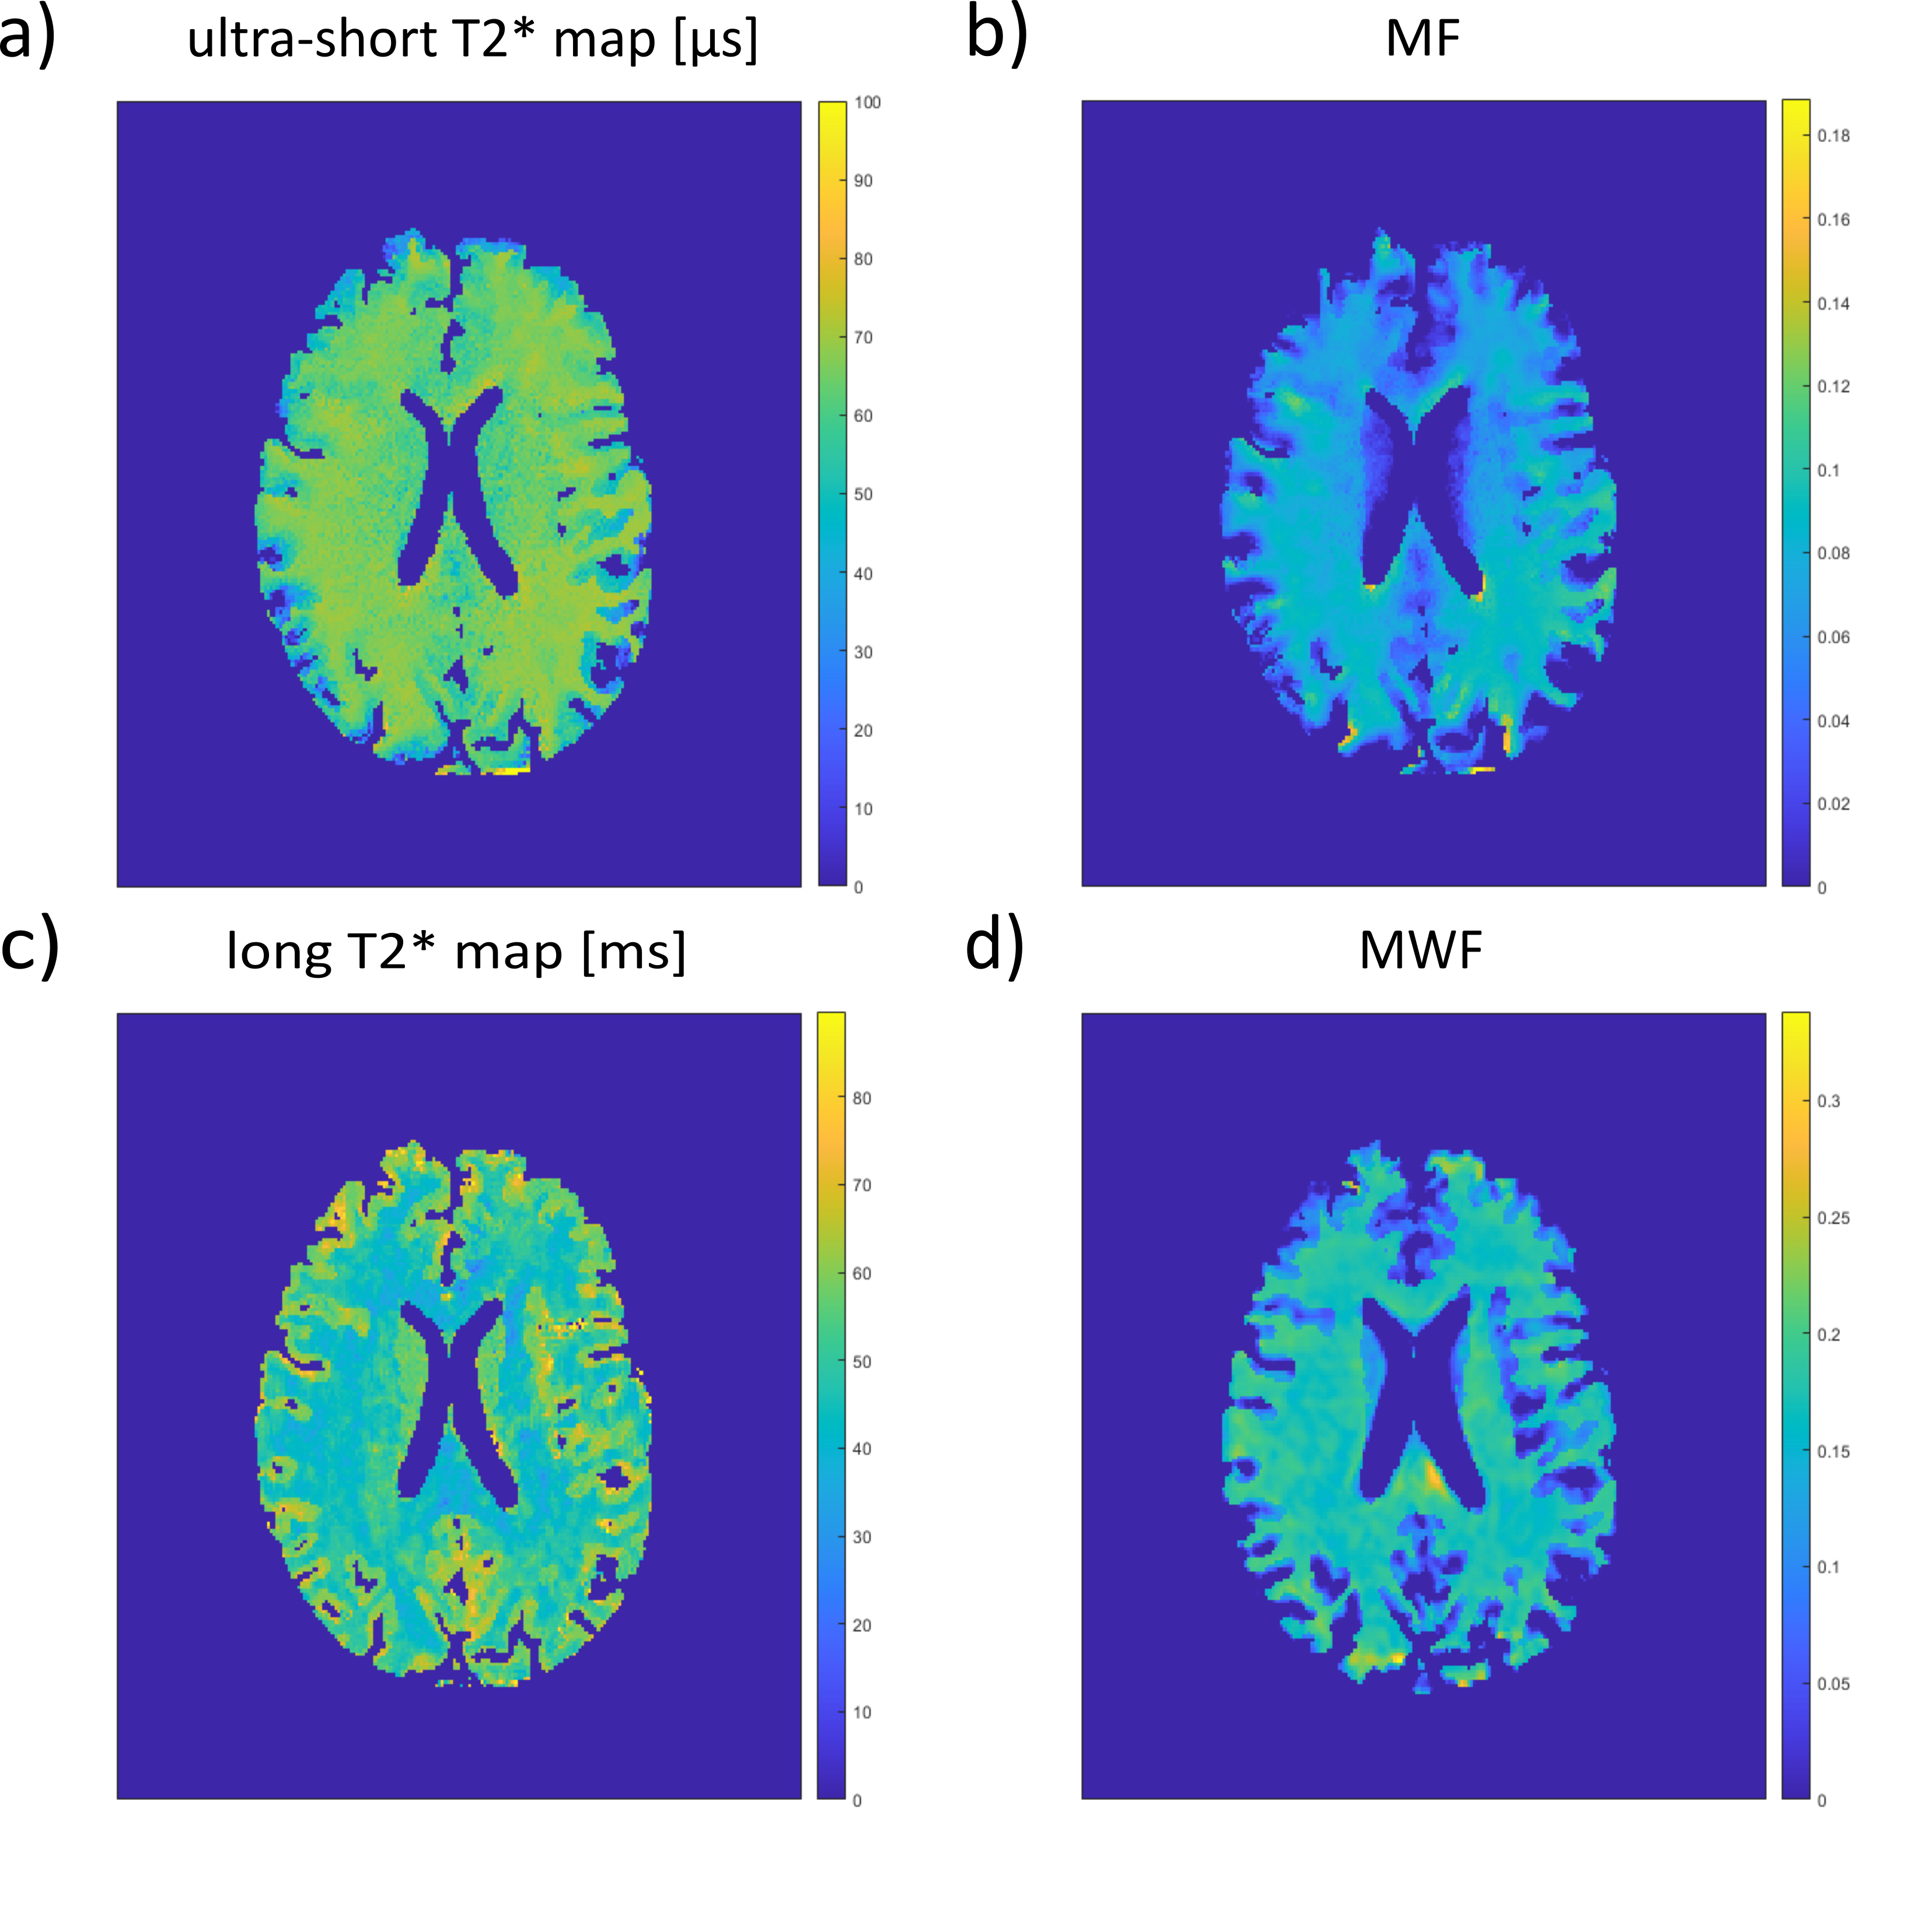
In Fig. 3, exemplary data sets are shown for a 35y-old male volunteer. Quantitative brain images with a signal intensity gradually decaying and high-resolution water-excited structural image are depicted. MF and us-T2* for all three subjects were 5.3±2.7/7.4±2.0/8.3±0.8/6.7±0.9 % and 59.0±15.2/62.3±7.2/64.8±4.7/60.2±7.6 µs for GM/WM/Corona radiata/External capsule (Fig.4). In Fig.5, MF and T2* maps of the same axial slices from the same volunteer show that the myelin fraction in WM is in general homogeneous and about 50% higher than in GM, consistent with the results reflected by MWF (structural similarity: SSIM(MF,MWF)=0.784). Long-T2* are shorter for WM compared to GM, which is consistent with the literature17.Discussion
In this study, long acquisition times are the main limitations. Acquisition of mcUTE sequences can be improved by incorporating additional echoes to estimate the long T2* components. Additional information such as B1 and T1 can also be estimated using the relationship between the first and the third echo. Variable flip angles, TR and TE can be integrated to obtain quantitative maps more rapidly similar to MR-Fingerprinting approach18. Comparison of the results with histology and other myelin imaging methods such as DWI and MT are planned to further our understanding of the utility of mcUTE.Acknowledgements
No acknowledgement found.References
1. Weiskopf N, Edwards LJ, Helms G, Mohammadi S, Kirilina E. Quantitative magnetic resonance imaging of brain anatomy and in vivo histology. Nat Rev Phys. 2021;3(8):570-588. doi:10.1038/s42254-021-00326-1
2. Mackay A, Whittall K, Adler J, Li D, Paty D, Graeb D. In vivo visualization of myelin water in brain by magnetic resonance. Magnetic Resonance in Medicine. 1994;31(6):673-677. doi:10.1002/mrm.1910310614
3. Alonso-Ortiz E, Levesque IR, Pike GB. MRI-based myelin water imaging: A technical review. Magn Reson Med. 2015;73(1):70-81. doi:10.1002/mrm.25198
4. Oh SH, Bilello M, Schindler M, Markowitz CE, Detre JA, Lee J. Direct visualization of short transverse relaxation time component (ViSTa). Neuroimage. 2013;83:485-492. doi:10.1016/j.neuroimage.2013.06.047
5. Lee J, Hyun JW, Lee J, et al. So You Want to Image Myelin Using MRI: An Overview and Practical Guide for Myelin Water Imaging. Journal of Magnetic Resonance Imaging. 2021;53(2):360-373. doi:10.1002/jmri.27059
6. MacKay AL, Laule C. Magnetic Resonance of Myelin Water: An in vivo Marker for Myelin. Brain Plast. 2(1):71-91. doi:10.3233/BPL-160033
7. Myelin water imaging to detect demyelination and remyelination and its validation in pathology - Laule - 2018 - Brain Pathology - Wiley Online Library. https://onlinelibrary.wiley.com/doi/10.1111/bpa.12645. Accessed November 3, 2023.
8. Duhamel G, Prevost VH, Cayre M, et al. Validating the sensitivity of inhomogeneous magnetization transfer (ihMT) MRI to myelin with fluorescence microscopy. Neuroimage. 2019;199:289-303. doi:10.1016/j.neuroimage.2019.05.061
9. Varma G, Girard OM, Prevost VH, Grant AK, Duhamel G, Alsop DC. Interpretation of magnetization transfer from inhomogeneously broadened lines (ihMT) in tissues as a dipolar order effect within motion restricted molecules. J Magn Reson. 2015;260:67-76. doi:10.1016/j.jmr.2015.08.024
10. Chan KS, Marques JP. Multi-compartment relaxometry and diffusion informed myelin water imaging – Promises and challenges of new gradient echo myelin water imaging methods. NeuroImage. 2020;221:117159. doi:10.1016/j.neuroimage.2020.117159
11. Ma YJ, Jang H, Lombardi AF, Corey-Bloom J, Bydder GM. Myelin water imaging using a short-TR adiabatic inversion-recovery (STAIR) sequence. Magn Reson Med. 2022;88(3):1156-1169. doi:10.1002/mrm.29287
12. van der Weijden CWJ, García DV, Borra RJH, et al. Myelin quantification with MRI: A systematic review of accuracy and reproducibility. Neuroimage. 2021;226:117561. doi:10.1016/j.neuroimage.2020.117561
13. Mancini M, Karakuzu A, Cohen-Adad J, Cercignani M, Nichols TE, Stikov N. An interactive meta-analysis of MRI biomarkers of myelin. Jbabdi S, Baker CI, Jbabdi S, Does M, eds. eLife. 2020;9:e61523. doi:10.7554/eLife.61523
14. Lazari A, Lipp I. Can MRI measure myelin? Systematic review, qualitative assessment, and meta-analysis of studies validating microstructural imaging with myelin histology. Neuroimage. 2021;230:117744. doi:10.1016/j.neuroimage.2021.117744
15. Ilbey S, Antonia S, Uzay E, Michael B, Ali CÖ. Multi-Contrast Multi-Resolution UTE for Simultaneous Quantitative and High-Resolution MRI. In Proc Intl Soc Mag Reson Med 32. 5110. https://cds.ismrm.org/protected/23MPresentations/abstracts/5110.html.
16. Reisert M, Kellner E, Dhital B, Hennig J, Kiselev VG. Disentangling micro from mesostructure by diffusion MRI: A Bayesian approach. Neuroimage. 2017;147:964-975. doi:10.1016/j.neuroimage.2016.09.058
17. Peters AM, Brookes MJ, Hoogenraad FG, et al. T2* measurements in human brain at 1.5, 3 and 7 T. Magnetic Resonance Imaging. 2007;25(6):748-753. doi:10.1016/j.mri.2007.02.014
18. Ma D, Gulani V, Seiberlich N, et al. Magnetic resonance fingerprinting. Nature. 2013;495(7440):187-192. doi:10.1038/nature11971
Figures