4587
Quantitative MRI biomarker for classification of clinically significant prostate cancer: calibration for reproducibility across echo times1Department of Radiation Medicine and Applied Sciences, University of California San Diego, La Jolla, CA, United States, 2Department of Radiology, University of California San Diego, La Jolla, CA, United States, 3Department of Neurosciences, University of California San Diego, La Jolla, CA, United States, 4Halicioglu Data Science Institute, University of California San Diego, La Jolla, CA, United States, 5Department of Bioengineering, University of California San Diego, La Jolla, CA, United States
Synopsis
Keywords: Quantitative Imaging, Quantitative Imaging, Prostate
Motivation: Restriction Spectrum Imaging restriction score (RSIrs) is a quantitative biomarker for detection of clinically significant prostate cancer. However, magnitude of RSIrs is influenced by imaging parameters, including echo time (TE).
Goal(s): We introduce a calibration technique to generate consistent RSIrs biomarker values for data acquired with different TEs.
Approach: We demonstrate a partial linear relationship between RSIrs and TE and compare calibrated to reference RSIrs values at two TEs
Results: The proposed calibration reduced bias between calibrated and reference RSIrs values.
Impact: Restriction Spectrum Imaging restriction score (RSIrs) is a quantitative MRI biomarker of clinically significant prostate cancer, but RSIrs values are dependent on echo time. This study introduces an approach to calibrate RSIrs for echo time variations and yield reproducible results.
Introduction
Restriction Spectrum Imaging restriction score (RSIrs) is a quantitative biomarker for the detection of clinically significant prostate cancer (csPCa). RSIrs uses a diffusion model that describes diffusion signal with a linear combination of four exponential decay curves, representing different tissue compartments[1]. RSIrs is defined as signal from the slowest (intracellular restricted) compartment (called C1), normalized by median signal intensity of the prostate at low b-value (mb0).RSIrs has demonstrated superior detection of csPCa compared to Apparent Diffusion Coefficient, and similar performance to that of PI-RADS v2.1[2, 3]. However, imaging parameters, such as echo time (TE), have an impact on the quantitative RSIrs value. To fully exploit the potential of RSIrs as a quantitative biomarker, we propose a straightforward calibration method for data acquired at different TEs.
Materials and Methods
This IRB-approved study included 198 consecutive patients who underwent MRI (3T Discovery MR750, GE Healthcare, 32-channel phased-array body coil) and biopsy. 95 had csPCa (grade group ≥2); 103 did not. Automated whole-gland prostate segmentation was performed on T2-weighted images (Cortechs Labs, San Diego, CA, USA).RSI acquisitions sampled five diffusion-weighted imaging (DWI) b-values (0, 50, 800, 1500, 3000 s/mm2; Table 1). RSI data were acquired twice with minimum TE (TEmin1 and TEmin2) and once with TE 90ms (TE90). Processing and analysis were performed using custom code in MATLAB (MathWorks, Inc). DWI were corrected for B0 inhomogeneities, gradient nonlinearity and eddy currents[4] and normalized by median urine signal intensity.
Training of the calibration model was limited to patients without csPCa; all patients were used to test calibration. A linear scaling factor (f) was estimated for each diffusion compartment (C). TE90 was partially fit with linear regression to match the mean values derived from TEmin1 and TEmin2 within the interval ranging from 95th to 99th percentile of signal intensity within the prostate. We focused on high percentiles of RSIrs because the highest values of RSIrs within each prostate are used to detect presence of csPCa [3].
We compared differences (mean and SD) between RSIrs from reference TEmin1 (RSIrsTEmin1) and from repeated TEmin2 (RSIrsTEmin2), uncorrected TE90 (RSIrsTE90), and calibrated TE90 (RSIrsTE90_corr). The difference between RSIrsTEmin2 and RSIrsTEmin1, acquired within minutes of each other with the same TE, represents the best achievable calibration and defines the minimum error between serial acquisitions. RSIrs comparisons were made at 98th percentile within each patient’s prostate.
Results and Discussion
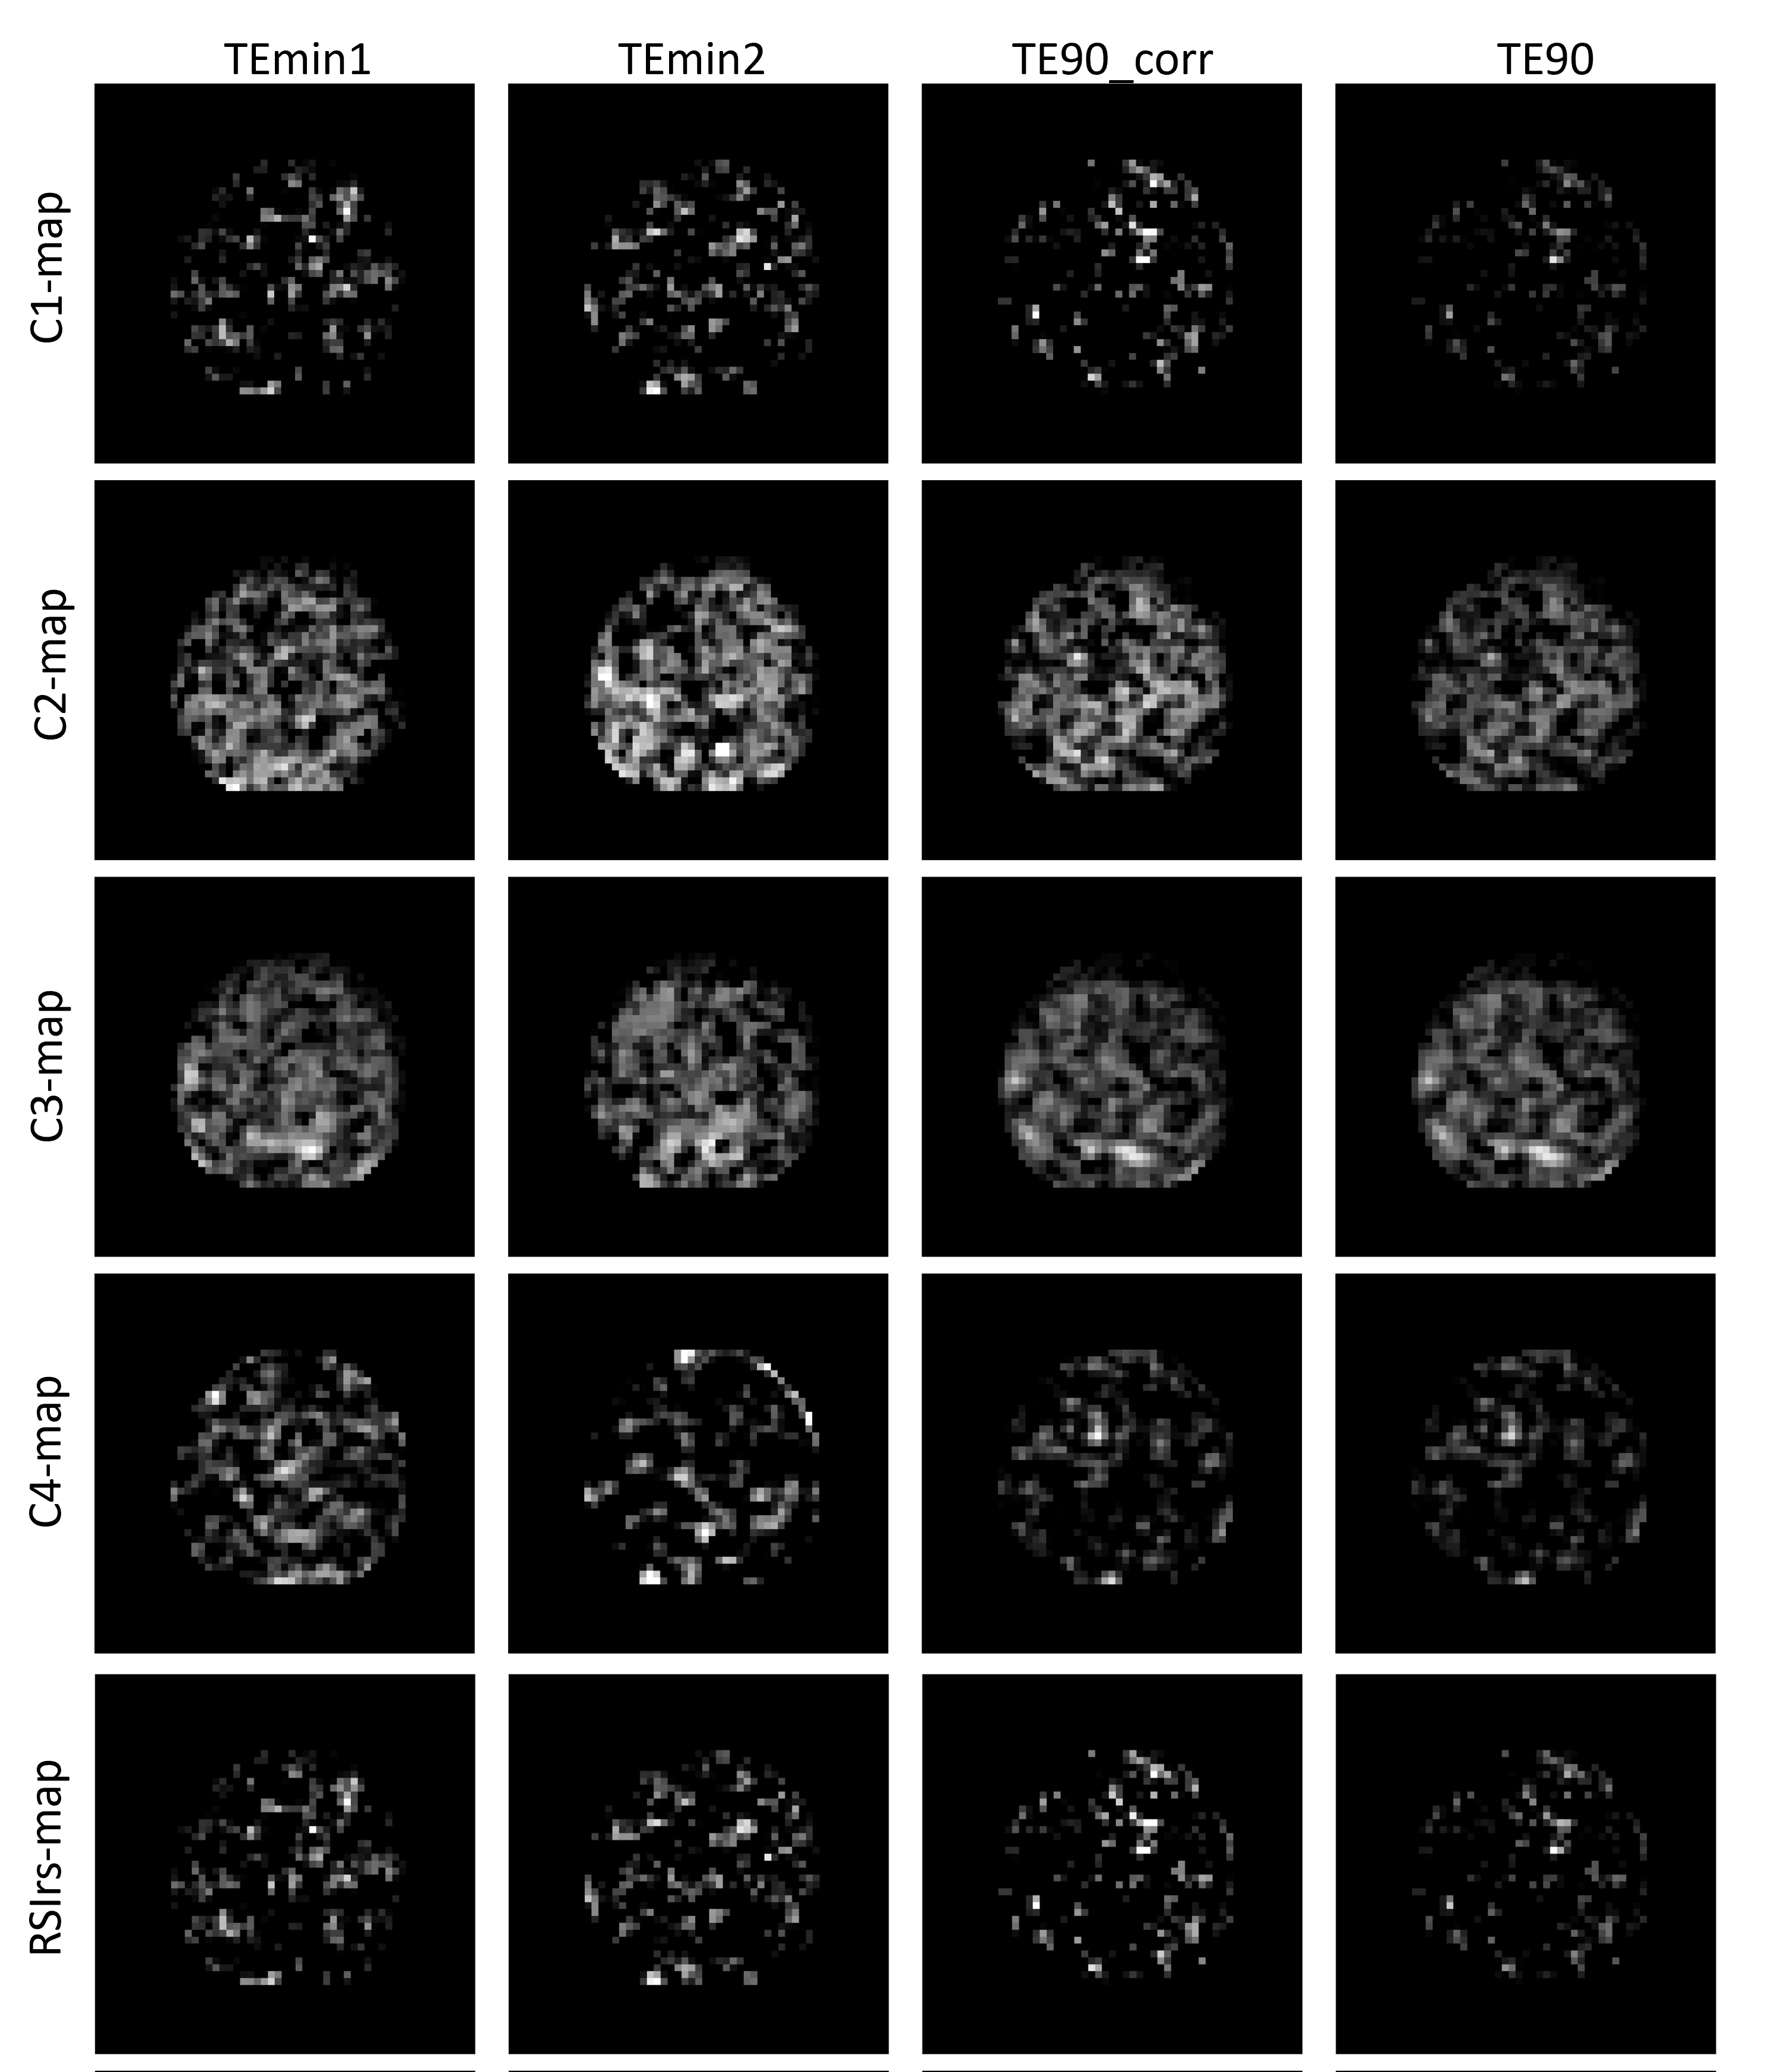
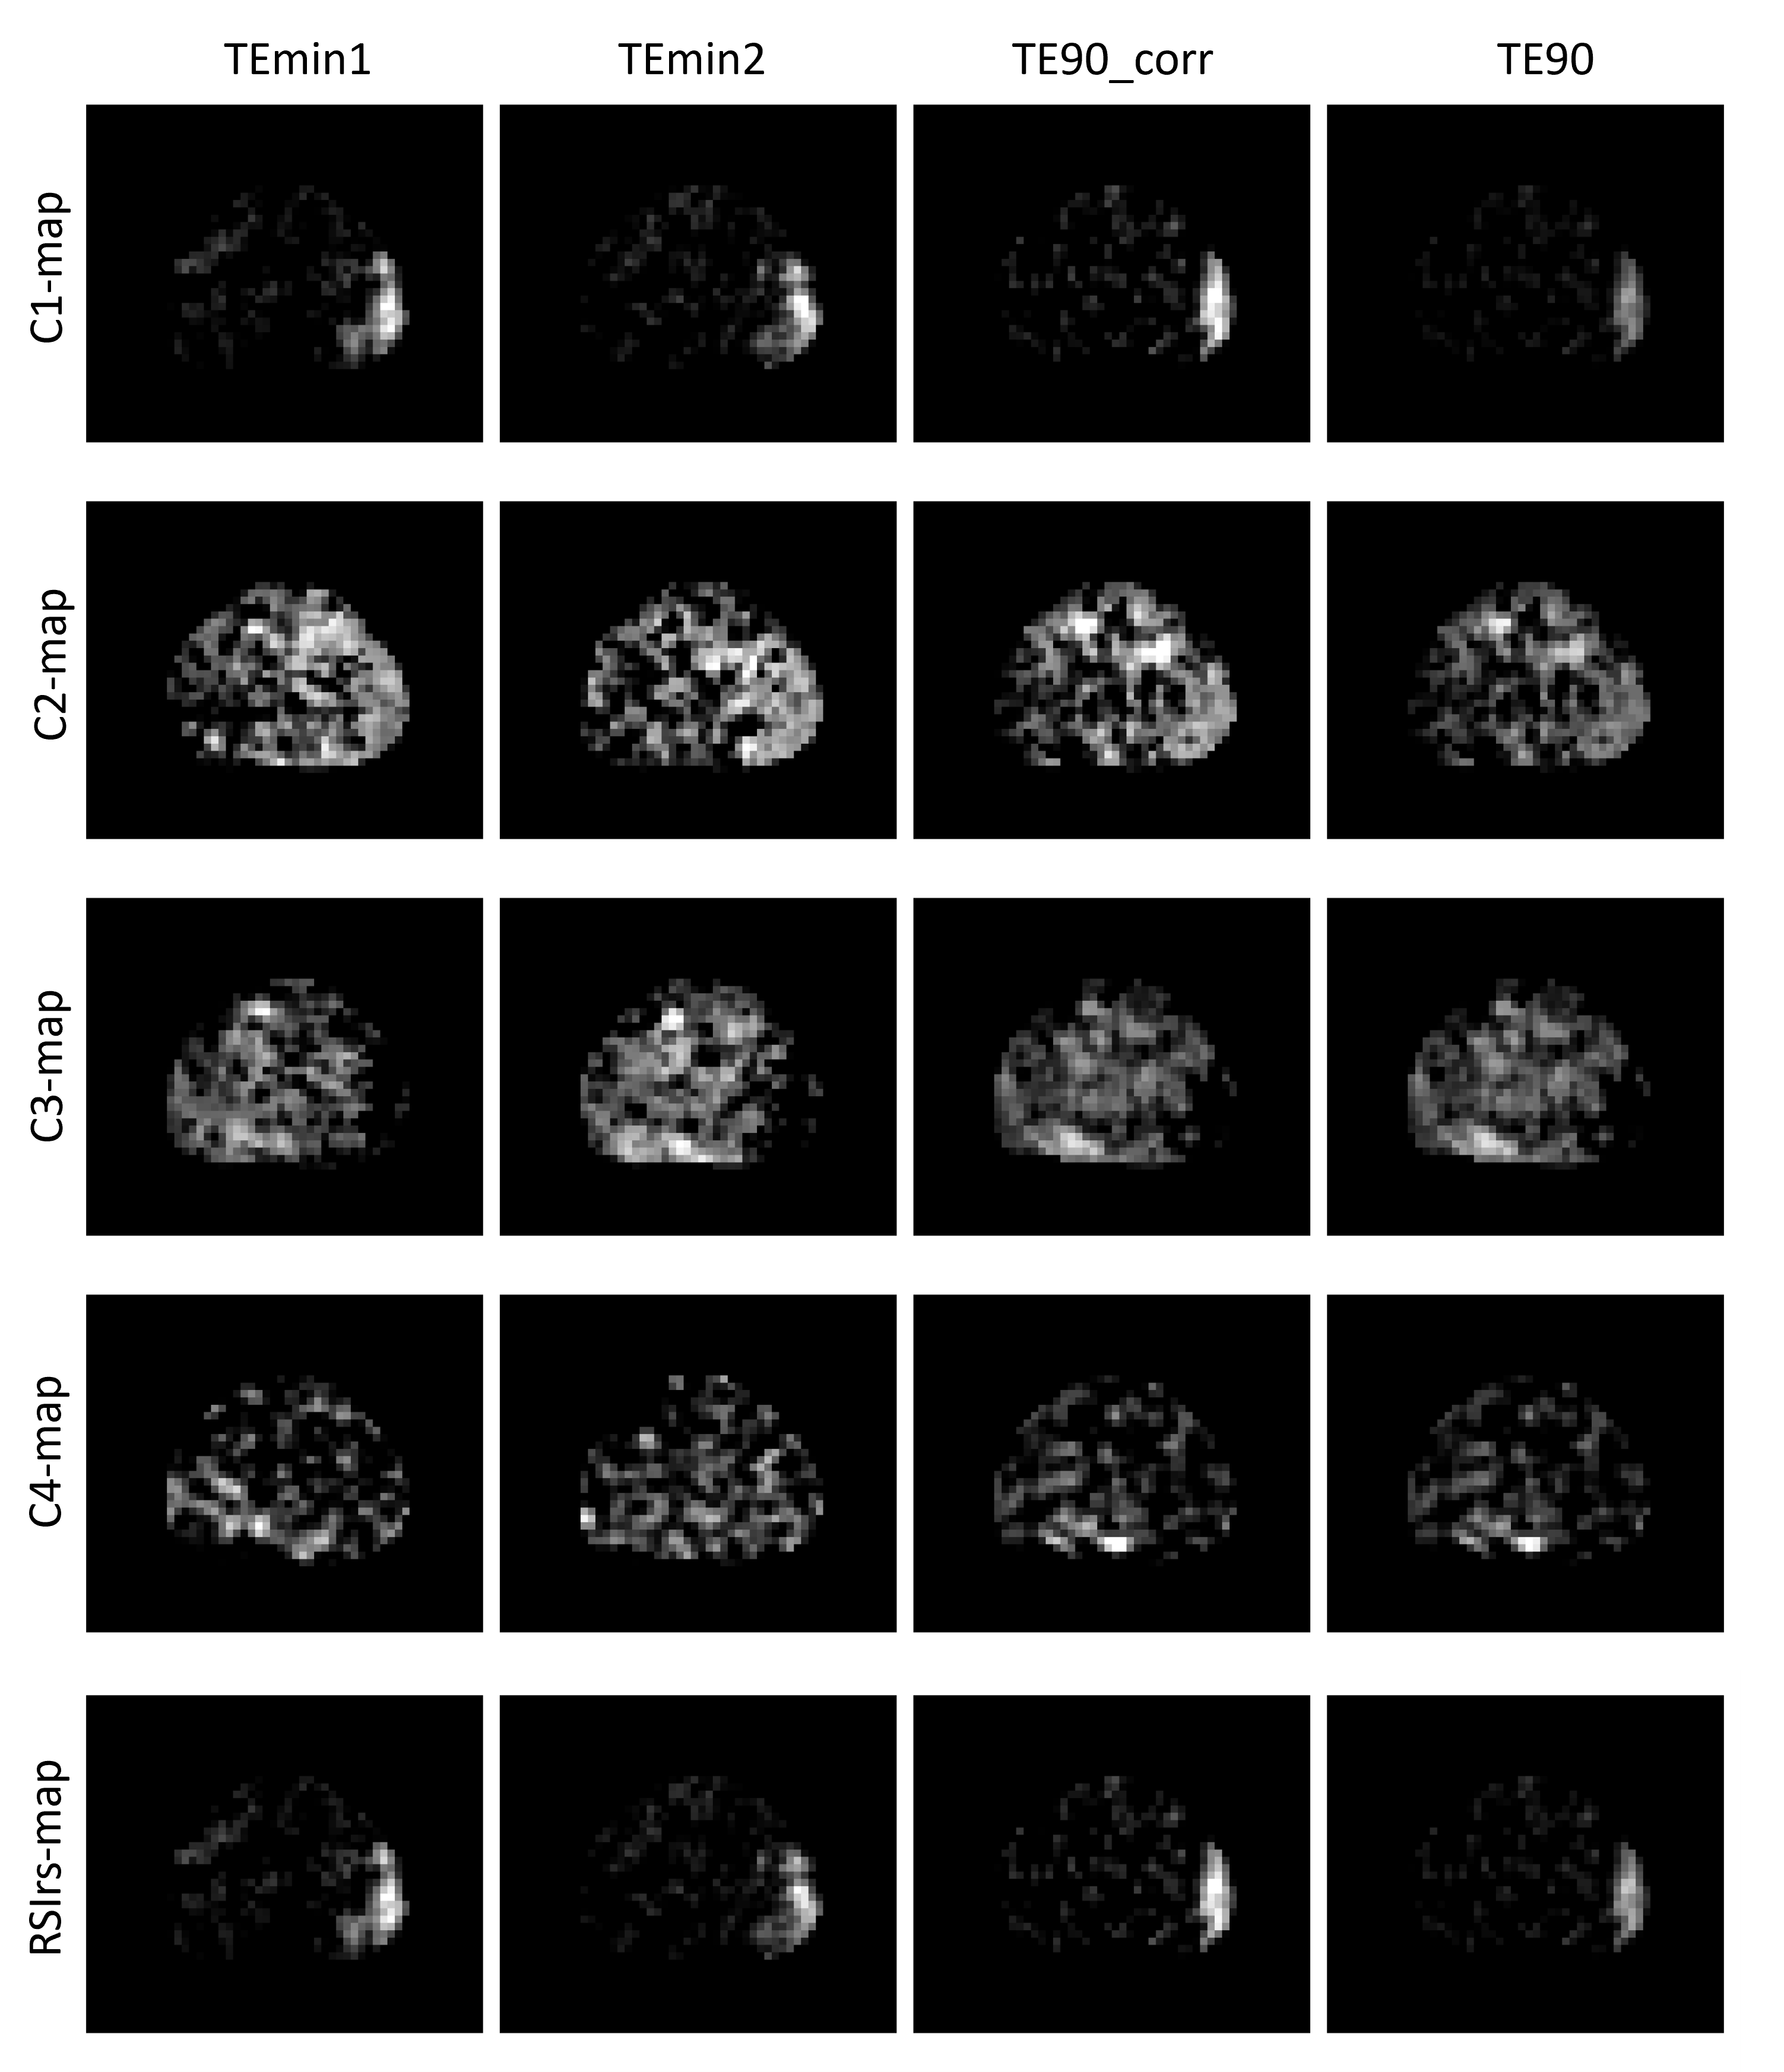
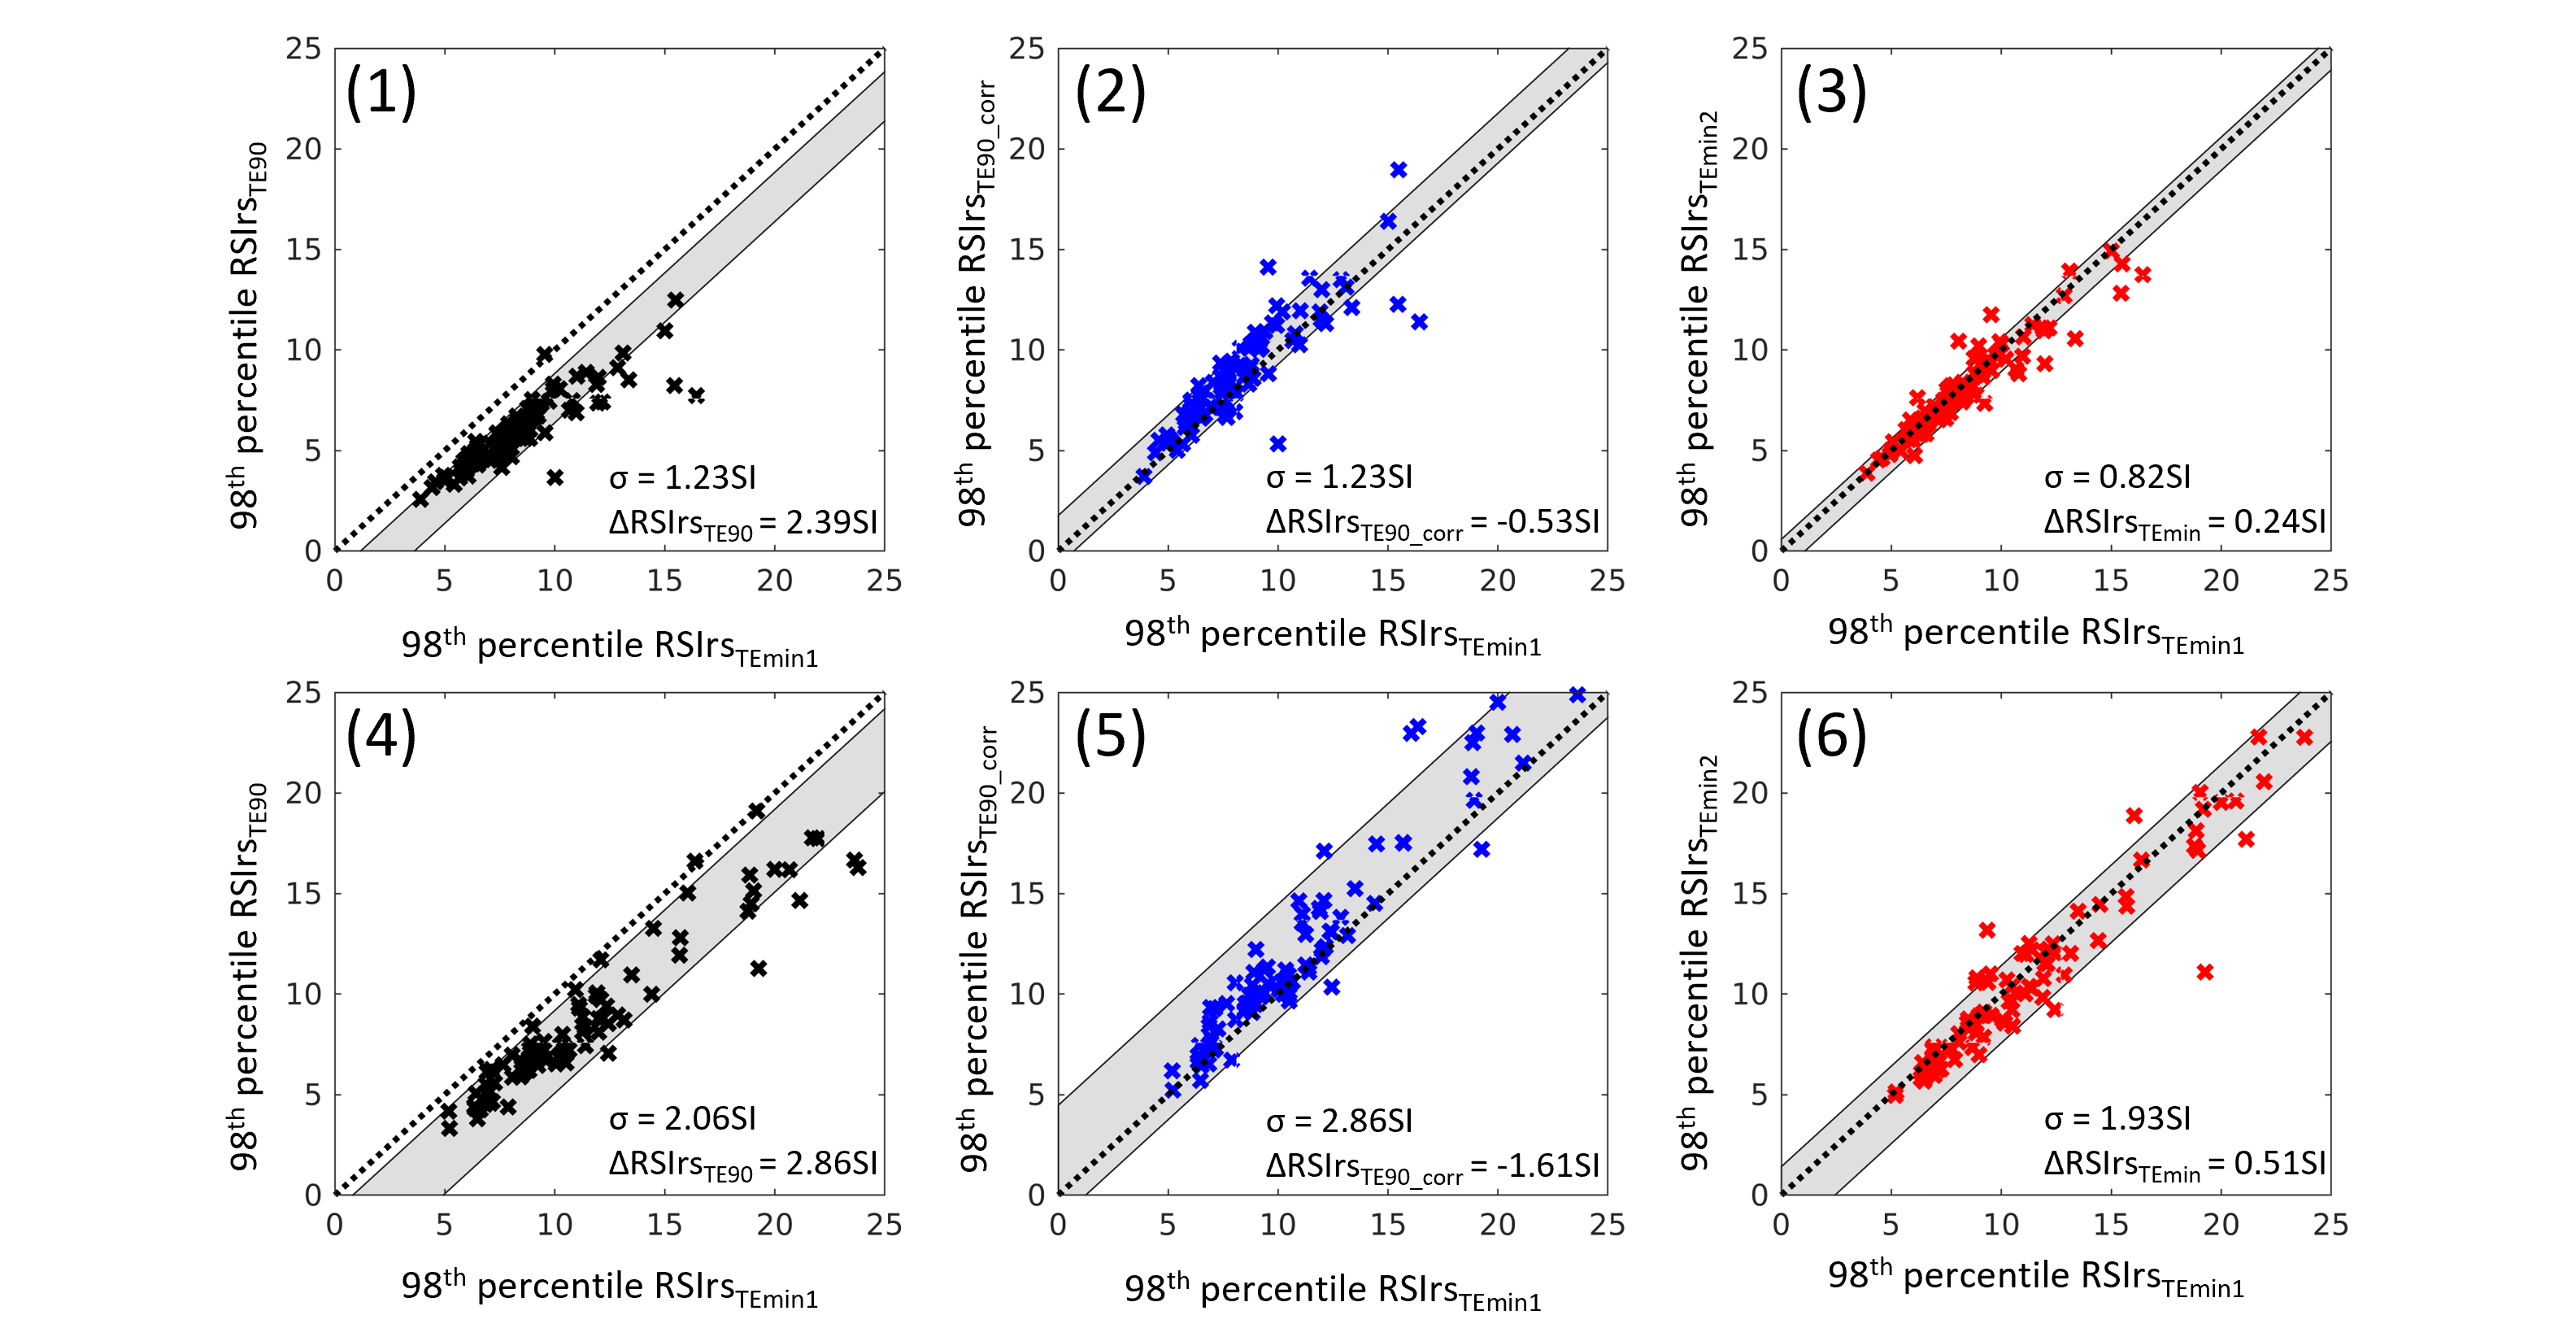
Scaling factors for were estimated as 1.85, 1.36, 1.01 and 1.16 for C1, C2, C3 and C4, respectively. Leveraging these scaling factors, DWI was synthesized (as if acquired at the reference TE), and a calibrated mb0 value was estimated for normalization purposes. Example cases are shown in Figure 1 (no csPCa) and Figure 2 (csPCa).Figure 3 shows the 98th percentile of RSIrsTE90, RSIrsTE90_corr, and RSIrsTEmin2 within the prostate for each patient in comparison to the reference, the 98th percentile of RSIrsTEmin1. In non-csPCa cases, the assessment revealed a mean and standard deviation (σ) of 0.24±0.82SI for the comparison of the 98th percentile of RSIrsTEmin2 to RSIrsTEmin1. Comparing the 98th percentile of RSIrsTE90 to RSIrsTEmin1, a higher mean and σ was determined (2.39±1.23SI), meaning that changing the TE by ~15ms resulted in a 10-fold increase in the difference between RSIrs measurement (vs. simply repeating the acquisition at the same TE). After calibration, though, the bias between the two series was -0.53SI, a 78% reduction in absolute error.
For patients with csPCa, 98th percentile of RSIrsTEmin2 differed from RSIrsTEmin1 by 0.51±1.93SI. Prior to calibration the difference between 98th percentile of RSIrsTE90 and RSIrsTEmin1 was 2.87±2.06SI, representing a greater than 5-fold increase in difference (vs. repeat acquisition at same TE). After calibration, this mean difference improved to ‑1.61SI, a 44% reduction in absolute error.
The presented calibration method demonstrated an improvement of inherent bias between RSIrsTE90 and RSIrsTEmin1. Residual error (in 98th percentile of RSIrs) after calibration was 78% percent smaller in prostates without csPCa and 44% smaller in prostates with csPCa.
Conclusions
DWI metrics are highly dependent on TE. A change of ~15ms in TE during the same MR exam resulted in errors 5-fold (csPCa cases) or 10-fold (benign prostates) greater than that seen by simply repeating the acquisition with the same TE. A simple linear calibration is effective to yield similar quantitative biomarker values for acquisitions with a different TE, reducing the TE-induced error by 44% and 78% for csPCa and benign prostates, respectively.Acknowledgements
No acknowledgement found.References
[1] Conlin CC, Feng CH, Rodriguez-Soto AE, et al. Improved Characterization of Diffusion in Normal and Cancerous Prostate Tissue Through Optimization of Multicompartmental Signal Models. Journal of Magnetic Resonance Imaging 2021; 53: 628–639.
[2] Feng CH, Conlin CC, Batra K, et al. Voxel-level Classification of Prostate Cancer on Magnetic Resonance Imaging: Improving Accuracy Using Four-Compartment Restriction Spectrum Imaging. Journal of Magnetic Resonance Imaging 2021; 54: 975–984.
[3] Zhong AY, Digma LA, Hussain T, et al. Patient-level detection of grade group ≥2 prostate cancer using quantitative diffusion MRI. 2021; 2021.05.24.21256461.
[4] Holland D, Kuperman JM, Dale AM. Efficient correction of inhomogeneous static magnetic field-induced distortion in Echo Planar Imaging. Neuroimage 2010; 50: 175–183.
[5] McCammack KC, Kane CJ, Parsons JK, et al. In vivo prostate cancer detection and grading using restriction spectrum imaging-MRI. Prostate Cancer Prostatic Dis 2016; 19: 168–173.
Figures