4584
Correlation analysis between quantitative-T2 and diffusion-MRI measurements in human white matter: a study across different field strengths.1Bernard and Irene Schwartz Center for Biomedical Imaging, Department of Radiology, New York University Grossman School of Medicine, New York, NY, United States, 2Center for Advanced Imaging Innovation and Research (CAI2R), Department of Radiology, New York University Grossman School of Medicine, New York, NY, United States
Synopsis
Keywords: Quantitative Imaging, Quantitative Imaging
Motivation: Quantitative MRI is increasingly translated to low (<=0.55T) and high (>=7T) field strengths. Yet, differences in the underlying biophysics across field strengths remain poorly understood.
Goal(s): To identify and understand deviations in the correlation of T2 and diffusion metrics at extreme field strengths.
Approach: Quantitative T2 and diffusion MRI maps were computed from a comprehensive MRI protocol at 0.55T, 1.5T, 3T, and 7T.
Results: We observe decreased correlation between T2 relaxation and diffusivity at high field strengths, while the results at 0.55T align well with clinical field strengths, which shows the ground for optimization of experimental design at low- and ultra-low fields.
Impact: T2 and diffusion-MRI commonly complement each other in clinical imaging. Our results show a similar correlation of related metrics, suggesting shared information on tissue properties, which can be used to optimize experimental design at low- and ultra-low fields.
Introduction
Quantitative MRI is important for developing biomarkers for the early detection and monitoring of neurological diseases and for evaluating drug treatments. Quantitative MRI models are most widely used on MRI scanners with clinical field strengths (1.5T–3T), but their interpretation remains under-studied at lower (0.55T) or higher (7T) field strength1. In this study, we analyze the relation between T2 relaxation and diffusion across different field strengths and show the premises and advantages of performing quantitative MRI on a wide range of field strengths.Methods
A comprehensive MRI protocol was designed for 0.55T, 1.5T, 3T, and 7T systems, and tested on one healthy subject. The protocol includes:- MP-RAGE2.
- Diffusion-weighted imaging (DWI) using a 2D-EPI sequence with 2 mm isotropic resolution. The repetition times ranged between 5.5 and 6.8 seconds across field strengths, the echo time was 73 ms, and the b-values were 10x0, 60x500, and 60x1000 s/mm².
- T2 mapping, employing a 2D multi-echo spin-echo3,4 sequence with 2 mm isotropic resolution. 10 ms echo-spacing was adopted consistently across all field strengths.
Data analysis involved:
- T2 mapping using EMC dictionary matching8.
- Diffusion tensor imaging and extraction of Fractional Anisotropy (FA) and Mean Diffusivity (MD) maps.
- Region of interest (ROI) analysis using the Johns Hopkins University (JHU) atlas9,10,11 segmentation with diffeomorphic registration through ANTs12. The fiber orientation within each voxel was calculated using peak extraction following constrained spherical deconvolution13,14. ROI-average fiber orientation w.r.t B0 (𝜃) was computed from the resulting dyadic tensor15, 16.
Results
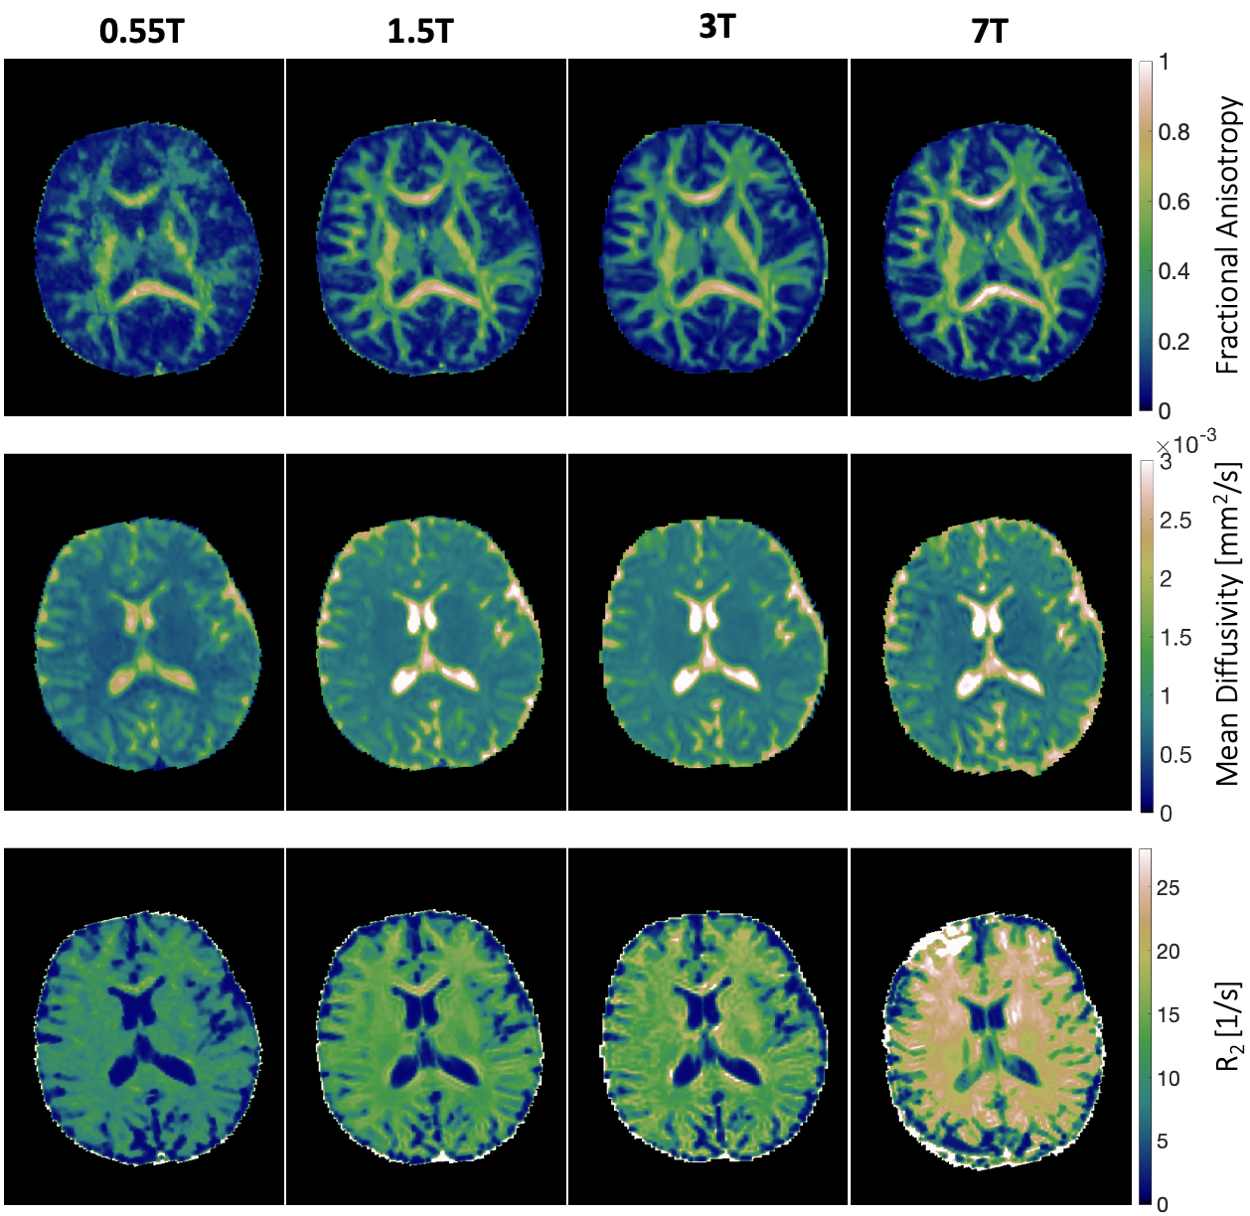
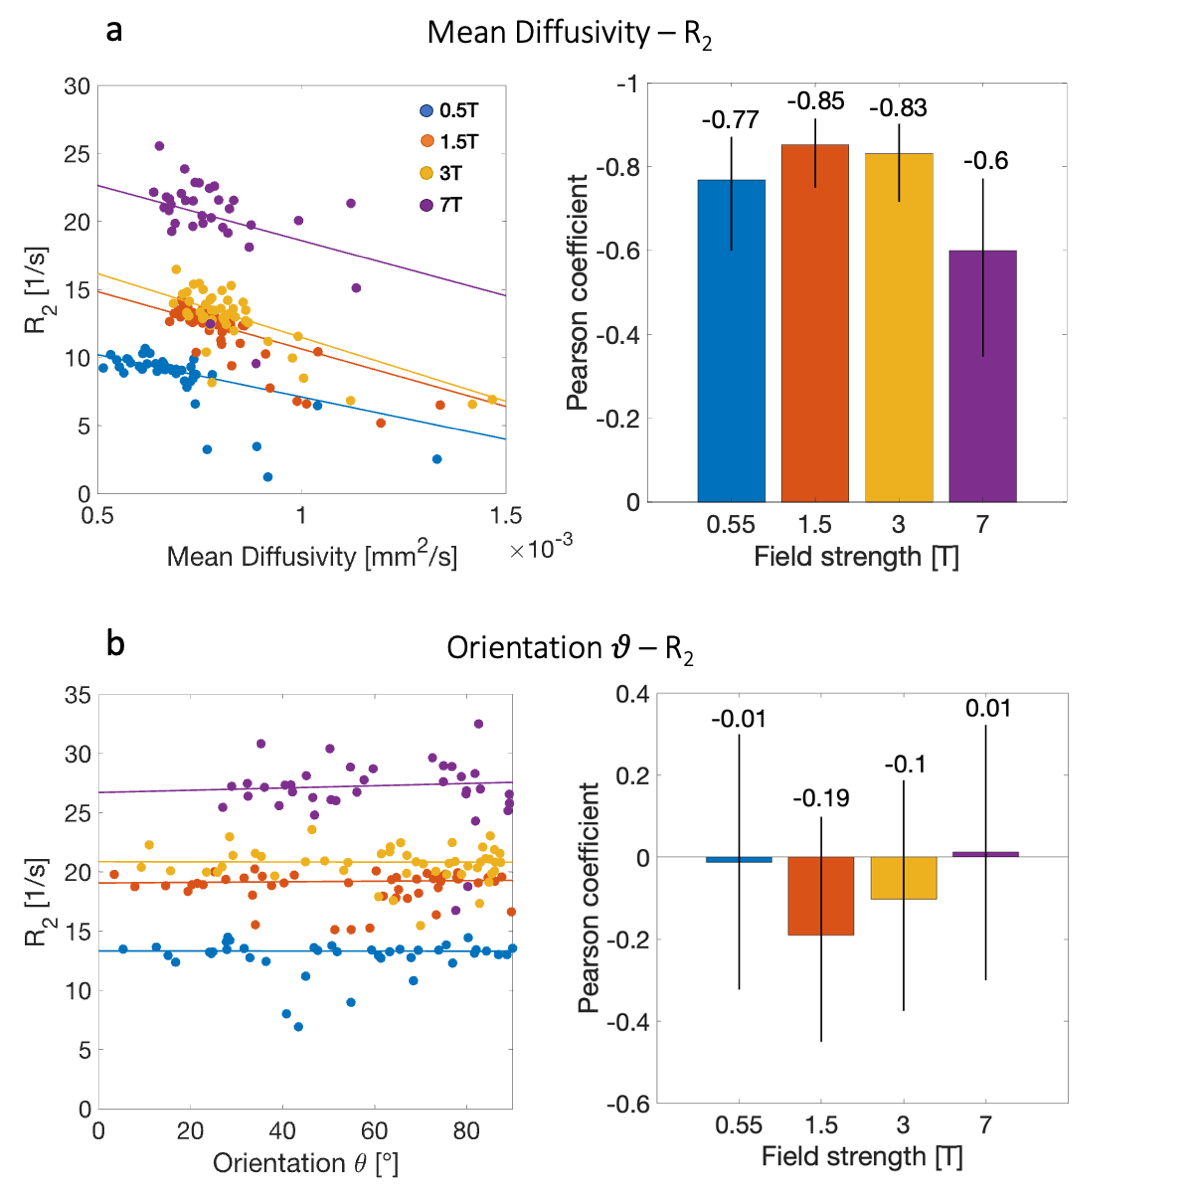
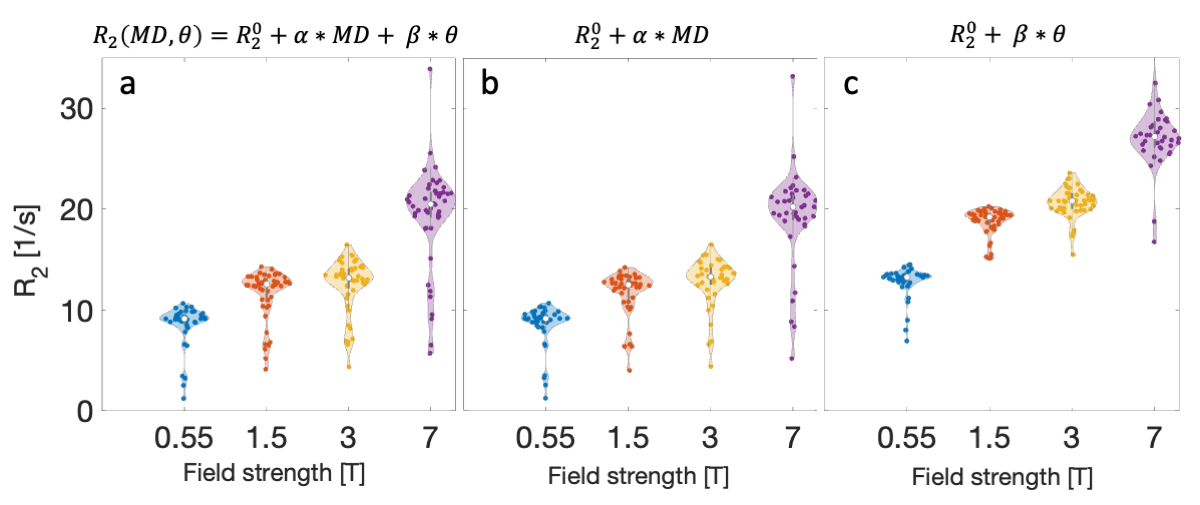
Example quantitative maps are shown in Fig. 1 for all field strengths. A white matter ROI analysis suggests increased variability of R2 at higher B0 fields (Fig. 2A). We observed a weaker correlation between R2 and the mean diffusivity at 7T. In contrast, the correlation coefficient does not further increase when moving from 1.5 or 3T to 0.55T. Regardless of the field strength, we did not find a significant correlation between R2 and the fiber orientation 𝜃, i.e., the angle between the fibers and B0 (Fig. 2B). In Fig. 3, we show the linear regression of R2, with and without regressing out the mean diffusivity and 𝜃. The results confirm the above-described findings: the data suggests that the mean diffusivity is a strong predictor of R2, while the fiber orientation is not (Fig. 3C).Discussion
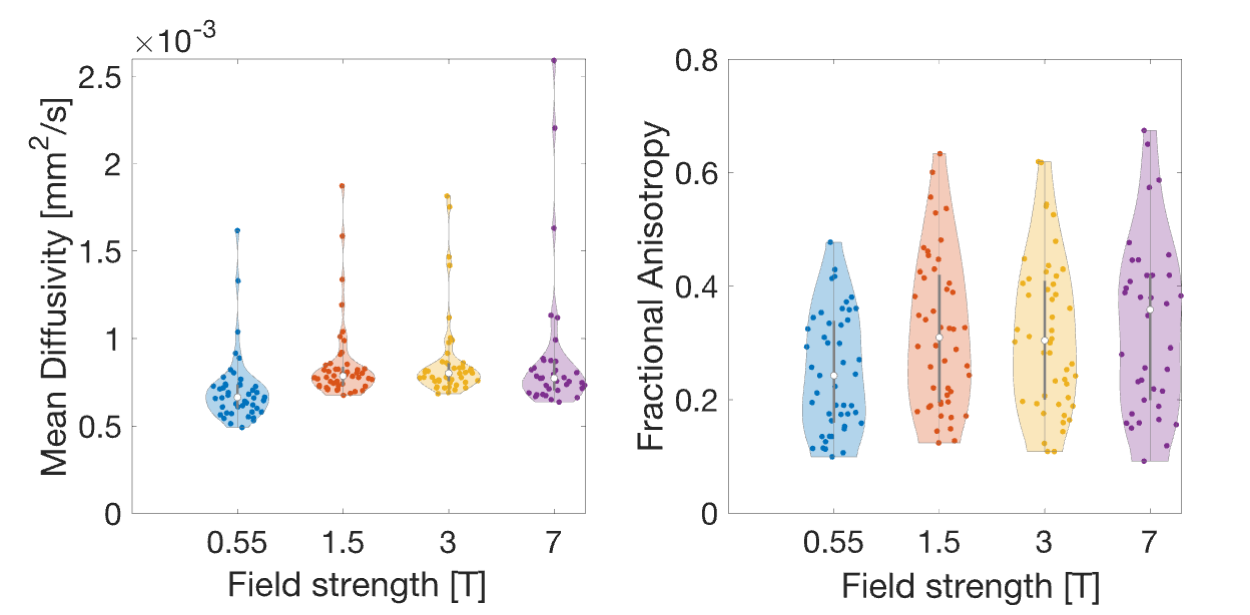
The effect of B0 on the correlation between T2 relaxation and diffusion, shown in Figs. 2–4, is in line with previous literature17,18. The slight reduction of diffusivity and R2 at 0.55T (Fig. 2 and 4) are potentially caused by a Rician bias that will require a tailored correction19. We hypothesize that the reduced MD and increased FA at 7T compared to 1.5T and 3T (Fig. 4) result from the presence of multiple tissue compartments in the white matter, including intra- and extra-axonal spaces20. However, we found no significant dependence of R2 to the fiber orientation 𝜃 (Fig. 2B), which suggests that susceptibility effects, e.g. due to iron concentrations, could be the major factor in our R2 differences across B017. The strong correlation between R2 and MD at lower-field strength (0.55T), shows that quantitative T2 and diffusion-MRI encode shared information on white matter properties. Gaining more insight into the relation between the two metrics will be important to optimize the experimental design of low-field and ultra-low field MRI (<0.1T) experiments, thereby advancing reproducible quantitative measurements in a feasible scan time across field strengths. While we are collecting additional data, we here show the premise of using cross-scanner evaluations of quantitative T2 and diffusion-MRI metrics to improve understanding of quantitative models.Acknowledgements
This work was performed under the rubric of the Center for Advanced Imaging Innovation and Research (CAI2R, www.cai2r.net), an NIBIB National Center for Biomedical Imaging and Bioengineering (NIH P41 EB017183).References
- Hori M, Hagiwara A, Goto M, Wada A, Aoki S. Low-Field Magnetic Resonance Imaging: Its History and Renaissance. Invest Radiol. 2021 Nov 1;56(11):669-679.
- Brant-Zawadzki M, Gillan GD, Nitz WR. MP RAGE: a three-dimensional, T1-weighted, gradient-echo sequence--initial experience in the brain. Radiology. 1992 Mar;182(3):769-75.
- Carr H. Y. and Purcell E. M. Effects of Diffusion on Free Precession in Nuclear Magnetic Resonance Experiments. Phys. Rev. 94, 630.
- Meiboom S, Gill D. Modified Spin-Echo Method for Measuring Nuclear Relaxation Times. Rev Sci Instrum. 1958;29(8):688–691.
- Ades-Aron B, Veraart J, Kochunov P, et al. Evaluation of the accuracy and precision of the diffusion parameter EStImation with Gibbs and NoisE removal pipeline. Neuroimage. 2018;183:532-543.
- Veraart J, Novikov DS, Christiaens D, et al. Denoising of diffusion MRI using random matrix theory. Neuroimage. 2016;142:394-406.
- Avants BB, Tustison NJ, Stauffer M, Song G, Wu B, Gee JC. The Insight ToolKit image registration framework. Front Neuroinform. 2014;8:44.
- Ben-Eliezer N, Sodickson DK, Block KT. Rapid and accurate T2 mapping from multi-spin-echo data using Bloch-simulation-based reconstruction. Magn Reson Med. 2015;73(2):809-17.
- Mori et al., MRI Atlas of Human White Matter. Elsevier, Amsterdam, The Netherlands 2005.
- Wakana et al., Reproducibility of quantitative tractography methods applied to cerebral white matter. NeuroImage. 2007; 36:630-644.
- Hua et al., Tract probability maps in stereotaxic spaces: analysis of white matter anatomy and tract-specific quantification. NeuroImage. 2008; 39(1):336-347.
- Avants BB, Epstein CL, Grossman M, Gee JC. Symmetric diffeomorphic image registration with cross-correlation: evaluating automated labeling of elderly and neurodegenerative brain. Med Image Anal. 2008;12(1):26-41.
- C.M.W. Tax, B. Jeurissen, S.B.Vos, M.A. Viergever, et al. Recursive calibration of the fiber response function for spherical deconvolution of diffusion MRI data. NeuroImage.2014; 86; 67–80.
- J.-D. Tournier, F. Calamante, and A. Connelly. Robust determination of the fibre orientation distribution in diffusion MRI: non-negativity constrained super-resolved spherical deconvolution. Neuroimage. 2007; 35;1459–72.
- Basser PJ, Pajevic S. Statistical artifacts in diffusion tensor MRI (DT-MRI) caused by background noise. Magn Reson Med. 2000 Jul;44(1):41-50.
- Jones DK. Determining and visualizing uncertainty in estimates of fiber orientation from diffusion tensor MRI. Magn Reson Med. 2003 Jan;49(1):7-12.
- Gossuin, Y., Roch, A., Muller, R.N. et al. Relaxation induced by ferritin and ferritin-like magnetic particles: The role of proton exchange. Magn. Reson. Med. 2000; 43: 237-243.
- Zhan L, Mueller BA, Jahanshad N, et al. Magnetic resonance field strength effects on diffusion measures and brain connectivity networks. Brain Connect. 2013;3(1):72-86.
- Koay CG, Ozarslan E, Basser PJ. A signal transformational framework for breaking the noise floor and its applications in MRI. J Magn Reson. 2009;197(2):108-19.
- Kleban E, Tax CMW, Rudrapatna US, et al. Strong diffusion gradients allow the separation of intra- and extra-axonal gradient-echo signals in the human brain. Neuroimage. 2020. 15;217:116793.
Figures