4583
Characterizing cortical morphology alterations in ASD children aged 12 to 48 months1The First Affiliated Hospital of Xi'an Jiaotong University, Xi'an, China, 2Shaanxi Engineering Research Center of Computational Imaging and Medical Intelligence, Xi'an, China, Xi'an, China, 3Department of Research and Development, Shanghai United Imaging Intelligence Co., Ltd., Shanghai, China, Shanghai, China
Synopsis
Keywords: Image Reconstruction, Brain
Motivation: Investigate the age-specific anatomical abnormalities in the brains of children with ASD, and provide valuable insights into the development and progression of the disorder.
Goal(s): Analyze the differences in cortical thickness, surface area, and volume between individuals with ASD and typically developing control (TDC) children aged 12-48 months.
Approach: The study reconstructed the cerebral cortex from MRI images of children aged 12 to 48 months in ASD and TDC groups, analyzing the differences of cortical thickness, surface area and volume between groups.
Results: The study identified different growth trajectories in cortical thickness, surface area and volume growth in ASD and TDC groups.
Impact: The study highlights the significance of investigating the neural underpinnings of ASD, which can ultimately lead to more effective treatments and support for affected individuals and their families.
Introduction
Autism spectrum disorder (ASD) is a lifelong neurodevelopmental disorder that typically manifests in early childhood. The global prevalence of ASD is estimated to be approximately 1-2%. ASD is characterized by significant cognitive and motor challenges, often accompanied by atypical development of brain anatomy, function and connectivity[1]. These structural changes in the brain typically emerge between the ages of 6 and 12 months in individuals with ASD[2]. Investigating age-specific anatomical anomalies in autism is of great significance and has wide-ranging implications for the broader understanding of this disorder. In this study, we employed a deep learning algorithm to reconstruct the cerebral cortex, enabling us to analyze differences in cortical thickness, surface area, and volume between individuals with ASD and typically developing control (TDC) children. Additionally, we delved into the distinctive cortical alterations observed in children with ASD between the ages of 12 to 48 months.Methods
This study was approved by the local Institutional Review Board, and written informed consent was obtained from the parents of all participating children before the MRI examination. The study included 75 children diagnosed with ASD (with a CARS score > 37) and 52 typically developing control children aged between 12 and 48 months (Table 1). MRI images were acquired using a 3.0T scanner (MAGNETOM Skyra; Siemens Healthcare, Erlangen, Germany) equipped with a 32-channel head coil. The imaging parameters were as follows: (1) 3D T1WI: TR/TE=2020 ms/2.11 ms; matrix=244×216; section thickness=1 mm; FOV=244×216). In this study, all images were processed using an image analysis tool named uAI Research Portal (Shanghai United Imaging Intelligence Co. Ltd)[3]. Briefly, the preprocessing includes skull stripping, bias correction, and tissue segmentation. Cortical surfaces were then reconstructed, using the framework of CorticalFlow architecture, where cortical vertices were deformed to the cortical boundaries after a series of deformations[4]. Cortical thickness, volume, and surface area of the 68 cortical regions were obtained. All statistical analyses were conducted using SPSS 26.0 and Origin 2023b software.Result
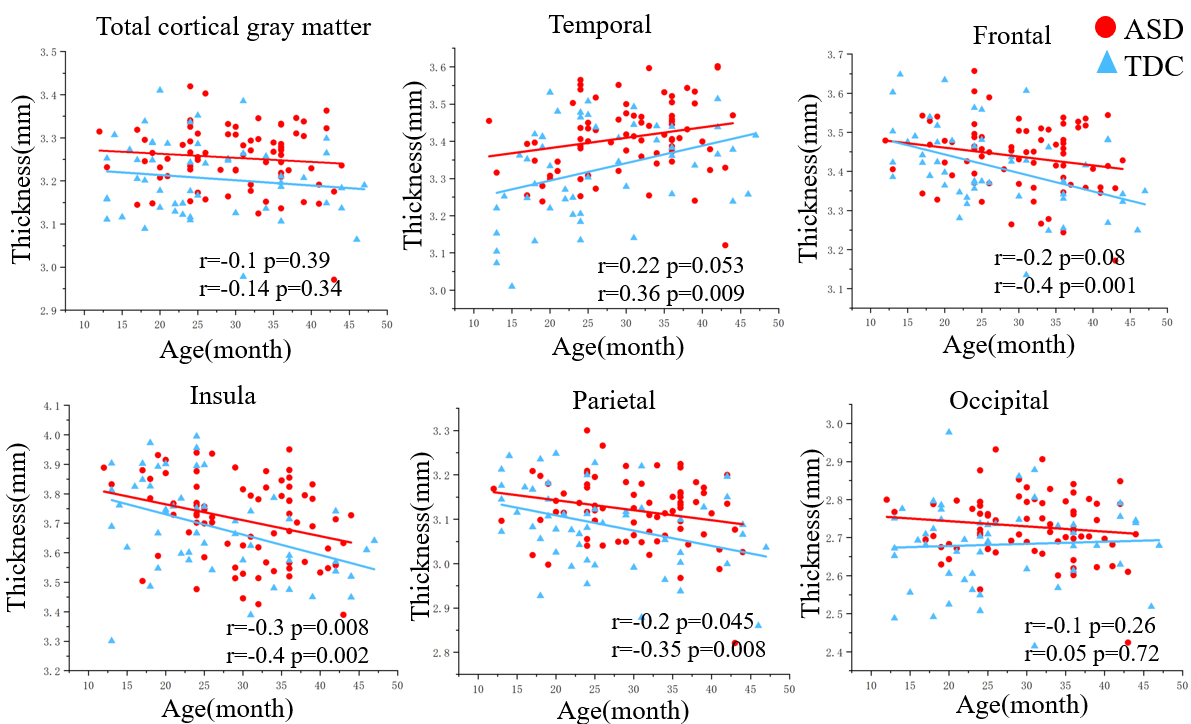
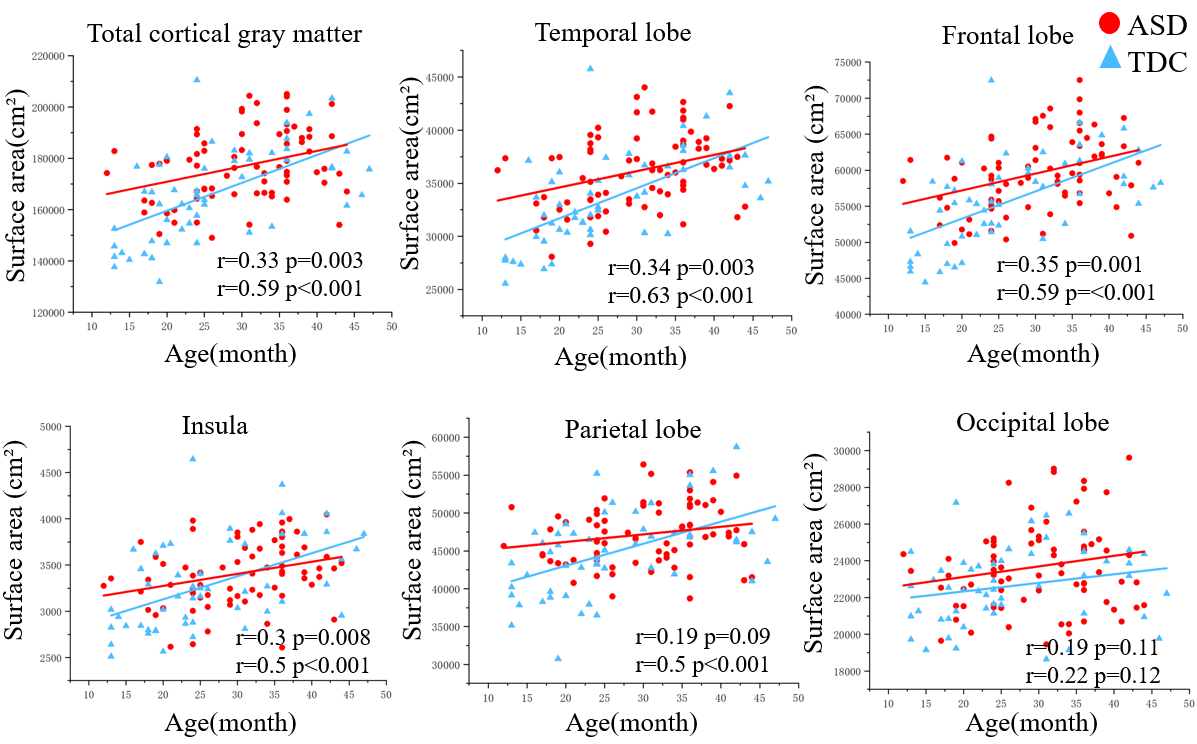
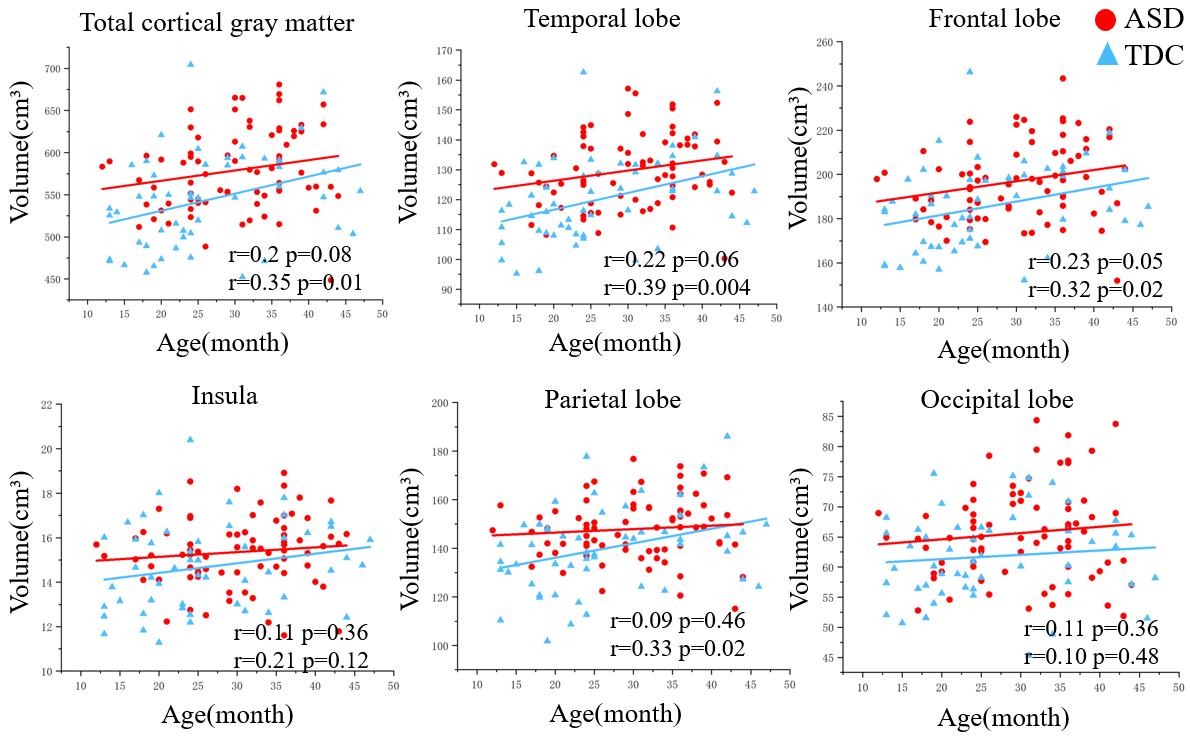
The cortical surface area and volume in ASD group were significantly higher (p<0.05) than those in TDC group at 12 month. Age-related cortical thinning was observed across the parietal (rASD=-0.2, rTDC=-0.4) and insula (rASD=-0.3, rTDC=-0.4) lobes in both groups, while the cortical thickness in temporal lobe (rASD=0.22, rTDC=0.36) grows along age in both groups in 12-48 months. The liner fitting curve revealed slower age-related rate of cortical change in ASD than typically developing control subjects in temporal, insula and parietal lobes (Figure 1). Increased cortical surface area in both groups were found in total cortical gray matter (rASD=0.33, rTDC=0.59), temporal (rASD=0.34, rTDC=0.63), frontal (rASD=0.35, rTDC=0.59) and insula (rASD=0.3, rTDC=0.5) lobes. The liner fitting curve shows that cortical surface area in ASD grow slower than TDC in above regions (Figure 2). The similar trend was observed in cortical volume in frontal lobe (rASD=0.23, rTDC=0.32) (Figure 3).Discussion
The result has revealed trends of the alterations in cortical thickness, surface area, and volume in individuals with ASD and TDC subjects. The cortical surface area and volume in ASD group were significantly higher than those in TDC group at 12-24 month. Previous studies have shown significant difference in cortical surface and no significant difference in cortical volume between 6-12 months in ASD patients and healthy controls[5]. Our result suggesting that significant changes in cortical volume in ASD patients begin at 12-24 months of age and significant increase in cortical surface area continues until this stage. The thickness of the insula and parietal cortex decreased significantly with age, while the thickness of the temporal cortex increased significantly with age in both groups. Moreover, the cortical surface area (total cortical gray matter, temporal, frontal, and insula lobes) and volume (frontal lobe) exhibited significant age-related growth between 12 and 48 months. Above findings align with the notion of regional specificity in cortical development[6-7]. The rate of change in cortical surface area and volume in ASD patients between 12 and 48 months was slower than in the TDC group. This may be linked to abnormal cortical overgrowth in individuals with ASD during the early postnatal period and a subsequent period of slow or stagnant growth in early childhood[8]. Our findings suggest that the abnormal cortical overgrowth in individuals with ASD occurs before the age of 12 months, and a slower growth phase ensues between 12 and 48 months of age.Conclusion
The brain of ASD patients increased significantly at 12 months of age, and the alternation of cortical structure entered a slow stage after this period.Acknowledgements
This work was supported by the National Natural Science Foundation of China (82271517) . Please address correspondence to Jian Yang, e-mail: yj1118@mail.xjtu.edu.cn and Chao Jin, e-mail: jinny.369@163.com.References
[1] Lord C, Elsabbagh M, Baird G, Veenstra-Vanderweele J. Autism spectrum disorder. Lancet. 2018;392(10146):508-520.
[2] Li Q, Li Y, Liu B, et al. Prevalence of Autism Spectrum Disorder Among Children and Adolescents in the United States From 2019 to 2020. JAMA Pediatr. 2022;176(9):943-945.
[3] Wu J, Xia Y, Wang X, et al. uRP: An integrated research platform for one-stop analysis of medical images. Front Radiol. 2023;3:1153784.
[4] Léo Lebrat, Rodrigo Santa Cruz, Frédéric de Gournay, et al. CorticalFlow: A Diffeomorphic Mesh Deformation Module for Cortical Surface Reconstruction. NeurIPS 2021. arXiv.2206.02374.
[5] Hazlett HC, Gu H, Munsell BC, et al. Early brain development in infants at high risk for autism spectrum disorder. Nature. 2017;542(7641):348-351.
[6] Zielinski BA, Prigge MB, Nielsen JA, et al. Longitudinal changes in cortical thickness in autism and typical development. Brain. 2014;137(Pt 6):1799-1812.
[7] Piven J, Elison JT, Zylka MJ. Toward a conceptual framework for early brain and behavior development in autism. Mol Psychiatry. 2017;22(10):1385-1394.
[8] Courchesne E, Campbell K, Solso S. Brain growth across the life span in autism: age-specific changes in anatomical pathology. Brain Res. 2011;1380:138-145.
Figures
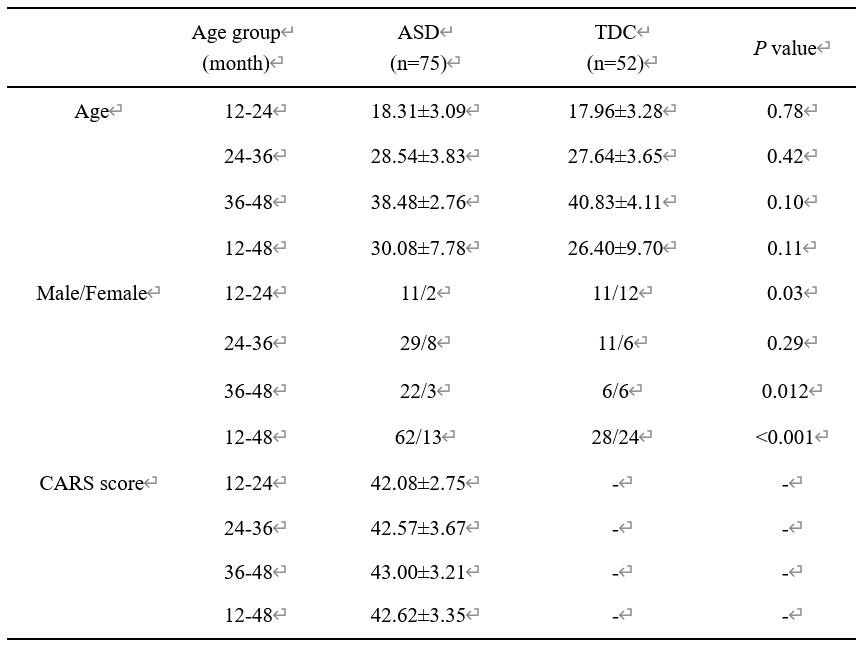
Table 1. Demographic information
CARS: a standardized assessment tool used to assess the severity of symptoms of Autism Spectrum Disorder (ASD) in children. CARS score > 37 were classified as severe ASD.