4582
Line-Scan Gradient Echo Sampling of Turbo Spin Echo (GESTSE) Enables Quantitative Relaxometry in a “Virtual Biopsy” with 150 µm Resolution1Department of Radiology, Perelman School of Medicine at the University of Pennsylvania, Philadelphia, PA, United States, 2Department of Bioengineering, University of Pennsylvania, Philadelphia, PA, United States, 3Perelman School of Medicine at the University of Pennsylvania, Philadelphia, PA, United States, 4Harvard Medical School, Boston, MA, United States, 5Department of Radiology, Boston Children’s Hospital, Boston, MA, United States
Synopsis
Keywords: Pulse Sequence Design, Pulse Sequence Design, Neurodegenerative disease, Quantitative, GESTSE, relaxometry
Motivation: Need for quantitative relaxometry at the spatial scale of cortical laminae to detect layer-specific pathology.
Goal(s): Demonstrate feasibility of Line-Scanned Gradient Echo Sampling of Turbo Spin Echo (GESTSE)
Approach: Novel 1D GESTSE sequence was developed, and data acquired in water phantom and pineapple at 7T. Data fitting algorithm was developed to accurately fit observed measurements and extract quantitative relaxometry data.
Results: With specific gradient spoiling and phase cycling, and a fitting algorithm that accounts for system imperfections, transverse relaxation constants can be estimated at a 150 µm resolution along a 1D line-scan.
Impact: Our novel line-scan GESTSE sequence and fitting algorithm enables accurate quantitative relaxometry at spatial scales sufficient to resolve human cortical laminae. This method offers a new avenue to efficiently detect layer-specific cortical structure and pathology in vivo.
Introduction
Previous work using ex vivo MRI and histopathology has demonstrated significant variations in iron within both healthy cortical laminae and layer-specific pathology in neurodegenerative disease [1,2]. However, the spatial resolution of these features is difficult to acquire with in vivo MRI. Recent work has proposed 1D line-scan gradient echo sampling of spin echo (GESSE) to quantify T2 and T2’ at 250 µm depth resolution with a 3 mm diameter line [3]. However, the previous 1D GESSE sequence uses only a short readout train each TR (e.g., ~40 ms of readout per 2 s TR [3]), reducing overall temporal SNR efficiency. In this study, we developed a 1D line-scan gradient echo sampling of turbo spin echo (GESTSE) sequence with longer readout trains increasing SNR efficiency per TR, enabling efficient measurement across broader range of echo times. We demonstrate that a six-parameter model, including transverse relaxation times, accurately fits data from all echoes, using a specific gradient spoiling and phase cycling scheme to suppress stimulated echoes.Method
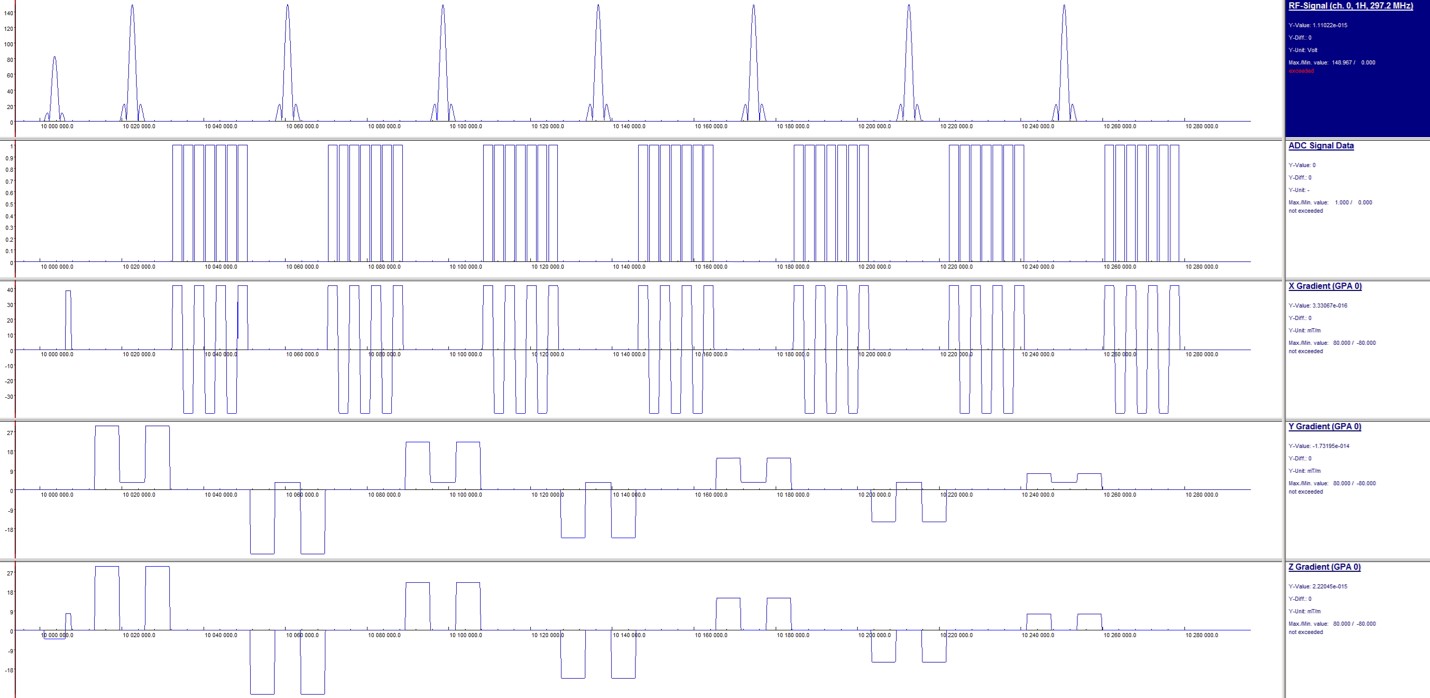
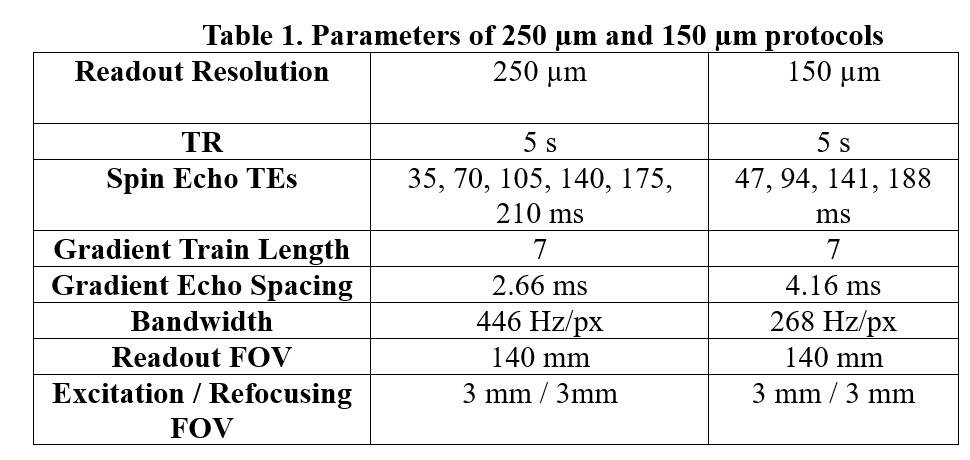
A prototype 1D line-scan GESTSE pulse sequence was implemented on a whole-body 7 T scanner (Magnetom Terra, Siemens Healthineers, Erlangen, Germany). 1D signal is achieved via a slice-selective 90 deg excitation pulse followed by a train of 180 deg refocusing pulses with their slice-selection gradients rotated orthogonal to the excitation axis. Each spin echo is encoded using a train of bipolar gradient echo readouts. Crusher amplitudes decrease and the sign alternates over the spin echo train to minimize coherence of unwanted echo pathways [4] (see Figure 1), with the minimum spoiling gradient moment matched to the previously reported optimal value of 62.6 ms mT/m for a 3mm column diameter [3]. Additionally, after every two TRs, the phase of the inversion pulses is negated, enabling further cancellation of unwanted FID signals when the TRs are averaged for analysis [5]. To compensate for inconsistency between polarities of gradient echo readouts, the polarity of the gradient echo train was reversed after each TR, enabling collection of data with both polarities at every echo-time. A water-based phantom and a pineapple were both scanned with the 1D GESTSE sequence using the vendor’s 32-channel head coil. We acquired two different resolutions having approximately equivalent spin echo train durations: 250 µm (7 echoes) and 150 µm (4 echoes) (see Table 1 for parameters). Raw data was reconstructed and analyzed using custom Python software. Major processing steps were: 1. “Reshuffle” data to create datasets with only positive- or negative-polarity measurements; 2. Complex average all repetitions within each polarity; 3. FFT data in the readout direction; 4. RMS combine all coils within each polarity; 5. Average the magnitudes of the two polarities. This results in a magnitude-valued 2D dataset with the readout axis representing depth along the excited column, and the second axis encoding the echo times (i.e., gradient echo train length $$$×$$$ spin echo train length).Weighted least-squares fitting was performed voxel-wise [6], using a 6-parameter model, derived from the symmetric alpha-stable model of transverse relaxation [7]:
$$s_{i,j}(S_0,T_2,\sigma,\alpha,n,\epsilon) = \sqrt{[S_0n^{i+1}exp(\frac{-\tau_{i,j}}{T_2})exp(-2^{1-\alpha}\mid\frac{t_j}{\sigma}\mid^\alpha)]^2 +\epsilon^2} $$
where $$$s_{i,j}$$$ is the observed signal magnitude at the $$$j^{th}$$$ gradient echo of the $$$i^{th}$$$ spin echo, $$$S_0 > 0$$$ is the signal magnitude, $$$T_2$$$ is the irreversible relaxation time, $$$\sigma>0$$$ is the width parameter for the intra-voxel frequency distribution (e.g., $$$T'_2$$$ when $$$\alpha = 1$$$), $$$\alpha \in (1,2)$$$ is the shape parameter for the intra-voxel frequency distribution, $$$n \in (0,1)$$$ is a multiplicative factor accounting for losses due to imperfect refocusing pulses, $$$\epsilon>0$$$ is the noise floor of the measurements,$$$\tau_{i,j}$$$ is the time (relative to the excitation pulse) of the$$$j^{th}$$$ gradient echo of the $$$i^{th}$$$ spin echo, and $$$t_j$$$ is the time of the $$$j^{th}$$$ gradient echo relative to the center of the gradient echo train.
Results
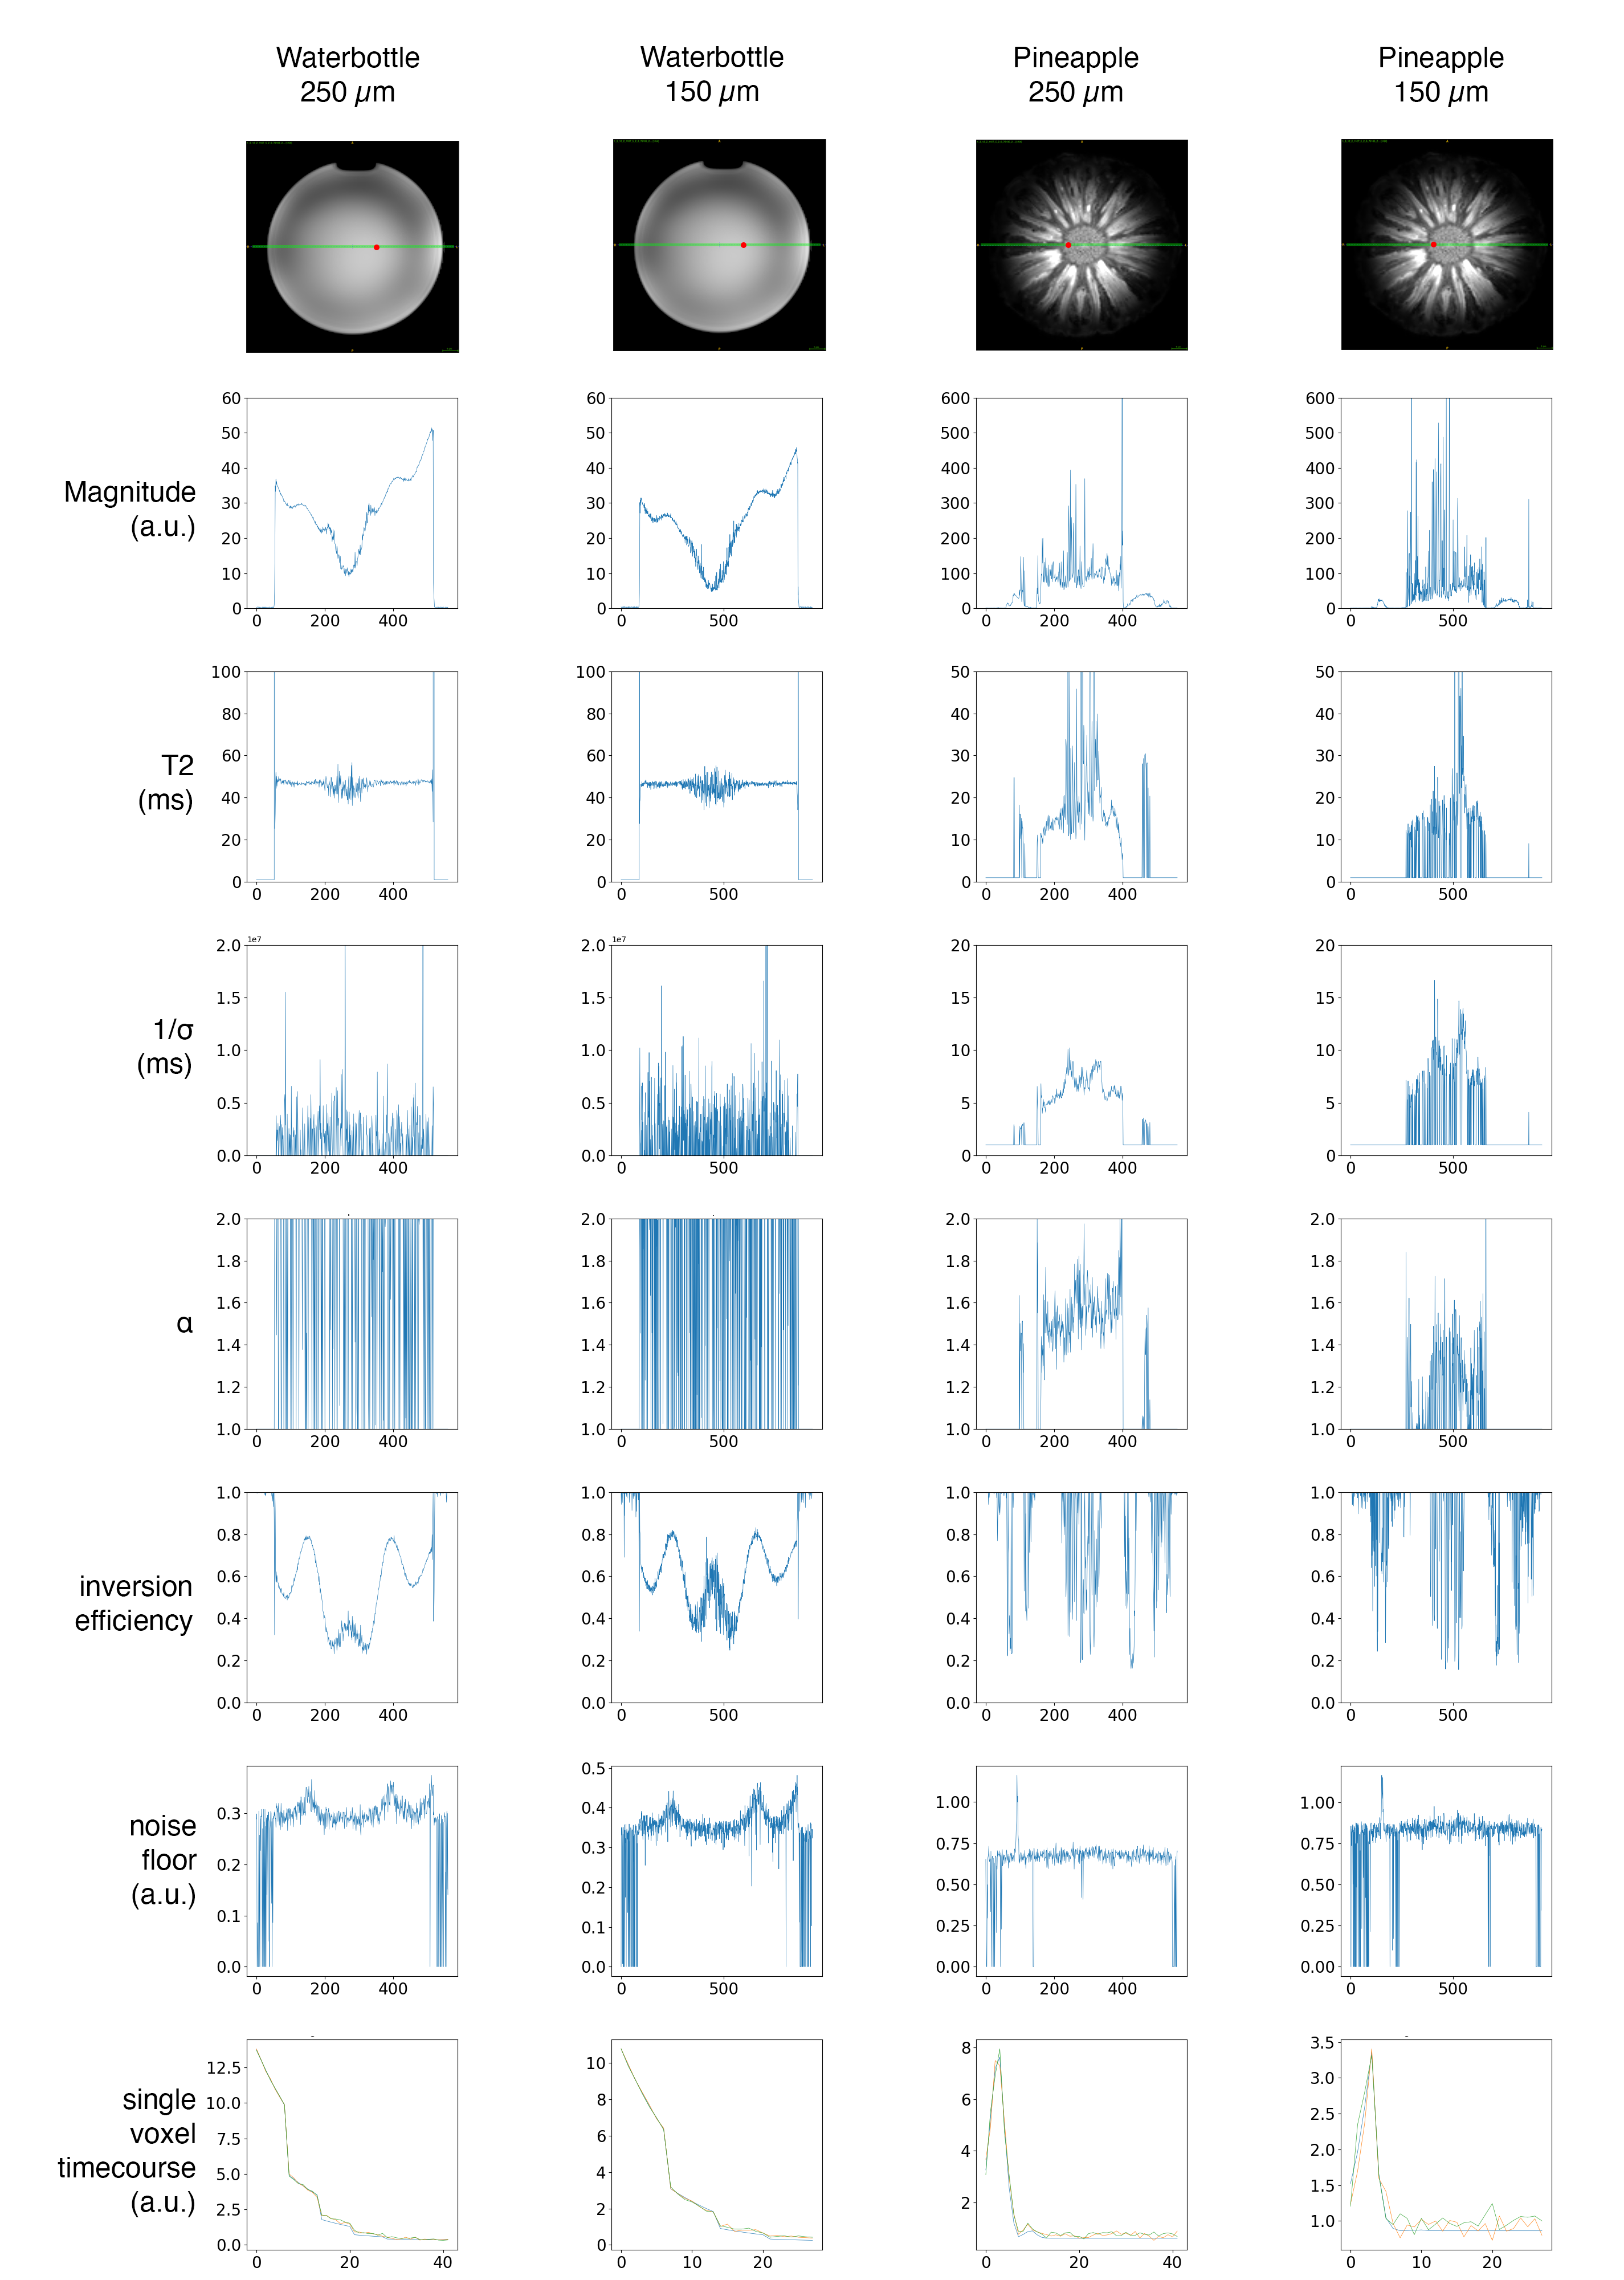
Figure 2 shows results of the two protocols in both the water phantom and pineapple. As expected, the water phantom returns a stable $$$T_2$$$ of 50 ms and long $$$\frac{1}{\sigma}$$$, while the pineapple has short $$$T_2$$$ and $$$\frac{1}{\sigma}$$$. Results are largely consistent between 250 µm and 150 µm datasetsDiscussion and Conclusion
Our results suggest that the proposed 6-parameter model accurately fits data from our novel 1D GESTSE sequence. In the water phantom, the resulting T2 estimate is unbiased relative to the known 50 ms value across a range of SNRs and B1+ conditions. Further work will more quantitatively evaluate the benefit of these additional parameters, particularly in in vivo human brain data. In addition, we intend to explore modifications to the acquisition and modeling to fit multiple pools within each voxel, improving quantification of microstructure.Acknowledgements
The authors would like to acknowledge the support of NIH awards 1R01AG080734 and T32EB009384.References
1. Fukunaga M, Li TQ, van Gelderen P, et al. Layer-specific variation of iron content in cerebral cortex as a source of MRI contrast. Proceedings of the National Academy of Sciences. 2010;107(8):3834-3839. doi:10.1073/pnas.0911177107
2. Tisdall MD, Ohm DT, Lobrovich R, et al. Ex vivo MRI and histopathology detect novel iron-rich cortical inflammation in frontotemporal lobar degeneration with tau versus TDP-43 pathology. NeuroImage: Clinical. 2022;33:102913. doi:10.1016/j.nicl.2021.102913
3. Balasubramanian M, Mulkern RV, Polimeni JR. In vivo irreversible and reversible transverse relaxation rates in human cerebral cortex via line scans at 7 T with 250 micron resolution perpendicular to the cortical surface. Magnetic Resonance Imaging. 2022;90:44-52. doi:10.1016/j.mri.2022.04.001
4. Poon CS, Henkelman RM. Practical T2 quantitation for clinical applications. J Magn Reson Imaging. 1992;2(5):541-553. doi:10.1002/jmri.1880020512
5. Mugler JP. Optimized three-dimensional fast-spin-echo MRI. Journal of Magnetic Resonance Imaging. 2014;39(4):745-767. doi:10.1002/jmri.24542
6. Bonny J, Zanca M, Boire J, Veyre A. T 2 maximum likelihood estimation from multiple spin‐echo magnitude images. Magnetic Resonance in Med. 1996;36(2):287-293. doi:10.1002/mrm.1910360216
7. Steidle G, Schick F. A new concept for improved quantitative analysis of reversible transverse relaxation in tissues with variable microscopic field distribution. Magn Reson Med. 2021;85(3):1493-1506. doi:10.1002/mrm.28534
Figures