4581
Optimising magnetisation preparation for the 7T FLAIR contrast: simulations and experimental validation1CIBM Center for Biomedical Imaging, Geneva, Switzerland, 2Advanced Clinical Imaging Technology, Siemens Healthineers International AG, Lausanne, Switzerland, 3Department of Radiology and Medical Informatics, University of Geneva, Geneva, Switzerland, 4Department of Radiology, Lausanne University Hospital and University of Lausanne, Lausanne, Switzerland, 5LTS5, Ecole Polytechnique Fédérale de Lausanne, Lausanne, Switzerland, 6Neuro-X Institute, Ecole Polytechnique Fédérale de Lausanne, Lausanne, Switzerland
Synopsis
Keywords: Pulse Sequence Design, Simulations
Motivation: At ultra-high field, magnetisation preparation should be adjusted to obtain an adequate FLAIR contrast. However, such optimisation of the pulse sequence and comparison between preparation types are missing.
Goal(s): This work aimed to set a simulation framework to investigate the timing of the magnetisation preparation at 7T. T2 and double inversion recovery preparations were compared.
Approach: Various preparation durations were investigated using simulations and measurements on healthy volunteers.
Results: The image contrast obtained under simulation was experimentally validated. The T2-preparation gave the most promising contrast although the pulses were more prone to B0-inhomogeneity artefacts than the ones from the double inversion recovery preparation.
Impact: We demonstrated that an adequate FLAIR contrast at 7T can be obtained by optimising magnetisation preparation. Simulations can be used to improve the sequence, such as optimising the magnetisation preparation and readout in terms of timings and flip angles.
Introduction
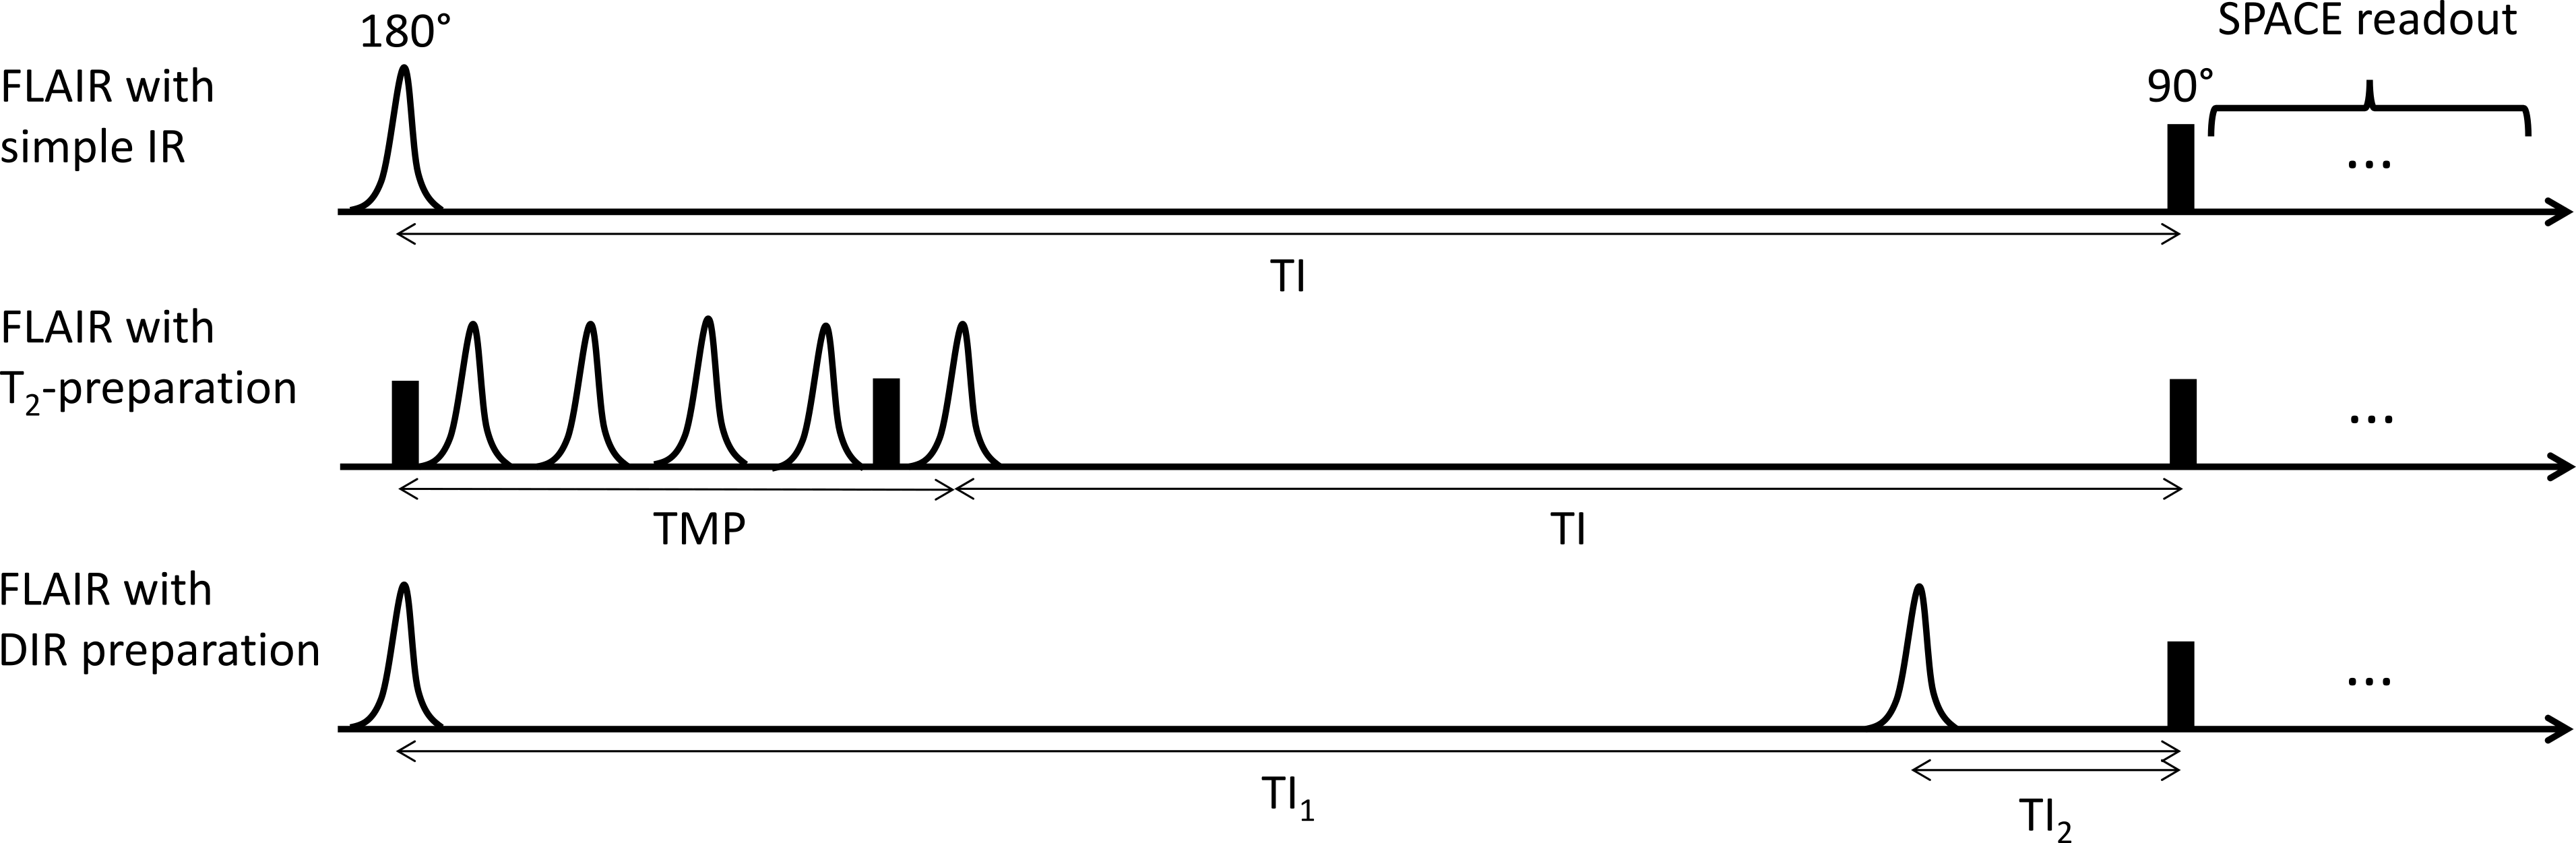
The fluid attenuated inversion recovery (FLAIR) contrast is widely used in clinical routine; e.g., to detect lesions in multiple sclerosis.1 At 7T, a simple inversion pulse as magnetisation preparation results in inadequate contrast due to different relaxometry properties in comparison to lower field strengths. Instead, a T2-preparation (i.e., 90°-180°-180°-180°-180°-90°) followed by an inversion2,3 or a double inversion recovery (DIR)4 can be used. Optimisation and comparison of these different preparations are however lacking.Methods
Extended phase graph (EPG) simulations of the FLAIR sequence with preparations were performed on grey matter (GM; T1/T2=2132/70 ms and proton density (PD) of 0.81),2 white matter (WM; T1/T2=1220/40 ms and PD=0.71),2 cerebrospinal fluid (CSF; T1/T2=4329/1500 ms and PD=1.00),2 GM lesion (T1/T2=2400/120 ms and PD=0.81)3 and WM lesion (T1/T2=2000/100 ms and PD=0.71).3 Given a preparation duration (TMP) for the T2-preparation or first inversion time (TI1) for the DIR, the simulations were used to null the CSF signal around excitation by optimising TI and TI2 respectively (Figure 1). The combinations were: TMP/TI={51/2040, 100/2090, 150/2040, 200/1990} ms for the T2-preparation and TI1/TI2={3100/412, 3230/481, 3370/555, 3500/622} ms for the DIR. Simulations were also used to predict the signal and image contrast, which were visualised using the MNI template.5Healthy volunteers were scanned at 7T (MAGNETOM Terra.X, Siemens Healthcare, Erlangen, Germany) with a 32Rx/1Tx head coil (NOVA Medical). We acquired 3D-FLAIR images with a SPACE readout (TR/TE=8000/264 ms, ETL=180, CAIPIRINHA6=3x2, resolution=0.7x0.7x0.7mm3 after reconstruction). We used the same timings for the T2-preparation and DIR as in the simulations. We also acquired a simple IR FLAIR (TI=2290 ms) and an MP2RAGE research application sequence7 (TR/TE/TI1/TI2=6000/3.08/800/2700 ms, CS=5, 0.6x0.6x0.7mm3).
Regions were manually drawn in cortical GM, WM and background of the T1-weighted image and were registered to the subject’s FLAIR space using FSL FLIRT.8,9 The mean signal in brain tissues and standard deviation of the background signal were used to calculate SNR in cortical GM and WM, and CNR between GM and WM defined as: SNRGM-SNRWM.
Results
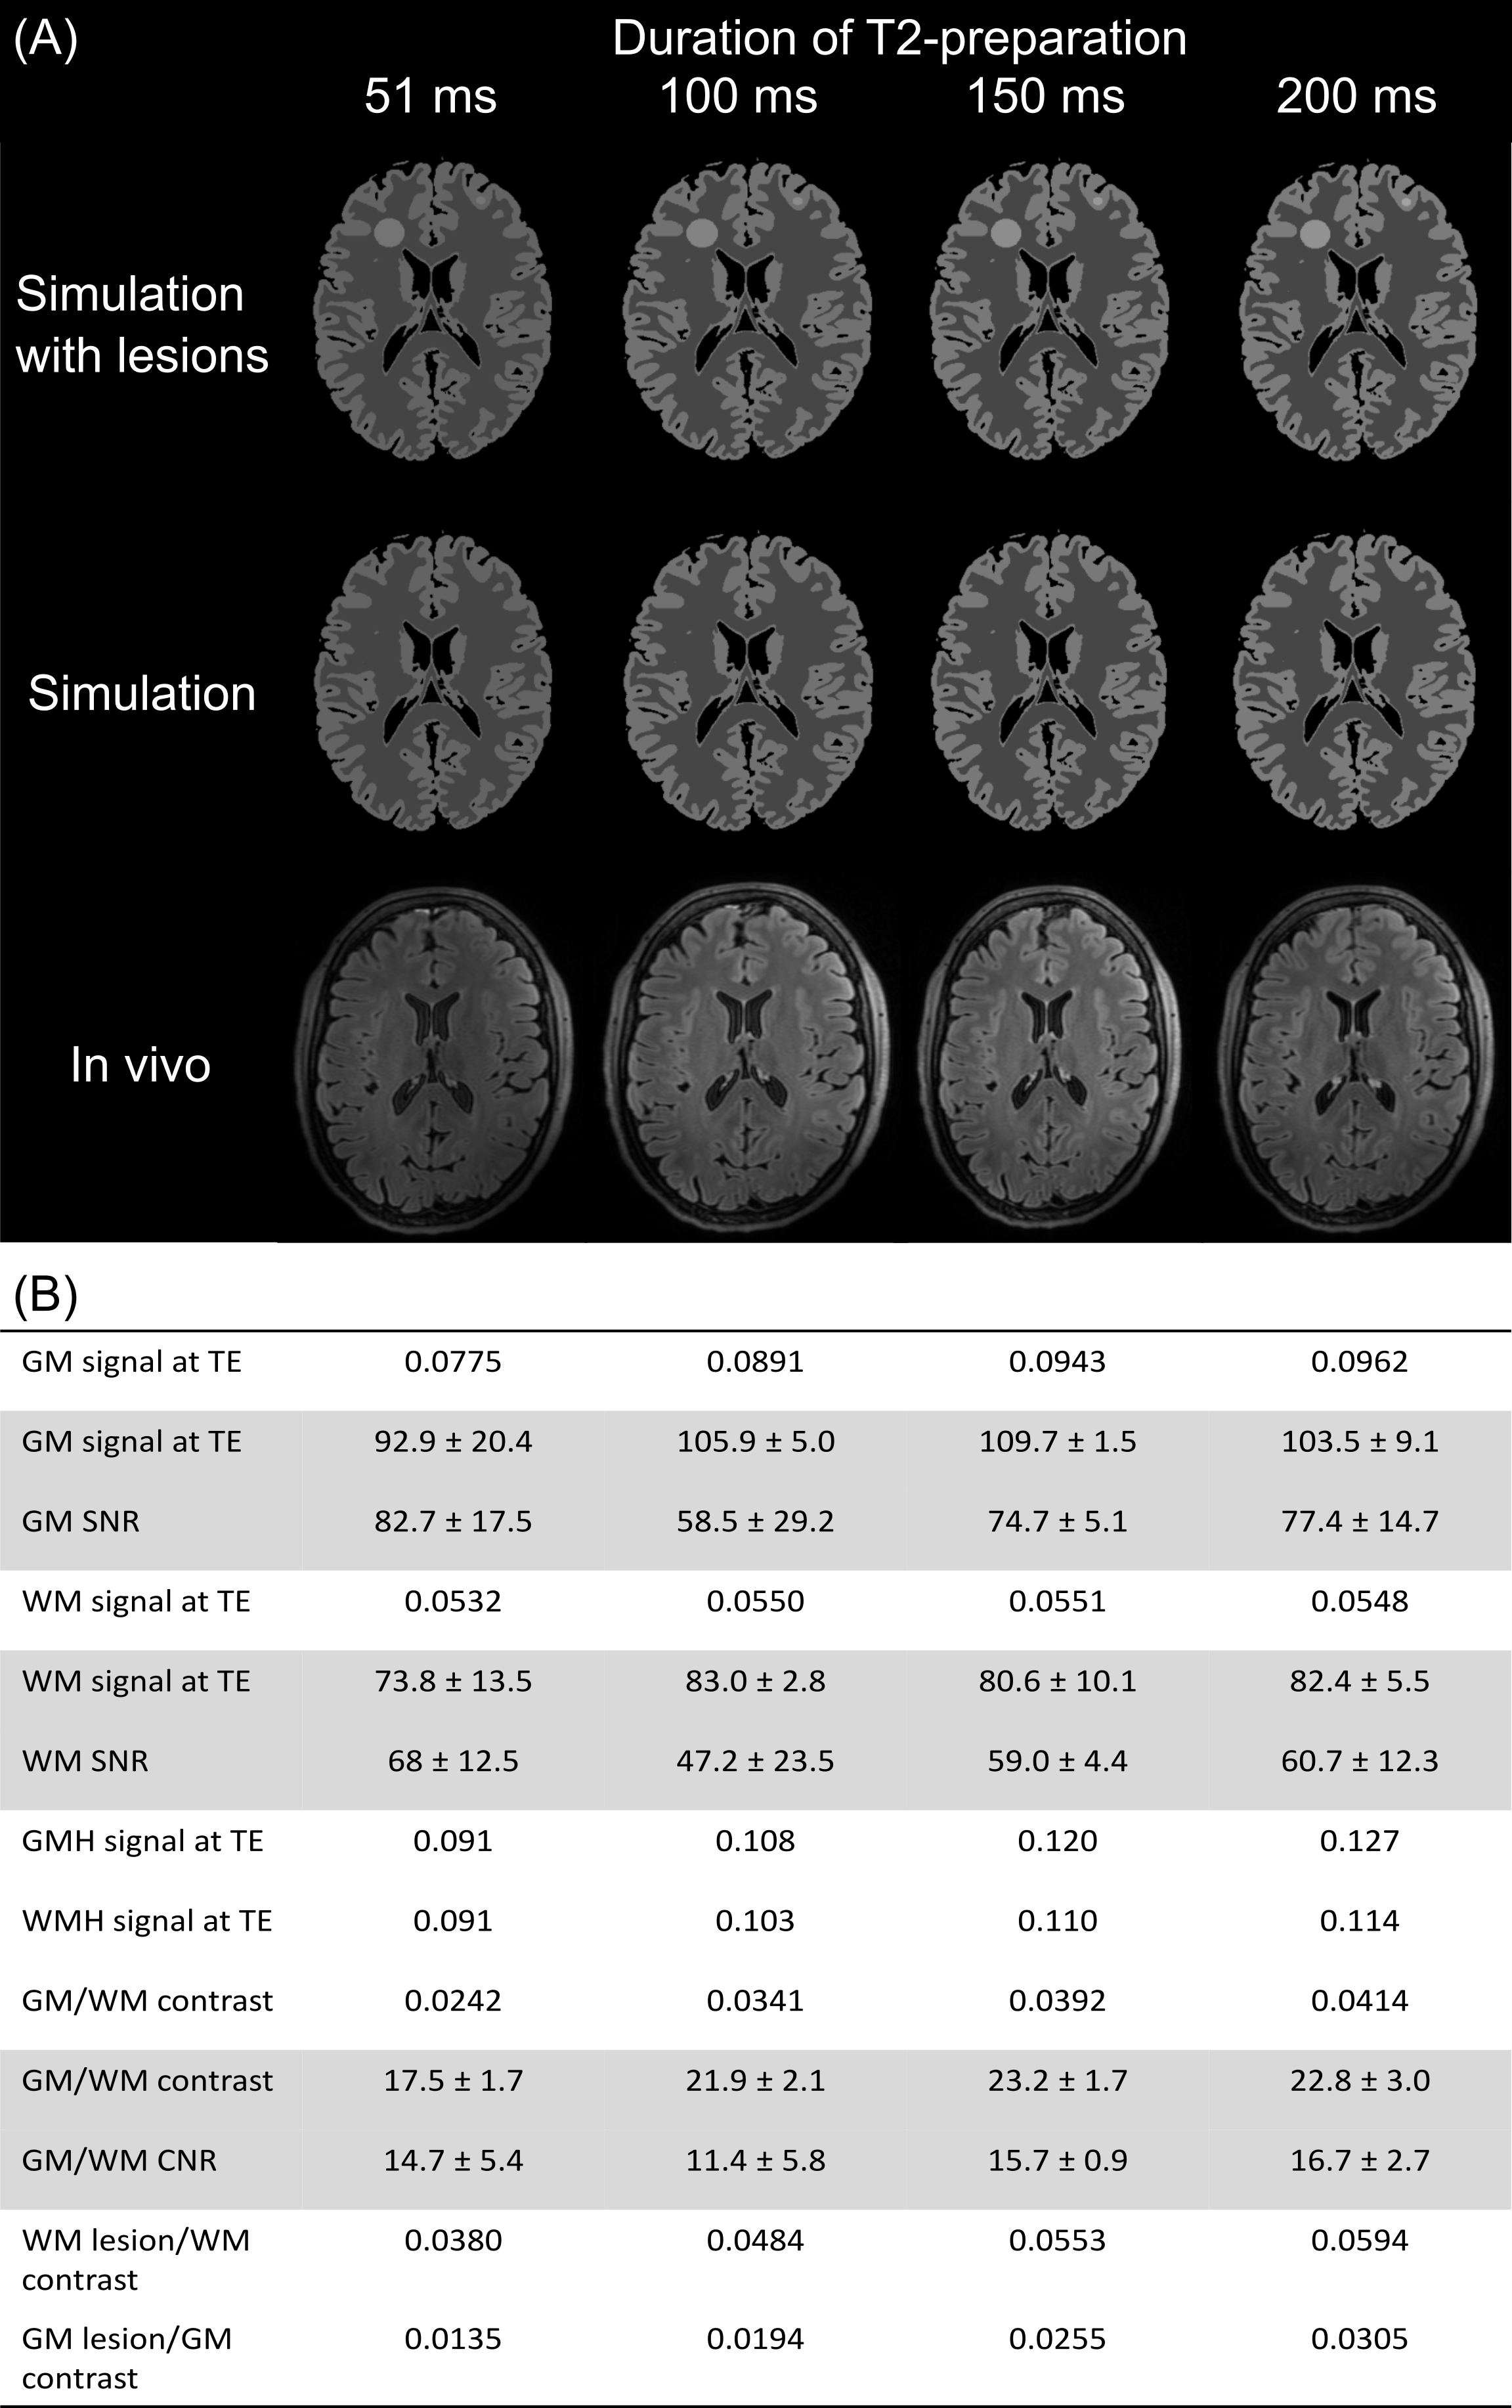
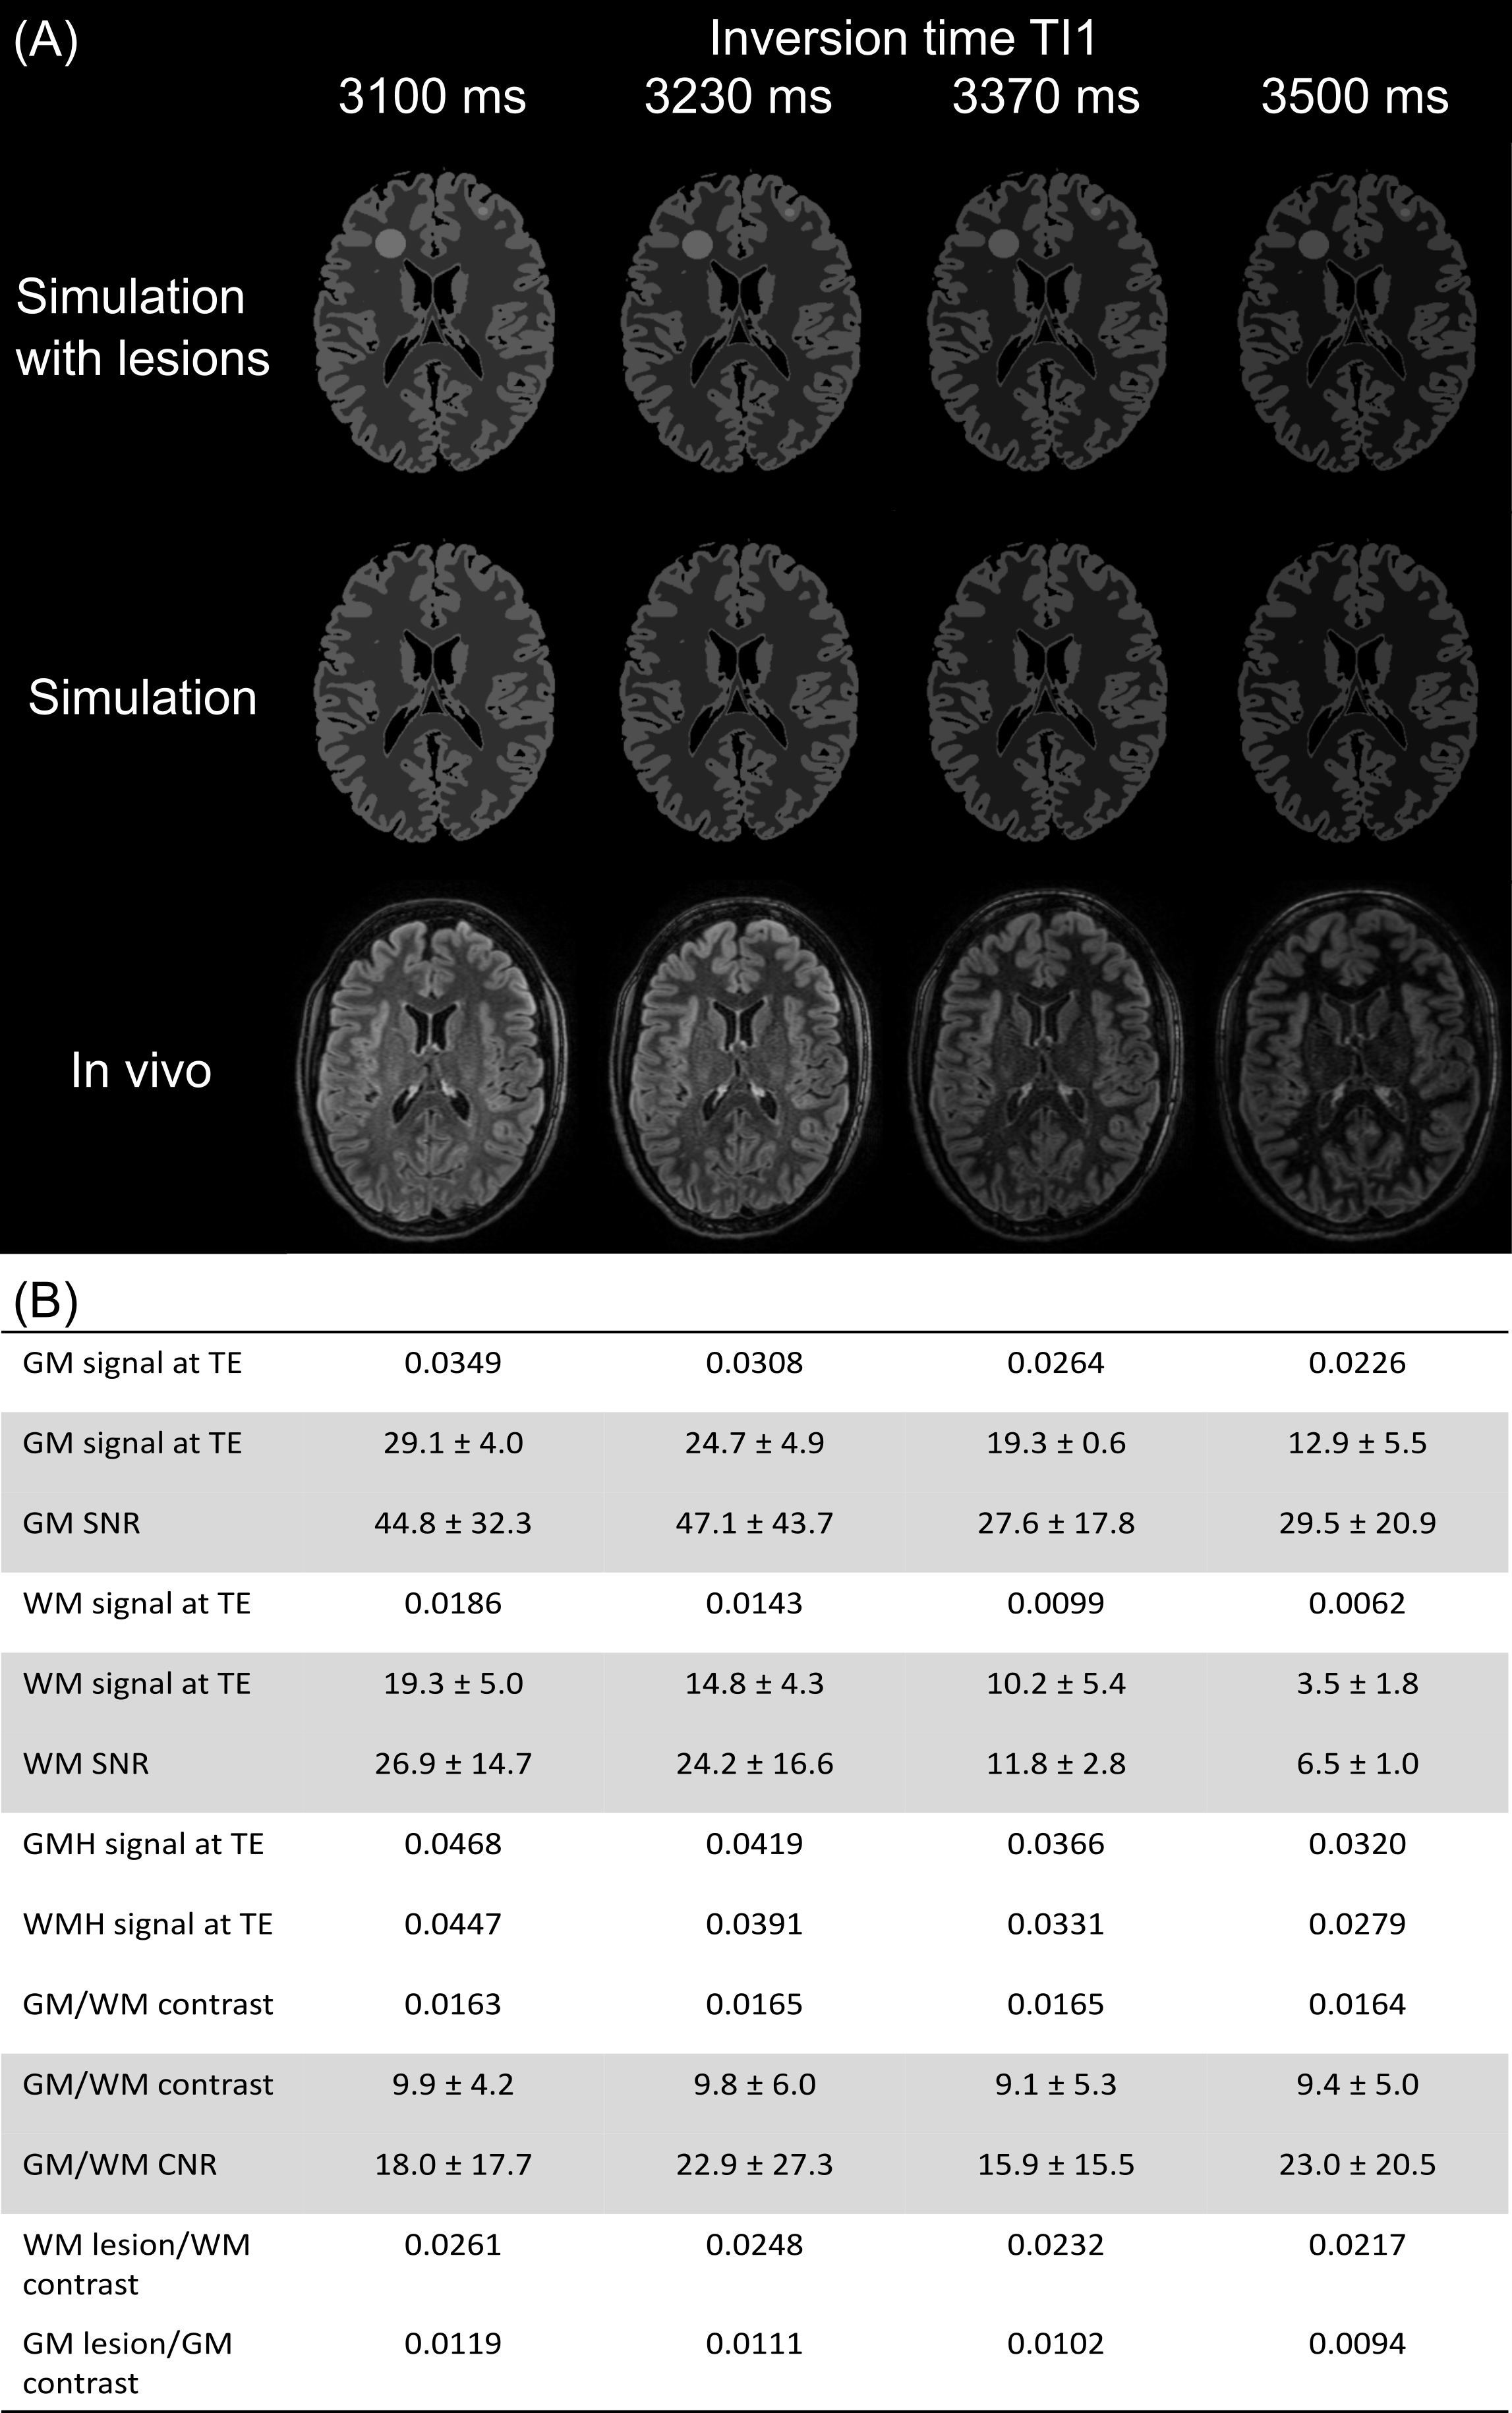
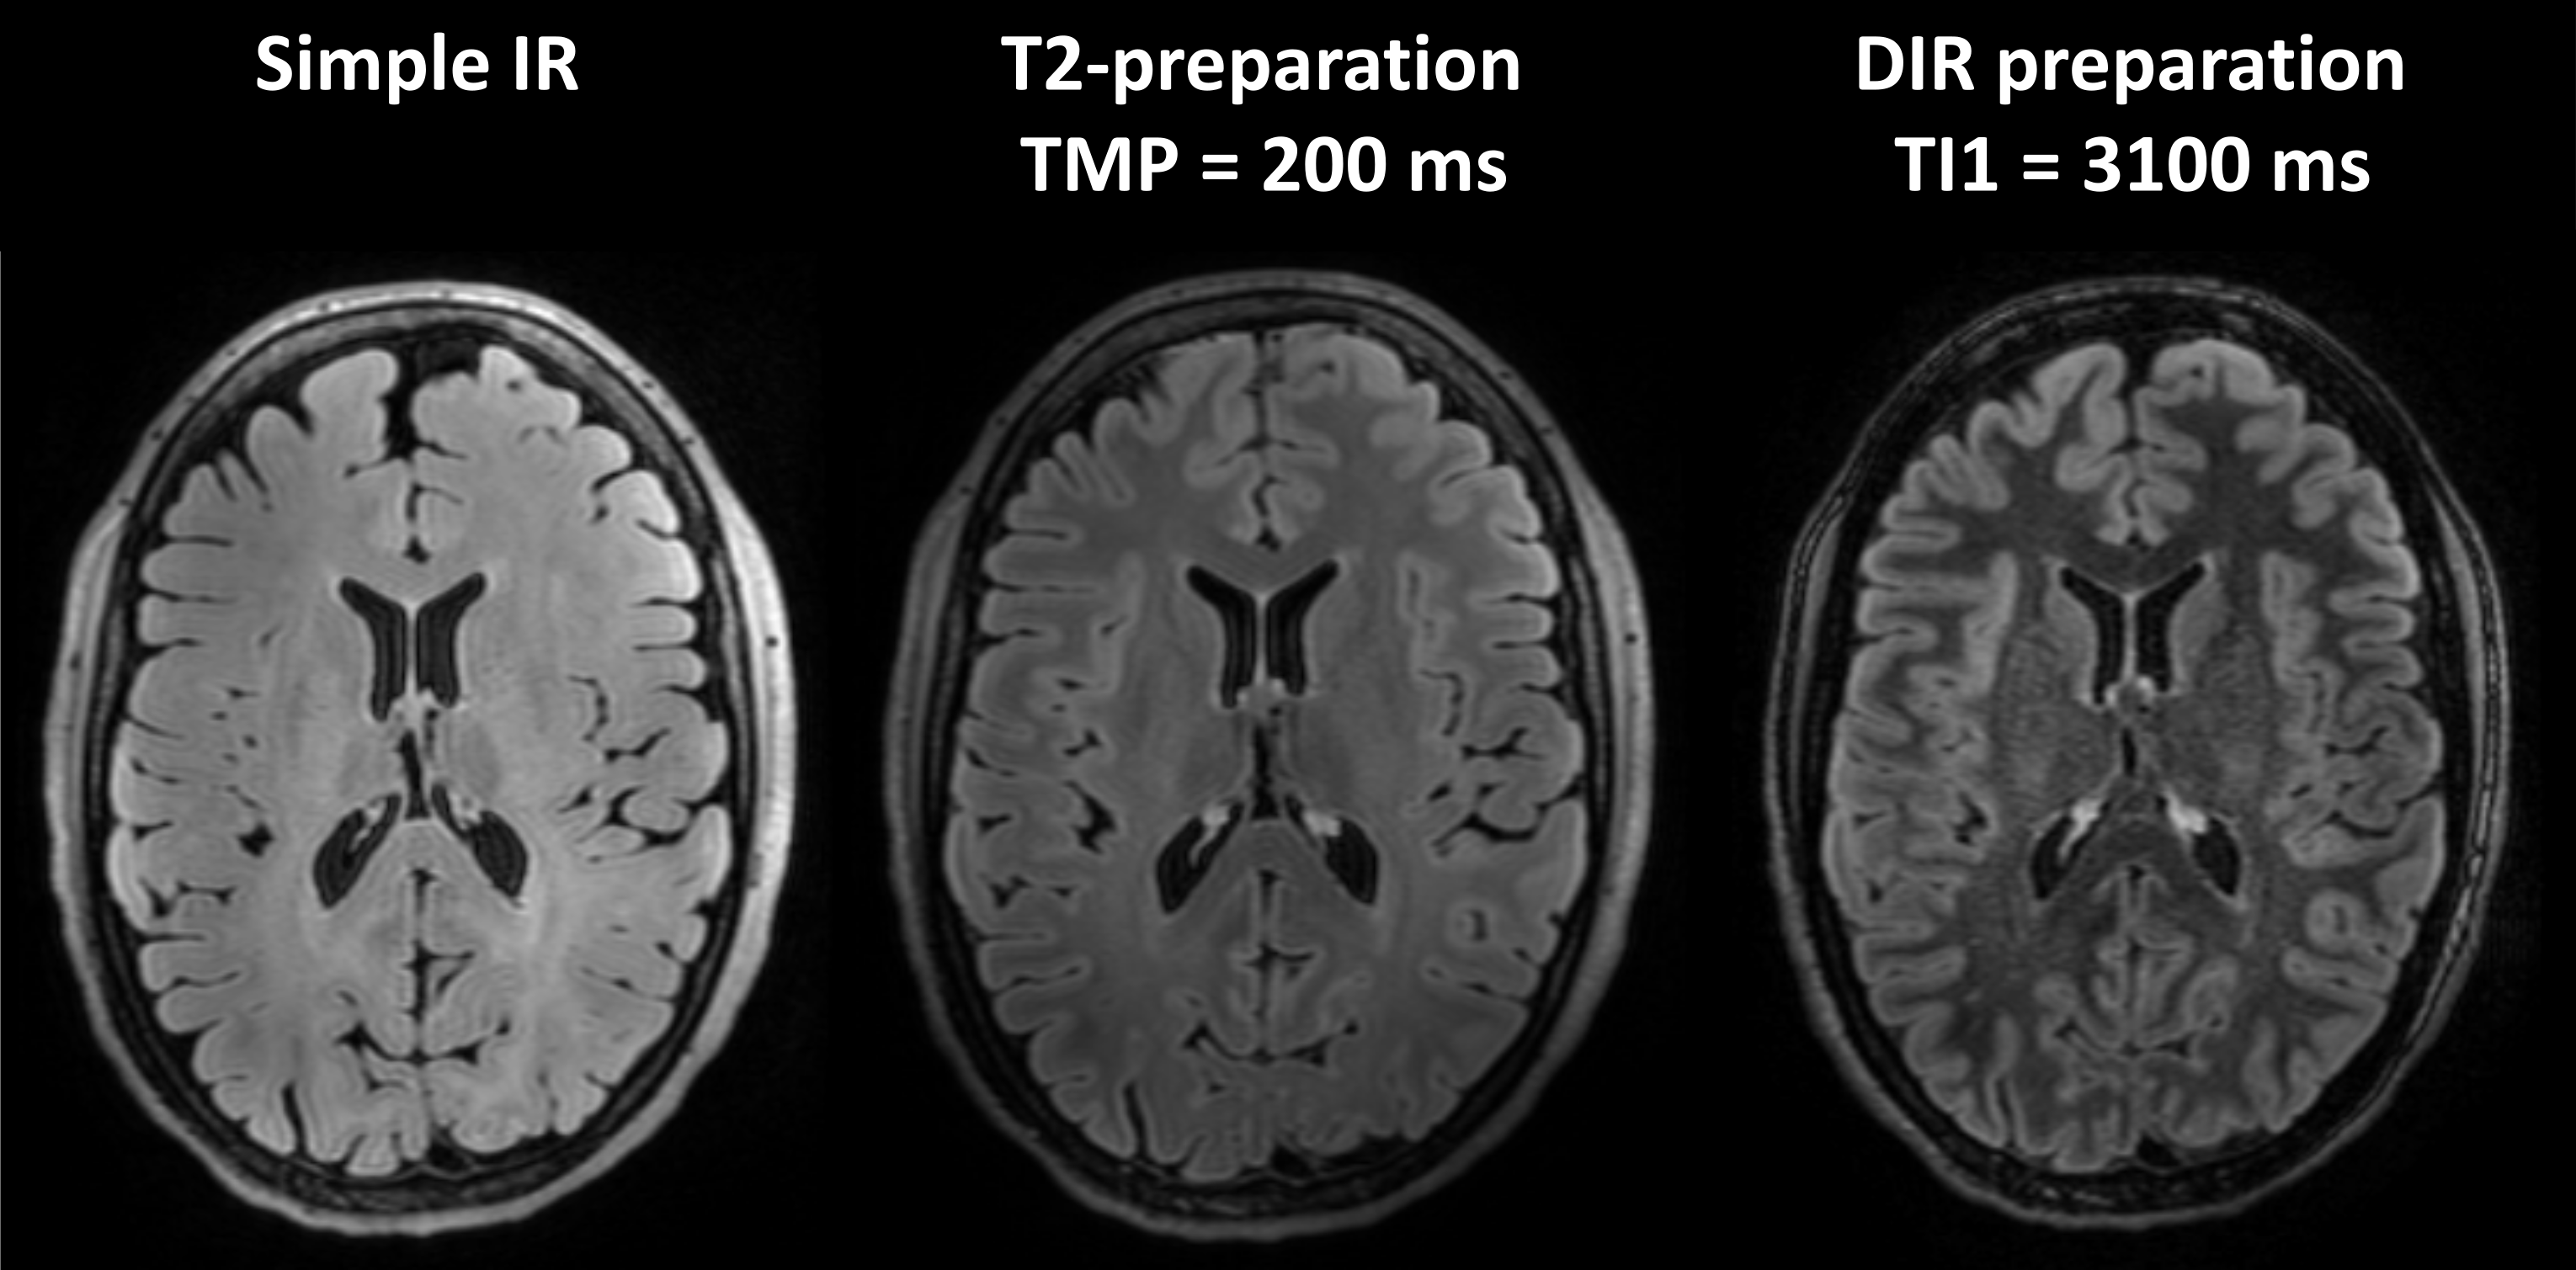
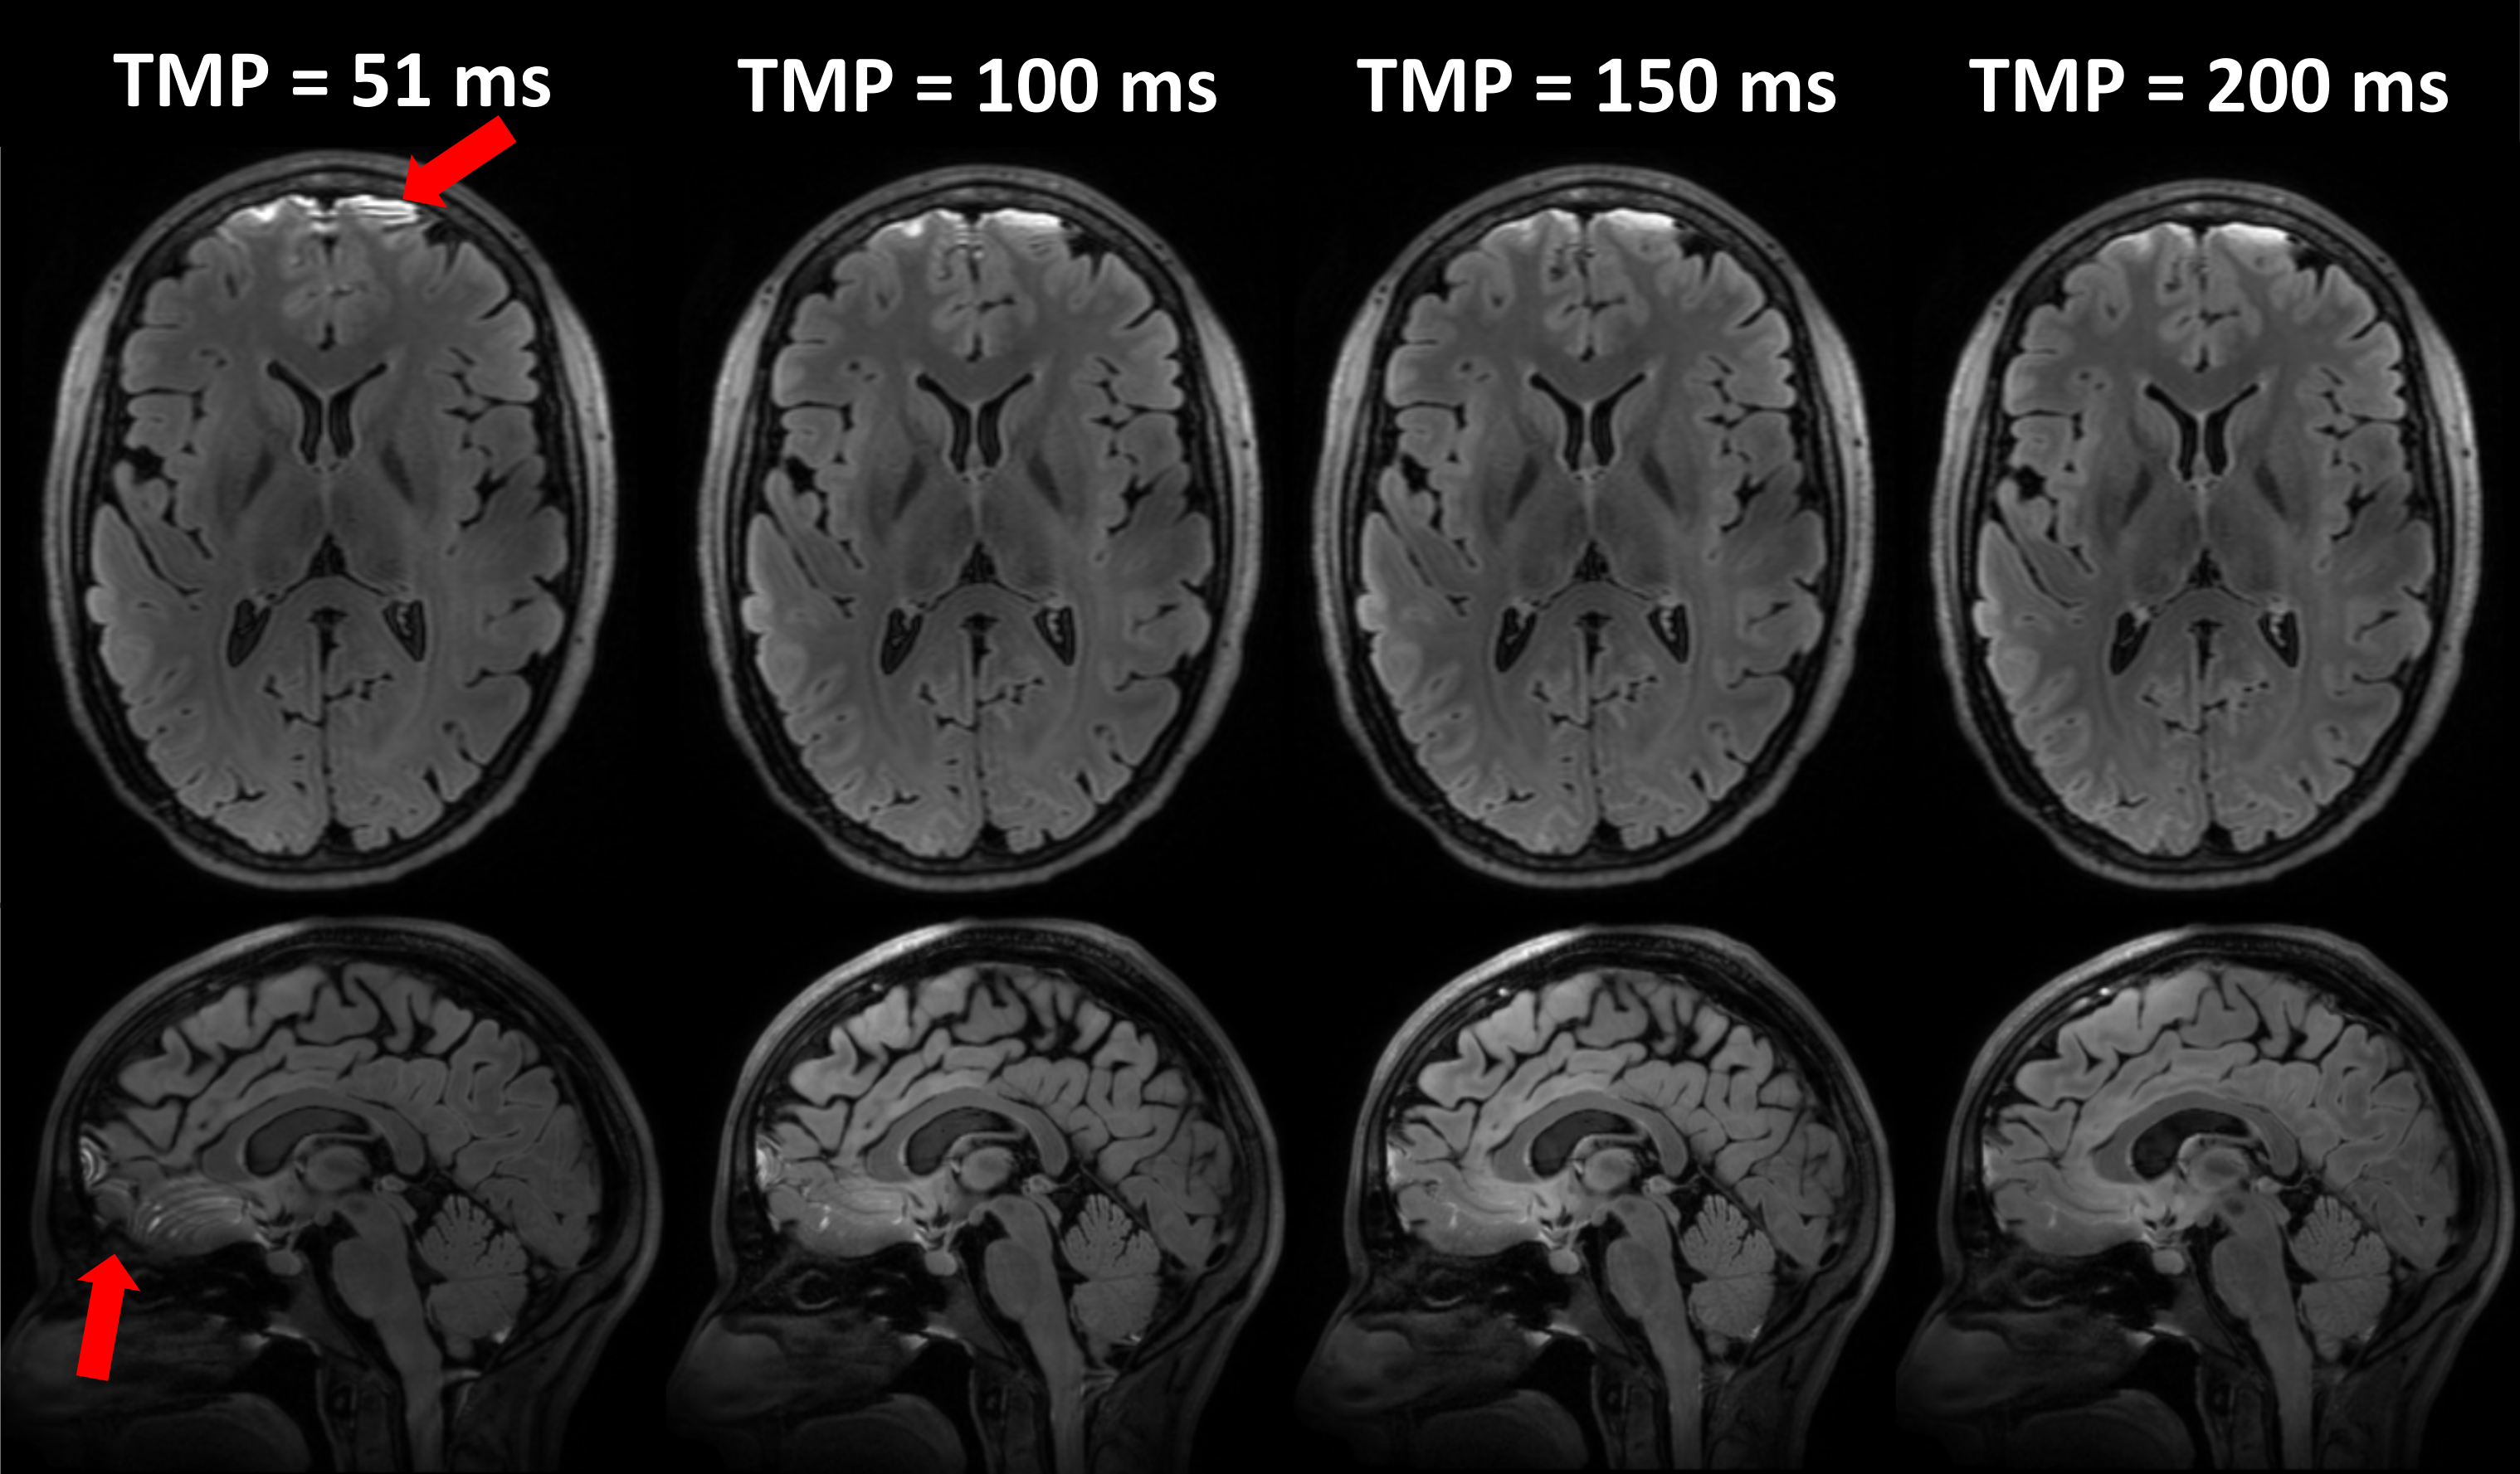
Three healthy volunteers were scanned (mean age: 33 years old, 2 female). The EPG simulations were validated as they could predict the observed contrast of all FLAIR sequences (Figures 2 and 3). Comparison between the three types of FLAIR sequences showed that: i) T2-preparation and DIR have higher GM/WM contrast than simple inversion (Figure 4); ii) longer TMP of the T2-preparation resulted in higher predicted contrast between normal-appearing and damaged tissues and higher GM/WM contrast (Figure 2); iii) shorter TI1 of the DIR increased the predicted normal-appearing/damaged tissues and the GM/WM contrast (Figure 3). The T2-preparation offered higher SNR than the DIR (Figures 2 and 3), but suffered from artefacts in the orbito-frontal area (Figure 4). Both types of preparation were prone to B1 inhomogeneities (Figures 2 and 3).Discussion
EPG simulations were used to investigate the timings of the magnetisation preparations by optimising CSF signal nulling for various preparation durations, and to predict tissue contrasts. The simulations were validated with measurements on healthy volunteers.In agreement with previous work,2 simple inversion recovery pulse is insufficient to obtain a FLAIR contrast at 7T. We investigated the T2 and DIR preparations as alternatives. The signal intensity and contrast between tissues were sensitive to the duration of the preparation: longer TMP for the T2-preparation and shorter TI1 for the DIR resulted in higher signal and GM/WM contrast. When comparing both types of preparation, we found that the T2-preparation offers a quantitatively higher SNR and a qualitatively-assessed contrast closer to the FLAIR images at 3T.10,11 However, FLAIR images with this type of preparation suffered from – presumably magnetic susceptibility – artefacts, which were not present on the FLAIR images with DIR preparation.
Future work will focus on understanding the origin of and removing the artefacts mentioned above. We will also test the sequences on patients with lesions in order to validate the contrast between normal-appearing/damaged tissues predicted by the simulations. Furthermore, the FLAIR sequences will be acquired using a parallel transmit head coil to mitigate the effect of B1 inhomogeneities.
Conclusion
At 7T, magnetisation preparation beyond a simple inversion pulse is necessary to acquire FLAIR images. To compare two types of magnetisation preparation, EPG simulations were used and validated with measurements on healthy volunteers. Although the EPG simulations were successful in optimising the duration of the preparations, there were still artefacts present in the images to be addressed in future work. The simulations could also be beneficial to optimise the variable flip angles of the FLAIR sequence and further enhance the contrast between normal-appearing and damaged tissues.Acknowledgements
We acknowledge the resources and expertise provided by the CIBM Center for Biomedical Imaging and the FCBG Human Neuroscience Platform MRI facility at the Campus Biotech Geneva.References
1. Traboulsee A, Li DKB. Conventional MR Imaging. Neuroimaging Clin N Am. 2008;18(4):651-673. doi:10.1016/j.nic.2008.07.001
2. Visser F, Zwanenburg JJM, Hoogduin JM, Luijten PR. High-resolution magnetization-prepared 3D-FLAIR imaging at 7.0 Tesla. Magn Reson Med. 2010;64(1):194-202. doi:10.1002/mrm.22397
3. Saranathan M, Tourdias T, Kerr AB, et al. Optimization of magnetization-prepared 3-dimensional fluid attenuated inversion recovery imaging for lesion detection at 7 T. Invest Radiol. 2014;49(5):290-298. doi:10.1097/RLI.0000000000000041
4. Springer E, Dymerska B, Cardoso PL, et al. Comparison of Routine Brain Imaging at 3 T and 7 T. Invest Radiol. 2016;51(8):469. doi:10.1097/RLI.0000000000000256
5. Muschelli J. Human MNI Adult Templates. Published online 2018. doi:https://doi.org/10.6084/m9.figshare.7335242.v3
6. Breuer FA, Blaimer M, Mueller MF, et al. Controlled aliasing in volumetric parallel imaging (2D CAIPIRINHA). Magn Reson Med. 2006;55(3):549-556. doi:10.1002/mrm.20787
7. Mussard E, Hilbert T, Forman C, Meuli R, Thiran JP, Kober T. Accelerated MP2RAGE imaging using Cartesian phyllotaxis readout and compressed sensing reconstruction. Magn Reson Med. 2020;84(4):1881-1894. doi:10.1002/mrm.28244
8. Jenkinson M, Smith S. A global optimisation method for robust affine registration of brain images. Med Image Anal. 2001;5(2):143-156. doi:10.1016/S1361-8415(01)00036-6
9. Jenkinson M, Bannister P, Brady M, Smith S. Improved Optimization for the Robust and Accurate Linear Registration and Motion Correction of Brain Images. NeuroImage. 2002;17(2):825-841. doi:10.1006/nimg.2002.1132
10. Kakeda S, Korogi Y, Hiai Y, Ohnari N, Sato T, Hirai T. Pitfalls of 3D FLAIR Brain Imaging: A Prospective Comparison with 2D FLAIR. Acad Radiol. 2012;19(10):1225-1232. doi:10.1016/j.acra.2012.04.017
11. Zwanenburg JJM, Hendrikse J, Visser F, Takahara T, Luijten PR. Fluid attenuated inversion recovery (FLAIR) MRI at 7.0 Tesla: comparison with 1.5 and 3.0 Tesla. Eur Radiol. 2010;20(4):915-922. doi:10.1007/s00330-009-1620-2
Figures