4580
Assessment of repeatability and reproducibility of brain oxygen extraction fraction mapping through QQ-CCTV1Cornell University, New York, NY, United States, 2Weill Medical College of Cornell University, New York, NY, United States
Synopsis
Keywords: Signal Modeling, Oxygenation
Motivation: QQ-CCTV has been validated under 3T to map brain oxygen extraction fraction. Yet its repeatability and reproducibility has not been evaluated under 1.5T.
Goal(s): Assess the repeatability and reproducibility of QQ-CCTV
Approach: QQ-CCTV was performed to calculate brain oxygen extraction from repeated scans under 3T and 1.5T. OEF values are compared between scans using linear regression and Bland-Altman plots.
Results: The OEF values obtained from 3T and 1.5T scans show minimal bias and good correlation. Although under 1.5T the sampled data have lower SNR, QQ-CCTV may benefit from lower characteristic frequency and longer characteristic time.
Impact: QQ-CCTV can be used with mGRE data acquired under 1.5T to map brain oxygen extraction with good repeatability and reproducibility and has the potential to be used clinically.
Background
MRI based oxygen extraction mapping has gained much attention recently among researchers. We assess the repeatability and reproducibility of a newly developed oxygen extraction mapping method, QQ-CCTV, under two commonly used field strengths, 3.0T and 1.5T. QQ-CCTV utilizes magnitude and phase modeling of the mGRE signal and maps oxygen extraction regionally using numerical optimization.Materials and Methods
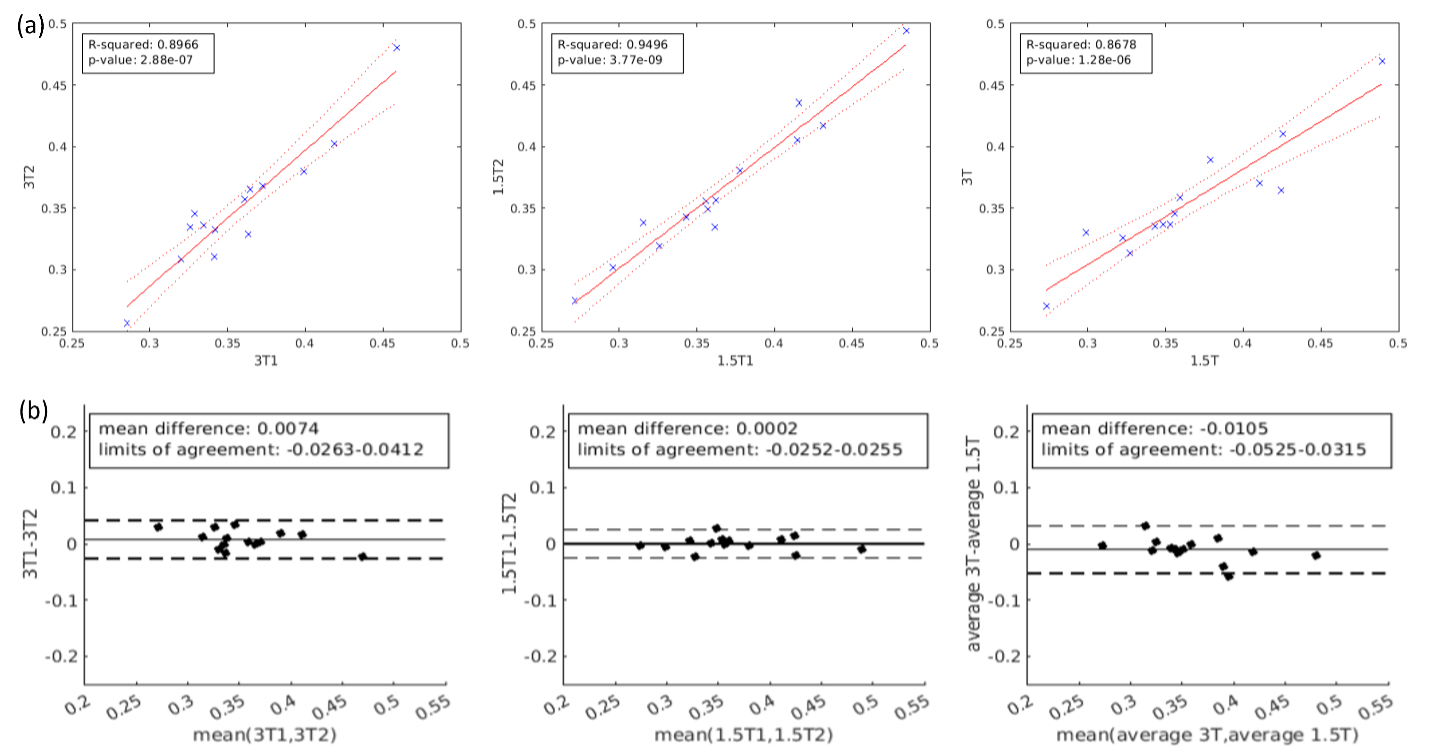
Image Acquisition: This study was approved by the local Institutional Review Board. Healthy subjects (N=14) were recruited in this study and written consent was obtained from subjects prior to imaging. Imaging was completed on one 1.5T GE Signa HDxt scanner and one 3.0T GE Discovery MR750 scanner (GE Healthcare, Waukesha) that are 0.6 mile away from each other. The multi-echo gradient echo (mGRE) sequence was used for image acquisition on both scanners with TE1/∆TE = 4.1/4.4 ms, number of echoes = 11, FOV = 24cm × 24cm, matrix size = 384 × 384, slice thickness = 2mm, number of averages = 0.75, flip angle = 20º. Scans were repeated on each scanner to assess reproducibility. The participants were instructed to abstain from caffeine consumption for 12 hours prior to the study and remain at rest until their respiratory patterns had stabilized before entering the scanner to avoid blood flow and OEF fluctuation. OEF map processing: OEF maps were reconstructed according to the method outlined in (1). QSM maps were reconstructed from the mGRE signal using projection onto dipole field (PDF) (2) to remove background field, global cerebrospinal fluid as a zero-reference regularization (3) and morphology-enabled dipole inversion (MEDI) to calculate susceptibility from local field variation (4). Signal magnitude was corrected of magnetic field inhomogeneity using the voxel spread function method (5) and combined with QSM to jointly estimate venous blood oxygenation (Y), transverse relaxation rate (R2), deoxygenated blood volume fraction (v), initial signal intensity (S0) and neural tissue susceptibility ($$$\chi_n$$$). Temporal clustering, tissue composition and total variation regularization were used to suppress noise and to constrain the optimization problem.Statistical Analysis: OEF maps of the same subject were linearly coregistered using the echo-combined magnitude images and FSL FLIRT program for comparison (6). Deep gray matter ROIs were manually segmented on 3.0T QSM images in ITK-SNAP (7). Left and right globus pallidus, putamen, caudate, red nucleus, and substantia nigra are selected as ROIs as their oxygen utilization may reflect brain function changes. Mean OEF values in each ROI and the whole brain excluding CSF regions were calculated for statistical analysis. The two repeated OEF maps at 3T and 1.5T are referred to as 3T1/3T2 and 1.5T1/1.5T2 respectively. Bland-Altman plots and limits of agreement are reported to qualitatively assess the agreement between measurements. Linear regression was performed, and the R-squared value (and p-value were reported to quantify the goodness of fit. A threshold of p<0.05 indicates statistical significance.Results
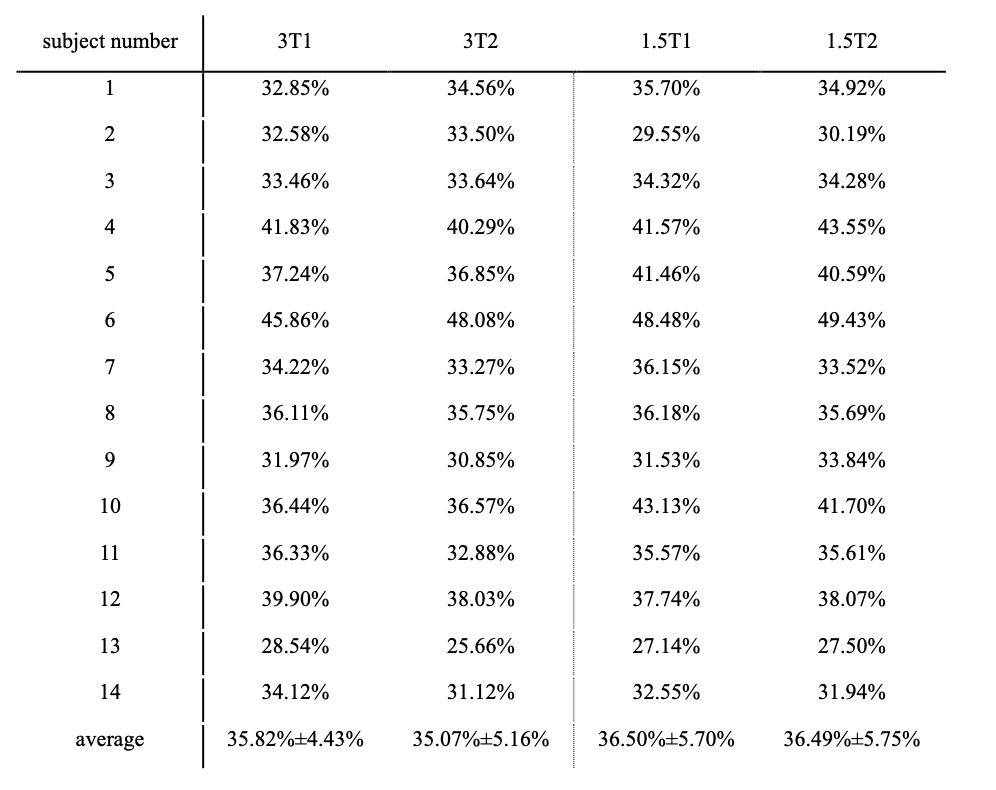
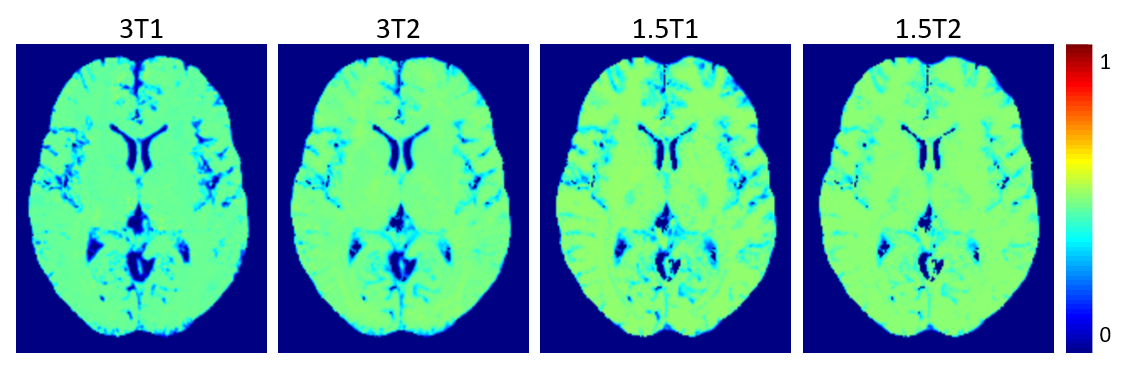
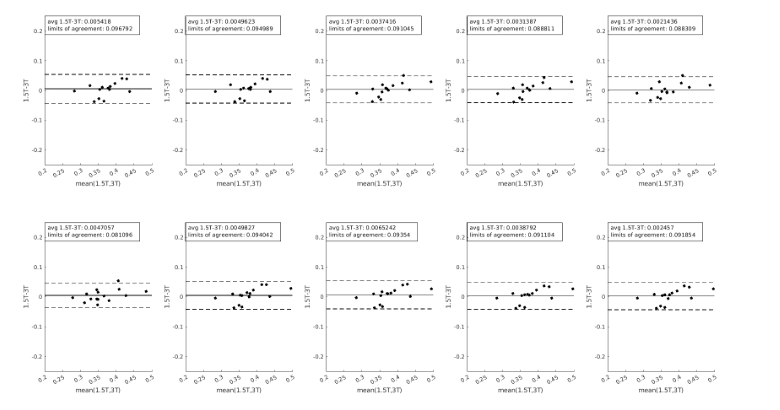
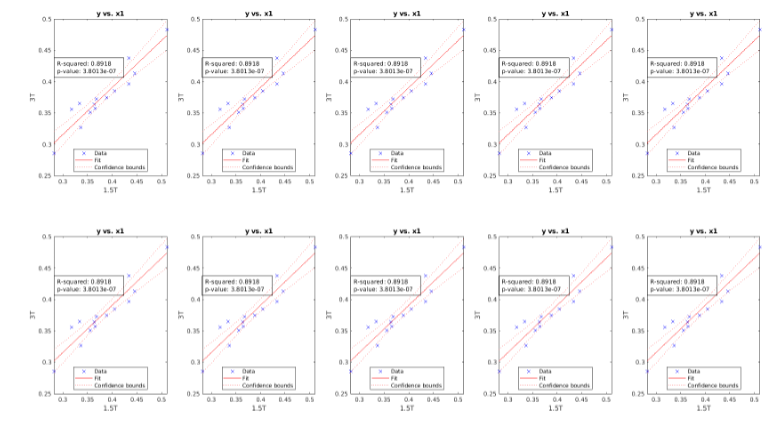
The whole brain averaged OEF values for all subjects are reported in Table. 1 and the OEF maps for one exemplary subject are shown in Fig. 2. Linear regression models were used to assess the relationship between measurements and plots are shown in Fig. 3(a). Bland-Altman plots comparing whole-brain averaged 3T1/3T2, 1.5T1/1.5T2 and averaged 3T/1.5T scans are shown in Fig. 3(b). Bland-Altman plots comparing averaged 3T and 1.5T OEF values in 10 ROIs are shown in Fig. 4. Regression plots of averaged 3T and 1.5T OEF values in 10 ROIs are shown in Fig. 5.Conclusion
The visual appearance of all OEF maps reconstructed are similar to OEF maps of healthy subjects reported in (8, 9), with little contrast between gray and white matter and between brain hemispheres. The whole brain averaged and ROI averaged OEF values obtained from 3T and 1.5T scans show minimal bias compared with reported in reproducibility studies of other methods (10-14). The repeatability of OEF reconstruction under 3T is in accordance with (8) and repeated scans under 1.5T shows less OEF difference and better correlation. As the QQ model relies on the different asymptotic behavior of quadratic decay and linear decay before and after the characteristic time and is linearly proportional to the field strength. Although under 1.5T the sampled data have lower SNR, more time points may have been sampled using the same echo time before the characteristic time and increased the robustness of separation of blood and non-blood signal decay. We conclude that QQ-CCTV can be used with mGRE data acquired under 1.5T to map brain oxygen extraction with good repeatability and reproducibility and has the potential to be used clinically.Acknowledgements
No acknowledgement found.References
1. Cho J, Spincemaille P, Nguyen TD, Gupta A, Wang Y. Temporal clustering, tissue composition, and total variation for mapping oxygen extraction fraction using QSM and quantitative BOLD. Magnetic Resonance in Medicine. 2021.
2. Liu T, Khalidov I, de Rochefort L, Spincemaille P, Liu J, Tsiouris AJ, et al. A novel background field removal method for MRI using projection onto dipole fields (PDF). NMR Biomed. 2011;24(9):1129-36.
3. Dimov AV, Nguyen TD, Spincemaille P, Sweeney EM, Zinger N, Kovanlikaya I, et al. Global cerebrospinal fluid as a zero-reference regularization for brain quantitative susceptibility mapping. J Neuroimaging. 2022;32(1):141-7.
4. Liu J, Liu T, de Rochefort L, Ledoux J, Khalidov I, Chen W, et al. Morphology enabled dipole inversion for quantitative susceptibility mapping using structural consistency between the magnitude image and the susceptibility map. Neuroimage. 2012;59(3):2560-8.
5. Yablonskiy DA, Sukstanskii AL, Luo J, Wang X. Voxel spread function method for correction of magnetic field inhomogeneity effects in quantitative gradient-echo-based MRI. Magn Reson Med. 2013;70(5):1283-92.
6. Jenkinson M, Bannister P, Brady M, Smith S. Improved optimization for the robust and accurate linear registration and motion correction of brain images. Neuroimage. 2002;17(2):825-41.
7. Yushkevich PA, Piven J, Hazlett HC, Smith RG, Ho S, Gee JC, et al. User-guided 3D active contour segmentation of anatomical structures: Significantly improved efficiency and reliability. Neuroimage. 2006;31(3):1116-28.
8. Cho J, Lee J, An H, Goyal MS, Su Y, Wang Y. Cerebral oxygen extraction fraction (OEF): Comparison of challenge-free gradient echo QSM+qBOLD (QQ) with (15)O PET in healthy adults. J Cereb Blood Flow Metab. 2021;41(7):1658-68.
9. Fan AP, An H, Moradi F, Rosenberg J, Ishii Y, Nariai T, et al. Quantification of brain oxygen extraction and metabolism with [(15)O]-gas PET: A technical review in the era of PET/MRI. Neuroimage. 2020;220:117136.
10. Liu P, Xu F, Lu H. Test-retest reproducibility of a rapid method to measure brain oxygen metabolism. Magn Reson Med. 2013;69(3):675-81.
11. Fernandez-Seara MA, Techawiboonwong A, Detre JA, Wehrli FW. MR susceptometry for measuring global brain oxygen extraction. Magn Reson Med. 2006;55(5):967-73.
12. Leontiev O, Buxton RB. Reproducibility of BOLD, perfusion, and CMRO2 measurements with calibrated-BOLD fMRI. Neuroimage. 2007;35(1):175-84.
13. Merola A, Germuska MA, Murphy K, Wise RG. Assessing the repeatability of absolute CMRO(2), OEF and haemodynamic measurements from calibrated fMRI. Neuroimage. 2018;173:113-26.
14. Wirestam R, Lundberg A, Chakwizira A, van Westen D, Knutsson L, Lind E. Test-retest analysis of cerebral oxygen extraction estimates in healthy volunteers: comparison of methods based on quantitative susceptibility mapping and dynamic susceptibility contrast magnetic resonance imaging. Heliyon. 2022;8(12):e12364
Figures