4579
Investigating Data Acquisition Strategies for High Efficiency Clinical MRI and a More Sustainable Future in Radiology1Radiology & Biomedical Imaging, University of California, San Francisco, San Francisco, CA, United States, 2Siemens Healthineers, Malvern, PA, United States, 3Siemens Healthineers, San Francisco, CA, United States, 4Siemens Smart Infrastructure, Fremont, CA, United States
Synopsis
Keywords: Data Acquisition, Parallel Transmit & Multiband, Sustainability, Energy
Motivation: Recognizing Radiology’s role in the medical healthcare environmental impact, we investigate strategies to reduce MRI scanning energy consumption and carbon footprint of Radiology.
Goal(s): To demonstrate the achievable savings in time and energy during clinical MRI scans.
Approach: Power meters were connected to three clinical MRI scanners from different field strengths to collect power data while phantom scans were acquired with typical clinical sequences and a range of common acceleration methods.
Results: The application of acceleration techniques resulted in decreased scan duration, energy consumption, and carbon footprint. Deep Learning (DL) acceleration emerged as the technique with the most savings.
Impact: This research paves the way for adoption of high-efficiency MRI techniques, which promise to substantially lower the carbon footprint and scan duration associated with MRI exams.
METHODS: Three clinical MRI scanners at an outpatient imaging facility were equipped with power meters (Siemens SEM3 Meter), which continuously collect power data (0.1 Hz sampling rate) that was then extracted using the Siemens Desigo software platform. Phantom scans were collected using a Siemens QA phantom in order to investigate the differences in time, energy, and power of specific sequences with variable protocol accelerations methods and variable field strengths. The three systems included in this study were the Magnetom Siemens Vida 3T, Magnetom Siemens Sola 1.5T, and the Magnetom Siemens Free.Max 0.55T, all operating on software version XA50. Sequences were selected from typical clinical imaging protocols including Diffusion Weighted Imaging (DWI), T1 Volumetric Interpolated Breath-hold Examination (VIBE), T2 Turbo Spin Echo (TSE), proton density (PD) weighted TSE, T1 Magnetization-Prepared Rapid Acquisition Gradient Echo (MPRAGE), and T2 Fluid Attenuated Inversion Recovery (FLAIR). The routine clinical sequences were compared to accelerated versions of the same sequences on all three MRI systems (3T, 1.5T, 0.55T). Several acceleration methods were implemented including generalized auto calibrating partial parallel acquisition (GRAPPA) with acceleration factors of two and three, simultaneous multisection (SMS)12–14 acquisition with an acceleration factor of two, and deep learning (DL) accelerated acquisitions in both 2D and 3D.
RESULTS: A summary of total active scanning time (mins), total energy (kWh), and mean power (kW) for sequences DWI, T1 VIBE, T2 TSE, and PD TSE are reported in Figure 1 and Figure 3 and the total energy (kWh) is plotted in Figure 2. On 3T MRI, GRAPPAX2 resulted in 20-48% decreased scan time and 17-48% decreased energy consumption; GRAPPAX3 resulted in 37-64% decreased scan time and 40-65% decreased energy consumption; GRAPPAX2SMSX2 resulted in 49-71% decreased scan time and 57-69% decreased energy consumption; and DL 2D resulted in 76-83% decreased scan time and 77-81% decreased energy consumption. On 1.5T MRI, GRAPPAX2 resulted in a 17-49% decreased scan time and 21-50% decreased energy consumption; GRAPPAX3 resulted in 30-56% decreased scan time and 34-58% decreased energy consumption; GRAPPAX2SMSX2 resulted in 33-70% decreased scan time and 55-70% decreased energy consumption; and DL 2D resulted in 70-82% decreased scan time and 75-83% decreased energy consumption. On 0.55T MRI, GRAPPAX2 resulted in 14-22% decreased scan time and 20-23% decreased energy consumption, while DL 2D resulted in 44-62% decreased scan time and 43-60% decreased energy consumption. The mean power (kW) was unaffected by the accelerated acquisitions, with the exception of DWI with GRAPPAX2SMSX2 and DL 2D, which resulted in 18-31% decreased power on 3T and 33-42% decreased power on 1.5T.
A summary of total active scanning time (mins), total energy (kWh), and mean power (kW) for sequences T1 MPRAGE and T2 FLAIR without acceleration and with DL 3D acceleration are reported in Figure 4 (3T, 1.5T, 0.55T) and the total energy (kWh) is plotted in Figure 5. On 3T MRI for T1 MPRAGE, DL 3D resulted in 51% decreased scan time and 57% decreased energy consumption, while for T2 FLAIR, DL 3D resulted in 25% decreased scan time and 24% decreased energy consumption. On 1.5T MRI for T1 MPRAGE, the DL 3D resulted in 48% decreased scan time and 50% decreased energy consumption, while for T2 FLAIR, DL 3D resulted in 42% decreased scan time and 40% decreased energy consumption. On 0.55T MRI for T2 FLAIR, the DL 3D resulted in 43% decreased scan time and 42% decreased energy consumption, and DL 3D was not available for T1 MPRAGE on the 0.55T MRI system.
DISCUSSION: The most notable trend was the correlation between scan time and energy consumption. GRAPPA and SMS methods resulted in moderate reductions in scan time and energy consumption, but DL acceleration resulted in the most significant results. The DWI, T1 VIBE, T2 TSE, PD TSE sequences benefited more from DL 2D acceleration on 3T MRI and 1.5T MRI than on the 0.55T MRI. The T1 MPRAGE sequence benefited more from DL 3D acceleration than T2 FLAIR, and the T2 FLAIR sequence benefited more from DL 3D acceleration in 1.5T MRI and 0.55T MRI than in 3T MRI.
CONCLUSION: Clinical MRI can benefit from reduced scan times and energy consumption by adopting accelerated scanning methods.
Acknowledgements
No acknowledgement found.References
1. Mariampillai, J. et al. The green and sustainable radiology department. Die Radiologie (2023) doi:10.1007/s00117-023-01189-6.
2. Truhn, D., Müller-Franzes, G. & Kather, J. N. The ecological footprint of medical AI. European Radiology Preprint at https://doi.org/10.1007/s00330-023-10123-2 (2023).
3. Chua, A. L. B., Amin, R., Zhang, J., Thiel, C. L. & Gross, J. S. The Environmental Impact of Interventional Radiology: An Evaluation of Greenhouse Gas Emissions from an Academic Interventional Radiology Practice. Journal of Vascular and Interventional Radiology 32, 907-915.e3 (2021).
4. Chaban, Y. V. et al. Environmental Sustainability and MRI: Challenges, Opportunities, and a Call for Action. Journal of Magnetic Resonance Imaging Preprint at https://doi.org/10.1002/jmri.28994 (2023).
5. Brown, M., Schoen, J. H., Gross, J., Omary, R. A. & Hanneman, K. Climate Change and Radiology: Impetus for Change and a Toolkit for Action. Radiology (2023) doi:10.1148/radiol.230229.
6. Woolen, S. A. et al. Radiology Environmental Impact: What Is Known and How Can We Improve? Acad Radiol (2022) doi:10.1016/J.ACRA.2022.10.021.
7. Karliner, J., Slotterback, S., Boyd, R., Ashby, B. & Steele, K. HEALTH CARE’S CLIMATE FOOTPRINT HOW THE HEALTH SECTOR CONTRIBUTES TO THE GLOBAL CLIMATE CRISIS AND OPPORTUNITIES FOR ACTION Health Care Without Harm Climate-smart health care series Green Paper Number One Produced in collaboration with Arup. (2019).
8. Sherman, J. D., MacNeill, A. & Thiel, C. Reducing pollution from the health care industry. JAMA - Journal of the American Medical Association vol. 322 1043–1044 Preprint at https://doi.org/10.1001/jama.2019.10823 (2019).
9. Woolen, S. A. et al. Ecodesign and Operational Strategies to Reduce the Carbon Footprint of MRI for Energy Cost Savings. Radiology 307, (2023).
10. Heye, T., Meyer, M. T., Merkle, E. M. & Vosshenrich, J. Turn It Off! A Simple Method to Save Energy and CO 2 Emissions in a Hospital Setting with Focus on Radiology by Monitoring Nonproductive Energy-consuming Devices. Radiology (2023) doi:10.1148/radiol.230162.
11. Sumner, C. et al. Approaches to Greening Radiology. Academic Radiology vol. 30 528–535 Preprint at https://doi.org/10.1016/j.acra.2022.08.013 (2023).
12. Barth, M., Breuer, F., Koopmans, P. J., Norris, D. G. & Poser, B. A. Simultaneous multislice (SMS) imaging techniques. Magnetic Resonance in Medicine vol. 75 63–81 Preprint at https://doi.org/10.1002/mrm.25897 (2016).
13. Benali, S. et al. Simultaneous multi-slice accelerated turbo spin echo of the knee in pediatric patients. Skeletal Radiol 47, 821–831 (2018).
14. Fritz, J. et al. Simultaneous Multislice Accelerated Turbo Spin Echo Magnetic Resonance Imaging: Comparison and Combination With In-Plane Parallel Imaging Acceleration for High-Resolution Magnetic Resonance Imaging of the Knee. Invest Radiol 52, 529–537 (2017).
Figures
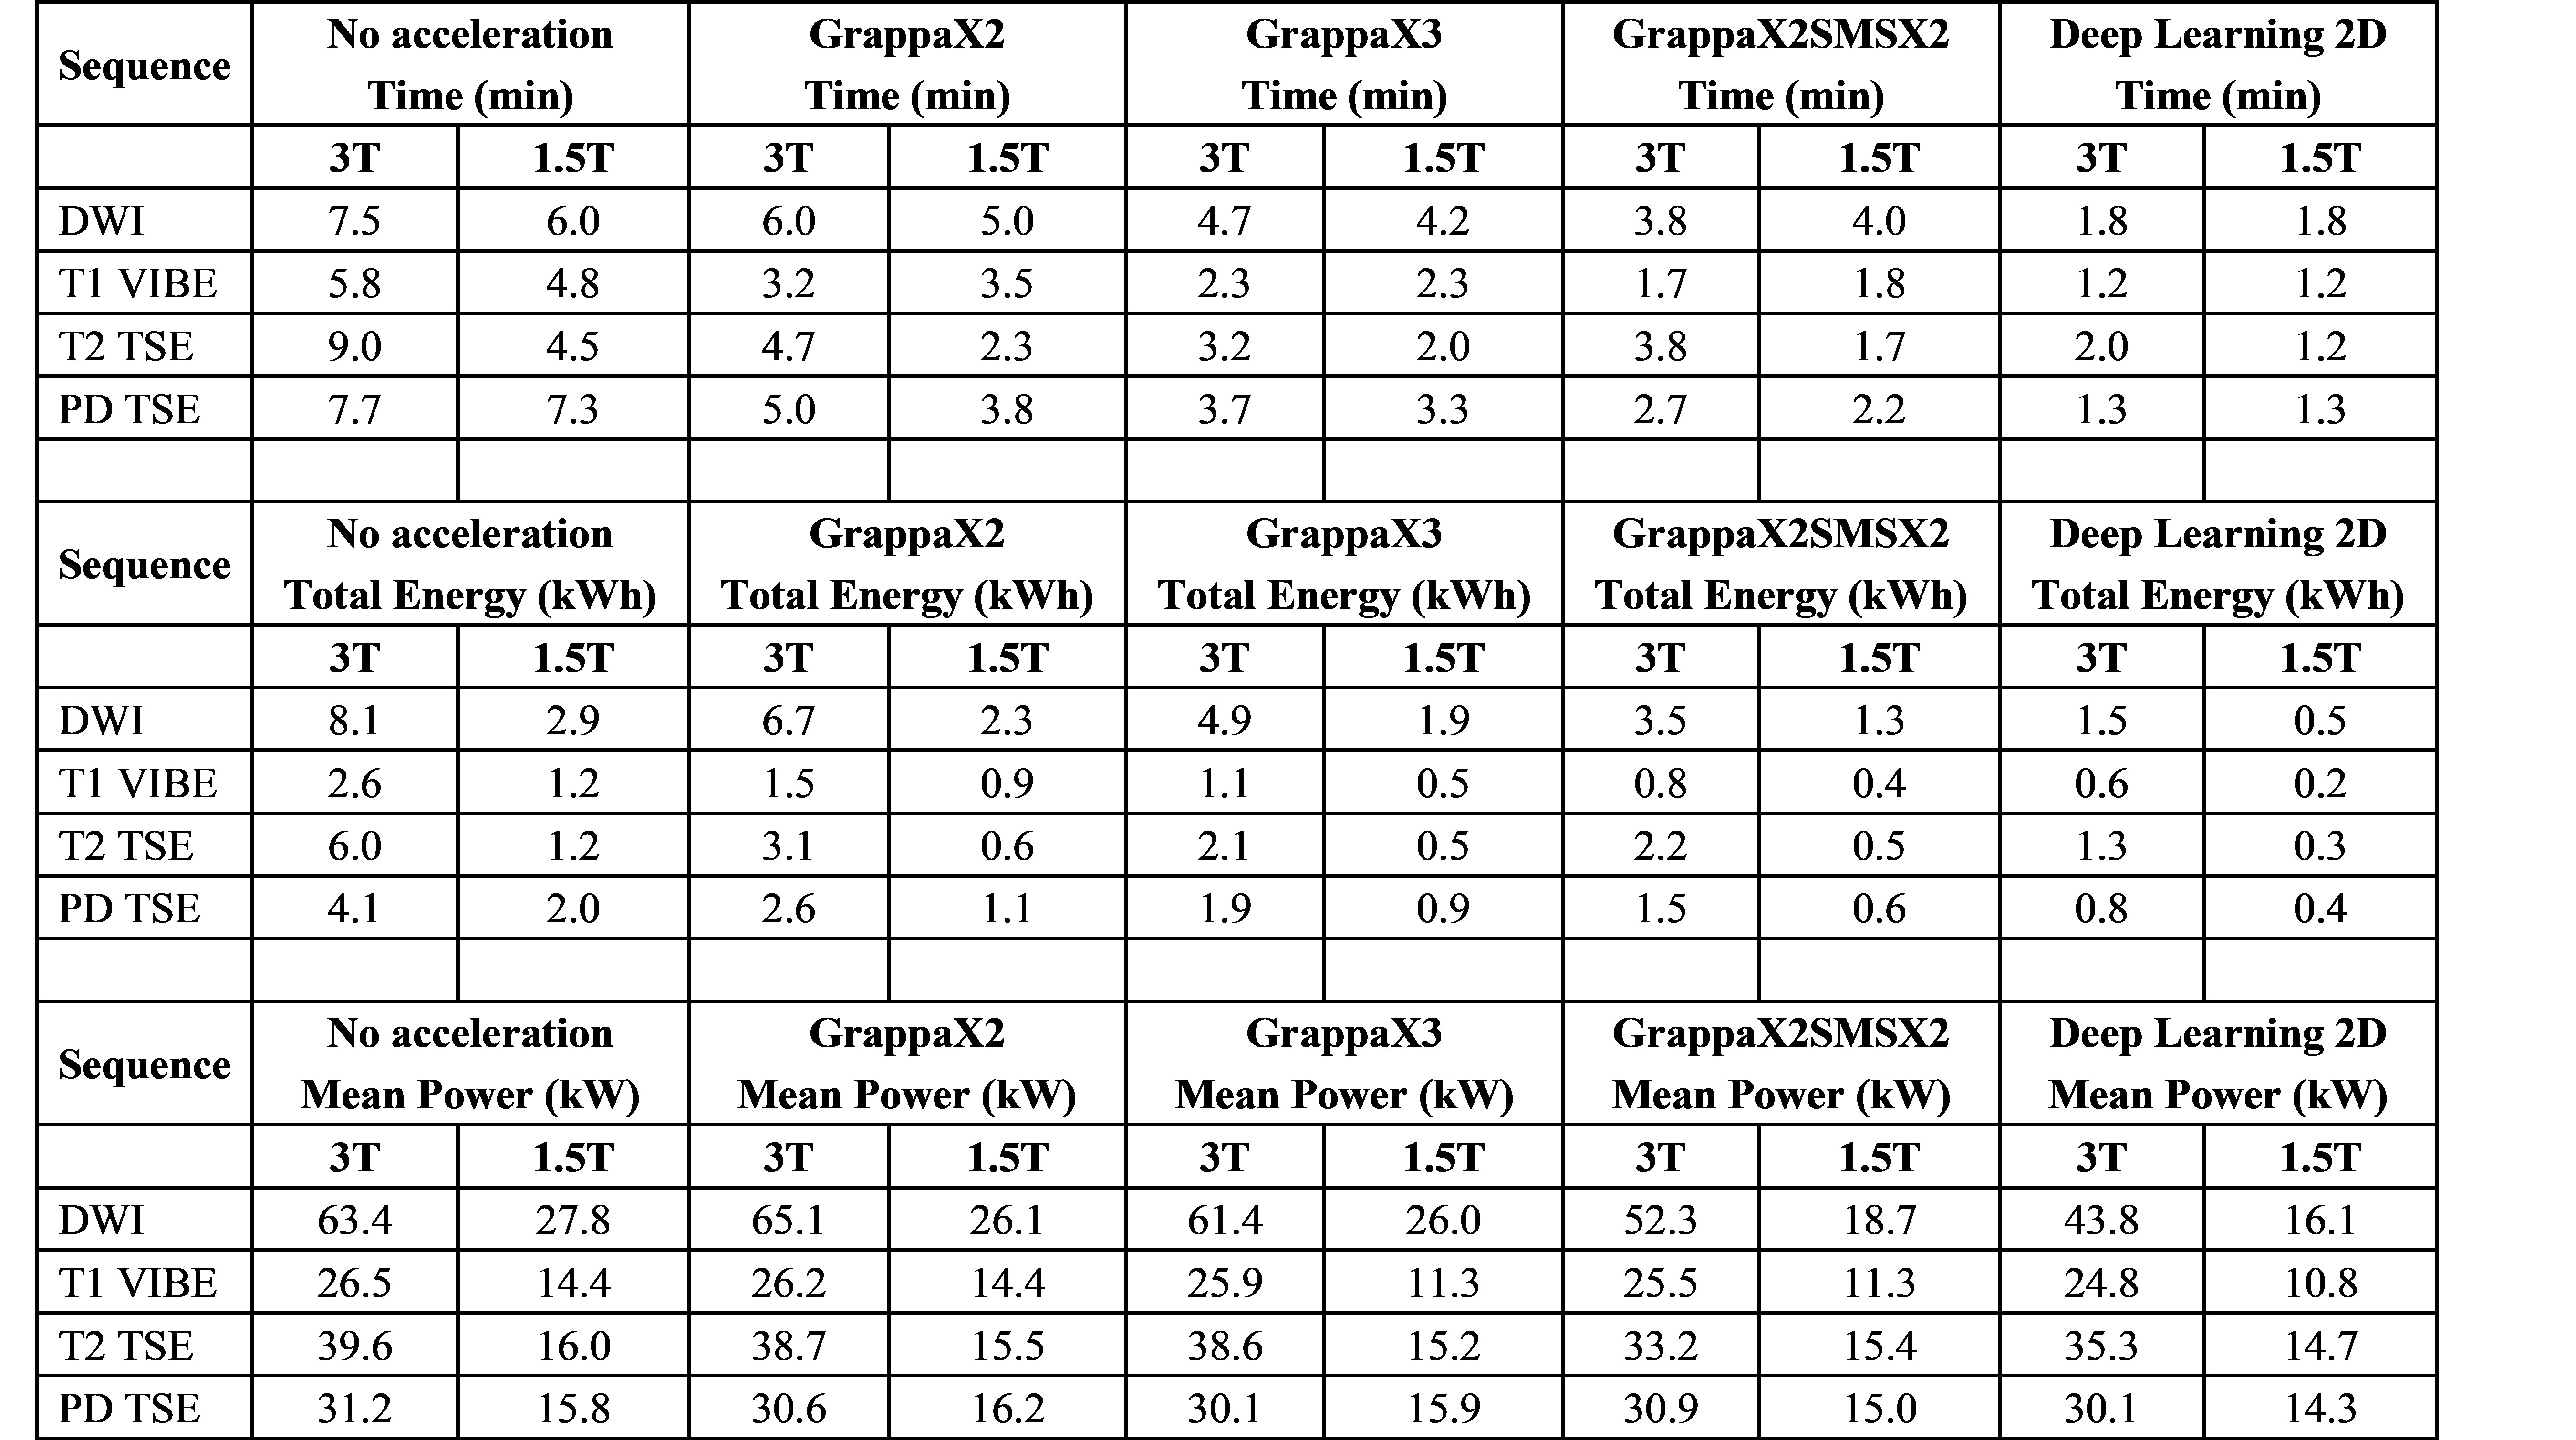
Figure 1: Table summary of the active scanning time (minutes), total energy (kWh), and mean power (kW) for various data acquisition acceleration methods on 3T MRI and 1.5T MRI. Values are reported for each individual sequence of a typical clinical imaging protocol including DWI, T1 VIBE, T2 TSE, PD TSE
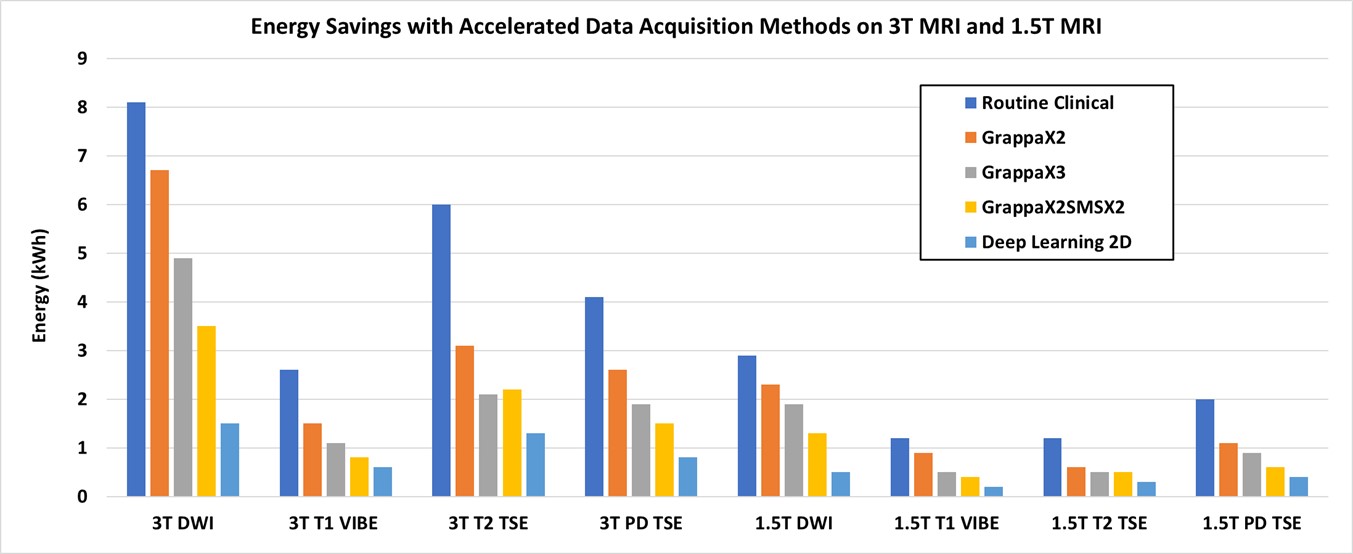
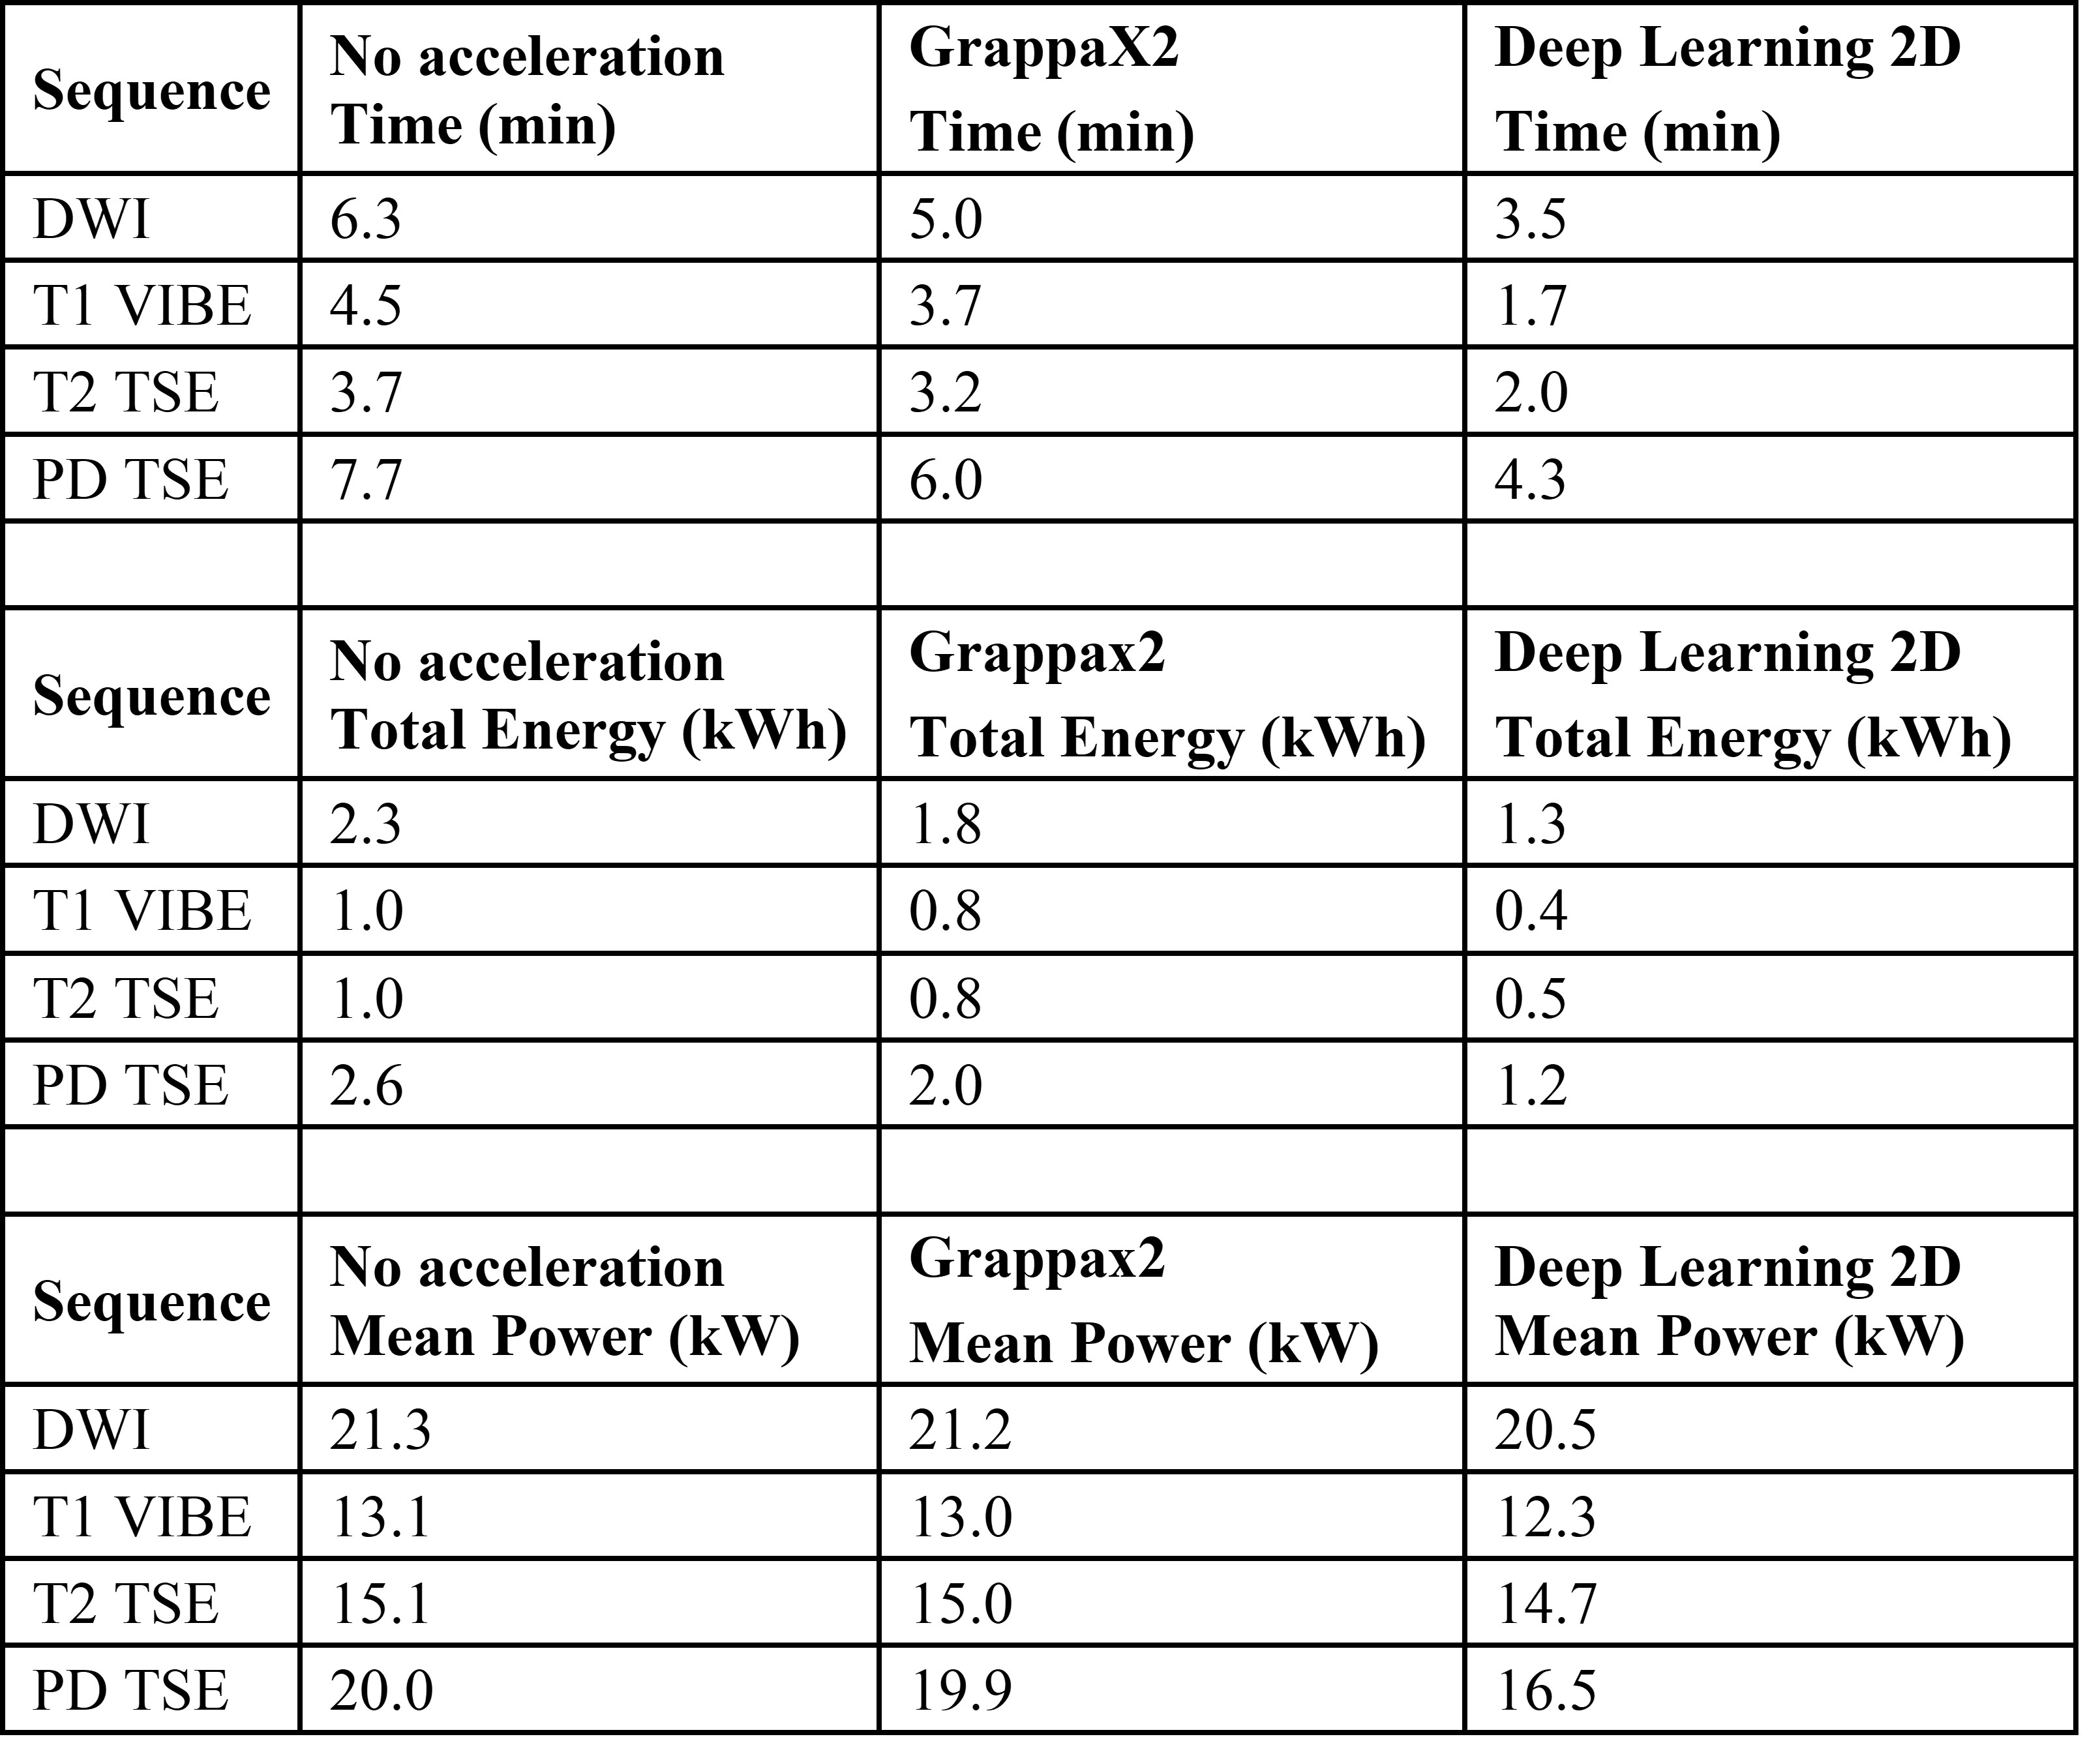
Figure 3: Table summary of the active scanning time (minutes), total energy (kWh), and mean power (kW) for various data acquisition acceleration methods on 0.55T MRI. Values are reported for each individual sequence of a typical clinical imaging protocol including DWI, T1 VIBE, T2 TSE, PD TSE
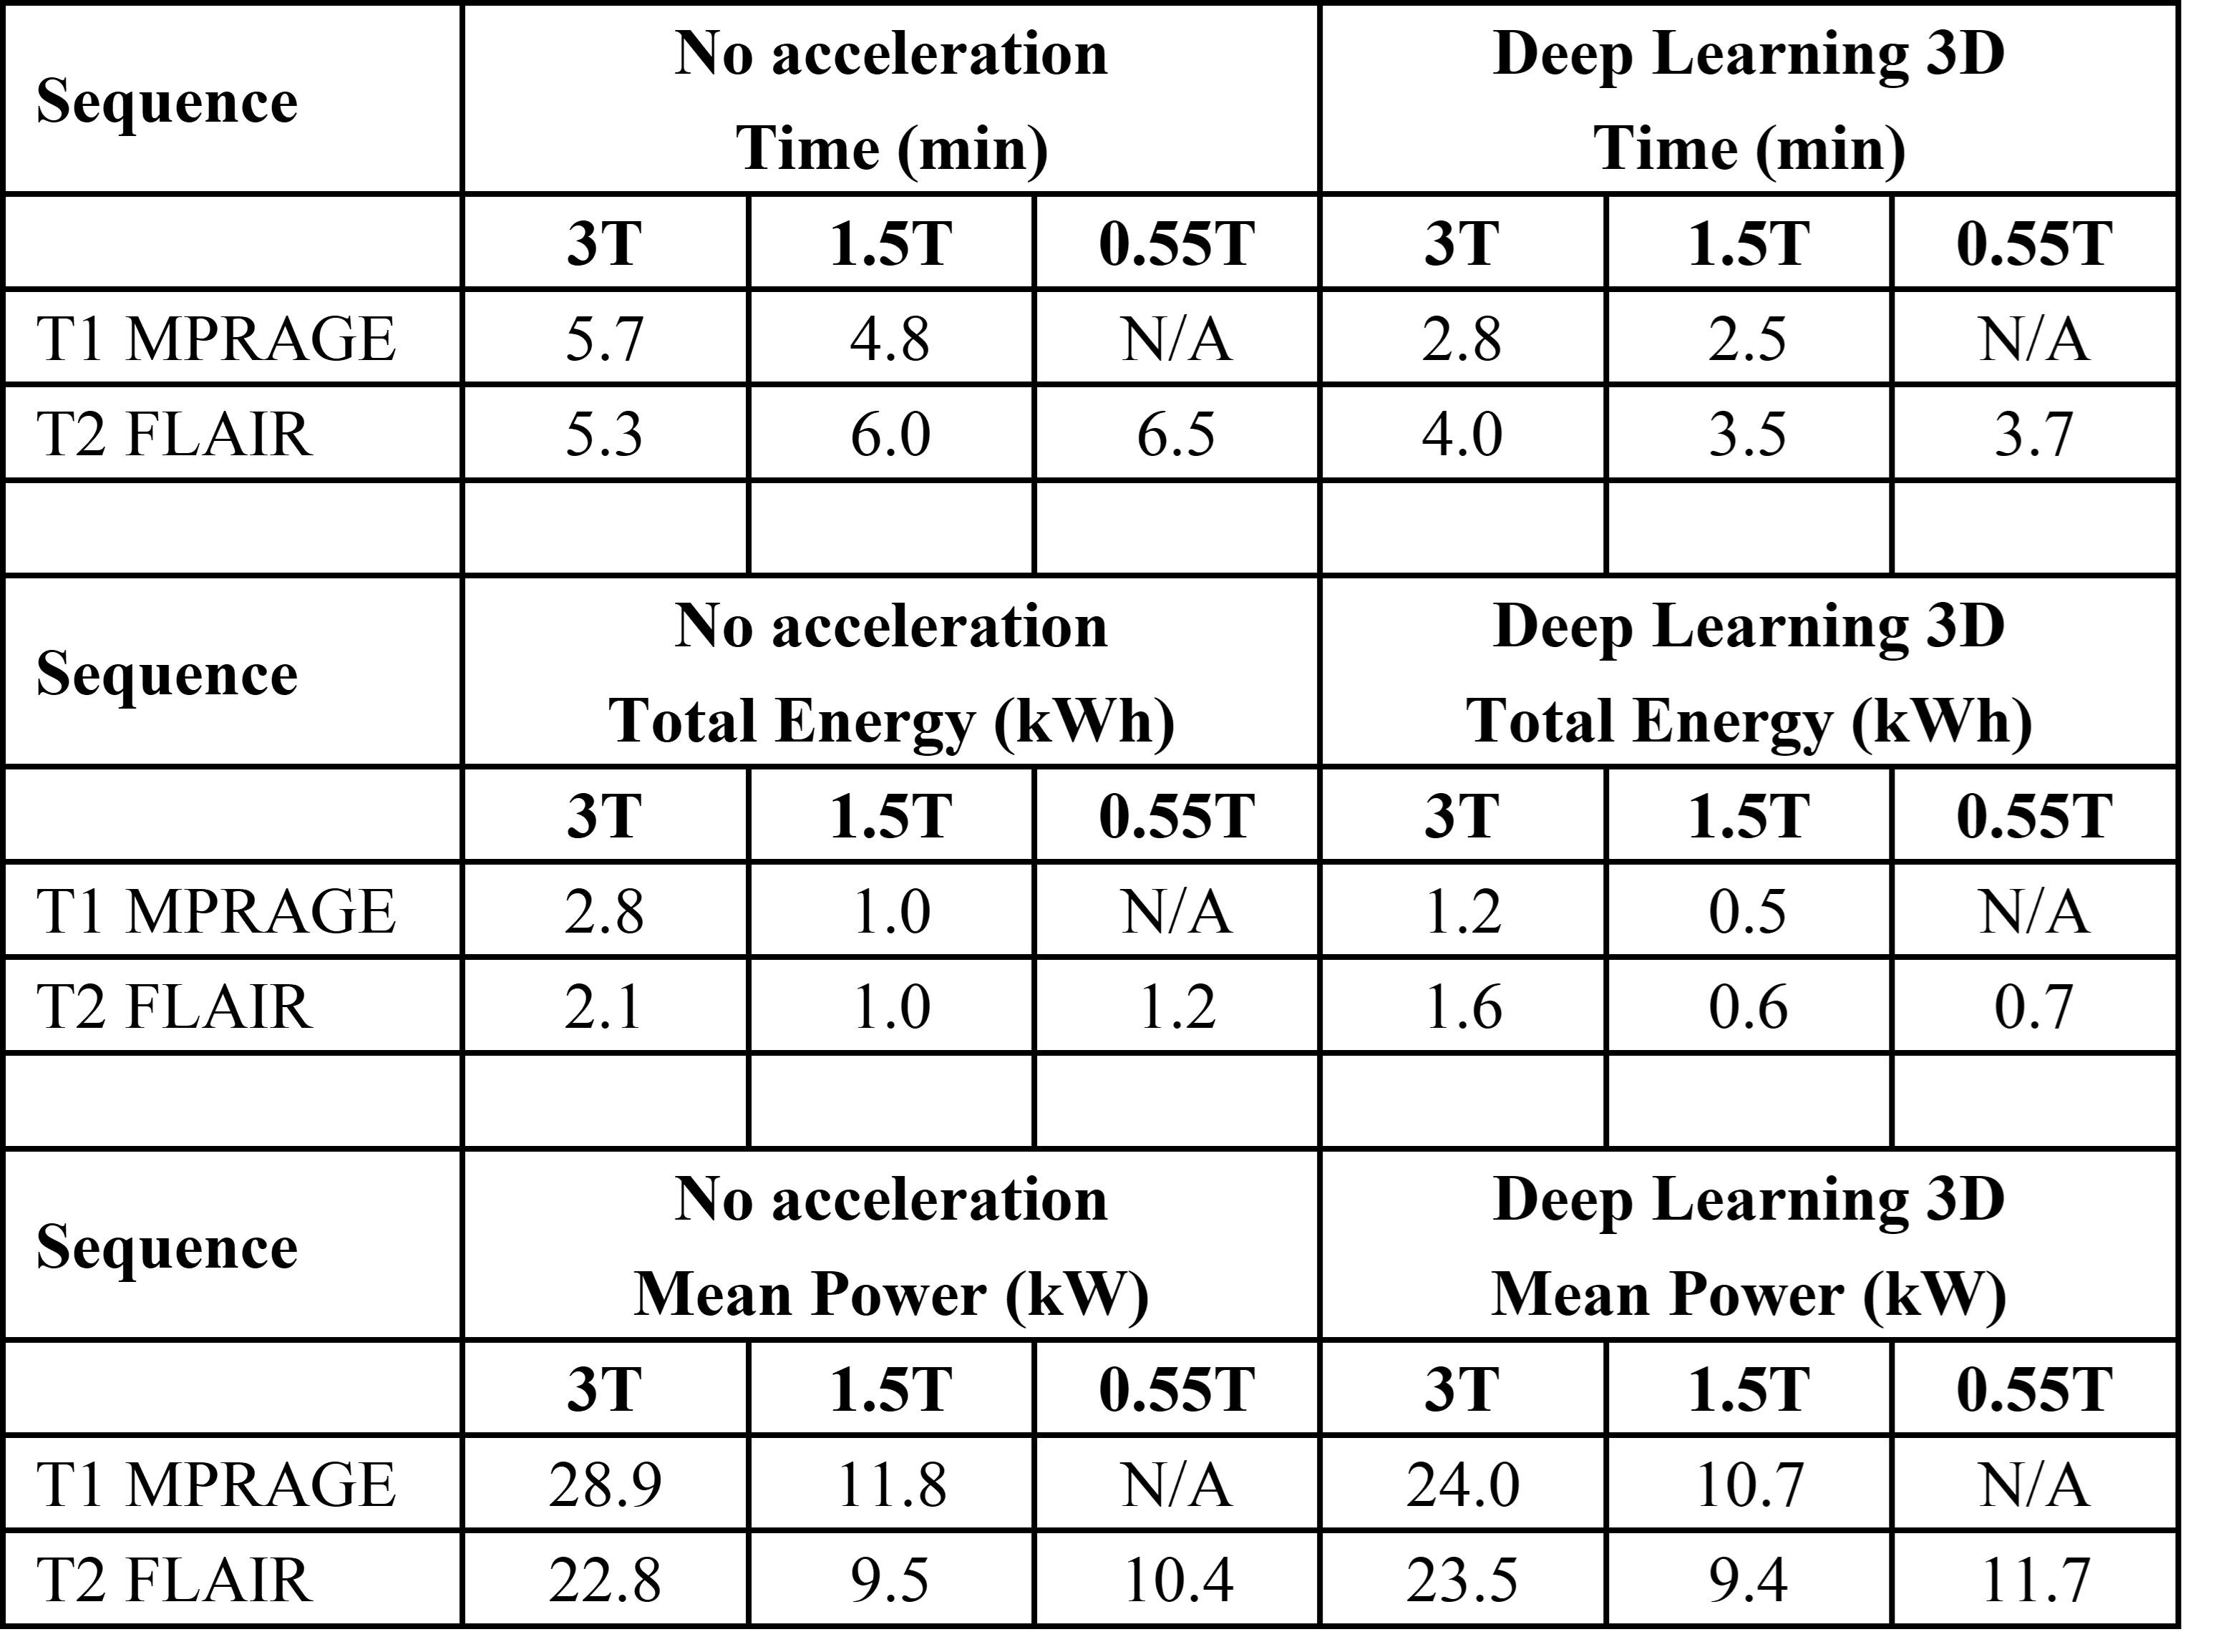
Figure 4: Table summary of active scanning time (minutes), total energy (kWh), and mean power (kW) for 3D MRI data acquired using routine clinical sequences and deep learning 3D accelerated sequences on 3T MRI, 1.5T MRI, 0.55T MRI. Values are reported for each individual sequence of a typical clinical imaging protocol including sequences T1 MPRAGE and T2 FLAIR.
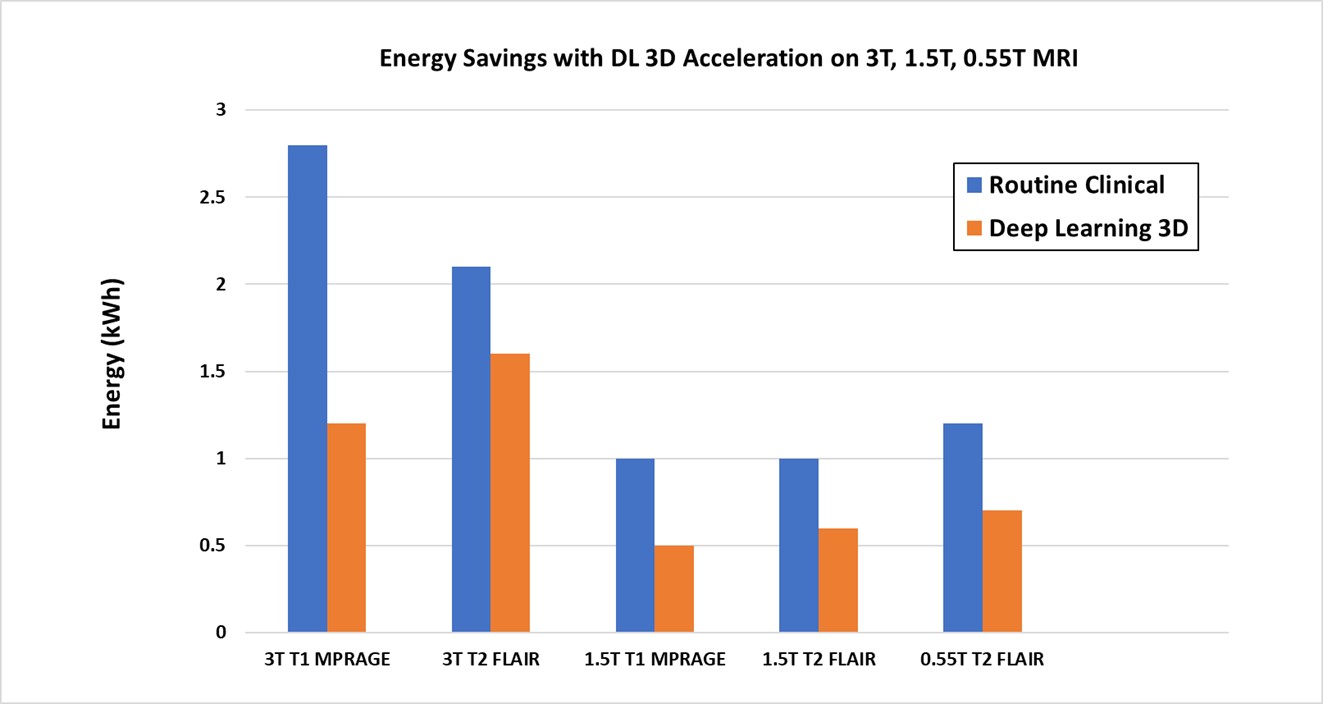
Figure 5: Energy consumption for 3D MRI data acquired using routine clinical imaging sequences compared to DL 3D accelerated sequences. Energy values were reported for each individual sequence of a typical clinical imaging protocol including T1 MPRAGE and T2 FLAIR sequences on 3T MRI, 1.5T MRI, 0.55T MRI. This plot reflects the values reported in Figure 4.