4575
An UTE-Stack-Of-Spirals Sequence For Biexponential-T1ρ Mapping of Knee Joint1Bernard and Irene Schwartz Center for Biomedical Imaging, Department of Radiology, New York University Grossman School of Medicine, New York City, NY, United States, 2Center for Advanced Imaging Innovation and Research (CAI2R), Department of Radiology, New York University Grossman School of Medicine, New York City, NY, United States, 3Siemens Medical Solutions USA Inc, Malven, PA, United States, 4MR Application Predevelopment, Siemens Healthineers AG, Erlangen, Germany
Synopsis
Keywords: Pulse Sequence Design, Quantitative Imaging
Motivation: Quantitative mapping of the whole knee joint could potentially improve the understanding of how OA initiates and progresses.
Goal(s): To develop an UTE-based spiral sequence capable of quantifying biexponential T1ρ in knee cartilage, ligaments, tendons, and menisci.
Approach: An UTE stack-of-spirals sequence with a magnetization-preparation module was developed and tested on healthy volunteers at 3T.
Results: The developed UTE-based spiral sequence presented an increased signal-to-noise ratio in T1ρ- weighted images and a smaller standard deviation in quantitative maps.
Impact: The feasibility of the UTE-based spiral sequence was demonstrated and showed potential for quantifying T1ρ on short T2 components in the whole knee joint.
INTRODUCTION
Osteoarthritis (OA) is the most common joint disorder that affects not only cartilage but also other connective tissues1. Quantitative mapping of the whole knee joint could potentially improve the understanding of how OA initiates and progresses. Ligaments and tendons usually have very short T2*, thus requiring Ultra-short Echo Time (UTE) sequences2,3. OA has been shown to significantly alter cartilage composition which affects T1ρ due to changes in the collagen network and loss of proteoglycans (PGs)4,5. Connective tissue is made up mostly of collagen but also composed of proteoglycans, such as decorin, which are important for the extracellular matrix integrity and regulation of collagen fibrillogenesis6,7. PGs are also related to the viscoelastic properties of the cartilage and connective tissue6. Previous studies looked into the relation of menisci/ligament injuries with cartilage T2 and T1ρ, and the effects of aging in the cartilage and ligaments8–10. A more comprehensive quantitative analysis of the whole joint and the relations between the different tissues with the onset of disease, or aging, requires a UTE sequence capable of quantifying T1ρ of the whole knee joint structures. Here, we developed and implemented an UTE-based spiral sequence to quantify bi-exponential T1ρ maps of the whole knee joint (cartilage, menisci, ligaments, and tendon).Methods
All the MRI data were acquired on a 3T scanner (MAGNETOM Prisma, Siemens Healthineers, Erlangen, Germany) with a vendor-provided 1-Tx/15-Rx knee coil (QED, OH). Three healthy volunteers with an average age of 30 years were recruited.A Double-Echo Steady-State (DESS) sequence was used for segmenting the cartilage. It was acquired with a Field-of-View (FOV) of 160x160mm2, matrix size of 320, and slice thickness of 1.5mm. A magnetization-prepared (MP) Turbo FLASH (TFL) sequence with cartesian readout was used as a reference for T1ρ measurements in the cartilage, as it requires a longer echo time inappropriate for short T2* tissues.
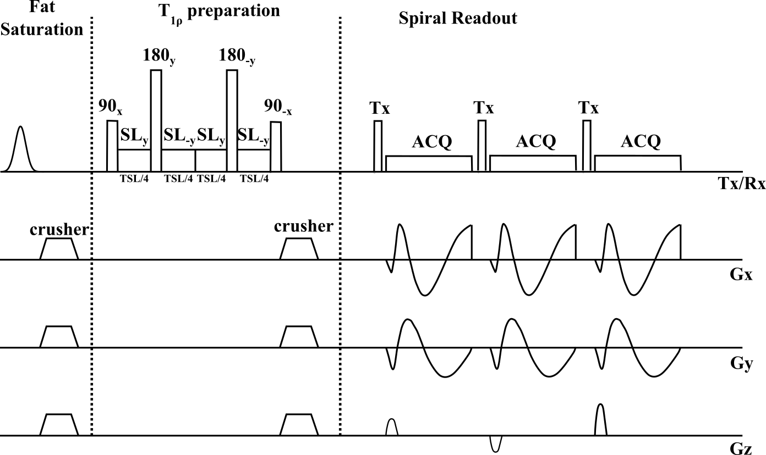
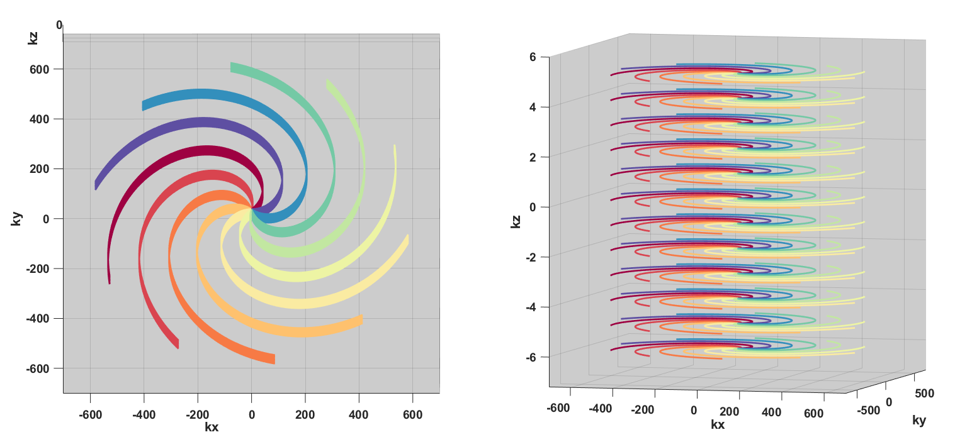
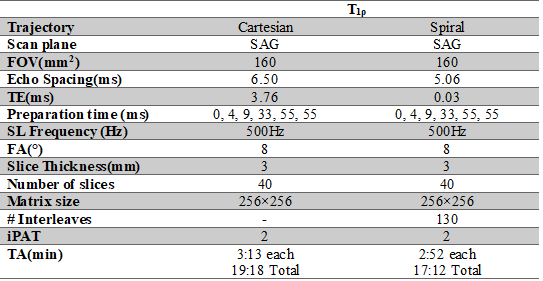
The T1ρ-UTE research application sequence is based on a VIBE sequence with stack-of-spirals sampling, using a spiral trajectory in-plane and Cartesian sampling along the partition direction. A fat-saturation pulse is applied at the beginning of the sequence, followed by a T1ρ magnetization-preparation pulse train. To ensure consistent contrast in the k-space center, partition-in-line reordering is performed. After the preparation, the entire partition stack is acquired with one spiral interleaf, followed by a delay for T1 recovery. Subsequently, this scheme is repeated for the number of interleaves defined in the protocol. The pulse sequence diagram is shown in Figure 1, while additional details on both TFL and VIBE sequences are shown in Table 1. T1ρ bi-exponential relaxation components were obtained using a magnitude-only neural network-based fitting to
$$A\left( f.\exp\left(\frac{t}{T_{1\rho_S}} \right) + (1-f).\exp\left( -\frac{t}{T_{1\rho_L}} \right) \right) + c $$
where $$$T_{1\rho_S}$$$ denotes the shorter relaxation component, $$$T_{1\rho_L}$$$ the longer relaxation component, and $$$f$$$ denotes the percentage of the total amplitude belonging to the shorter component11.
This study was approved by the institutional review board (IRB) of New York University Langone Health and was compliant with the Health Insurance Portability and Accountability Act (HIPAA). All volunteers provided their consent before MRI scanning.
Results
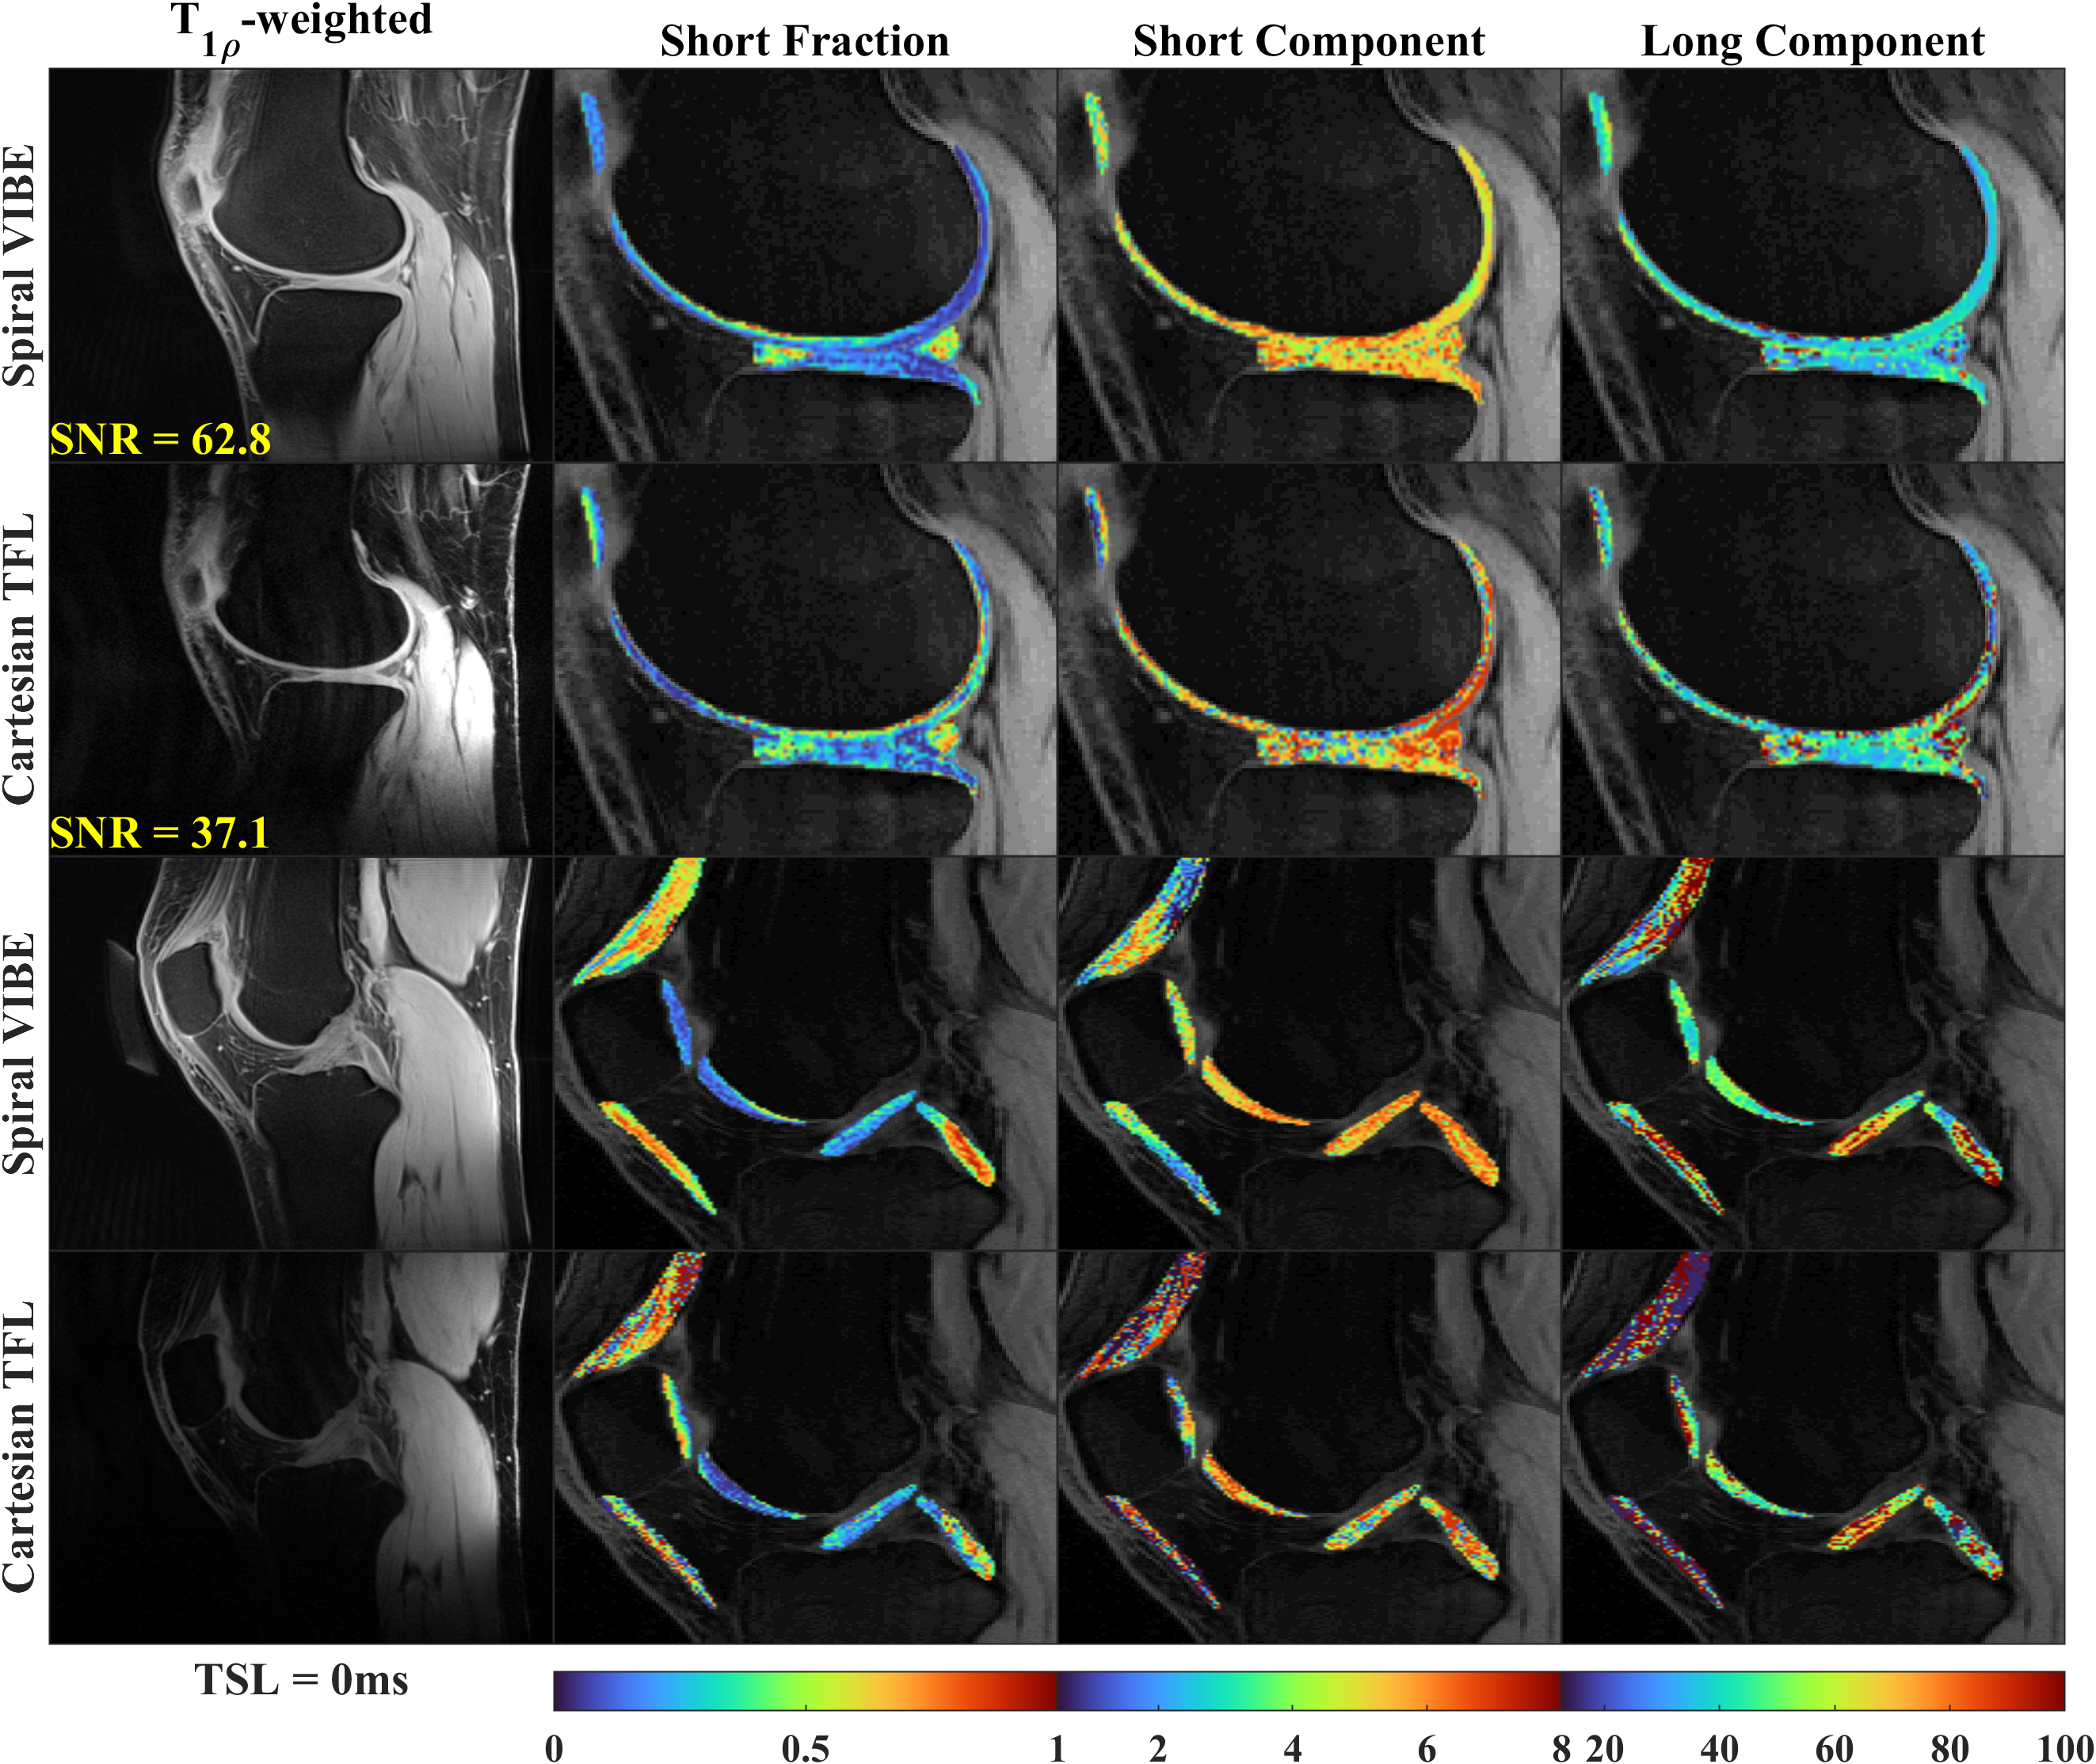
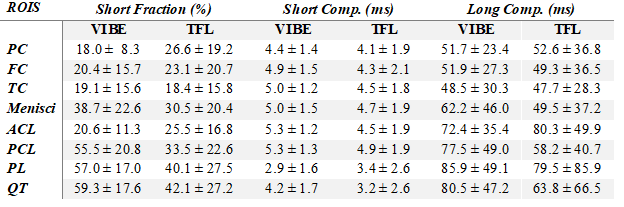
Representative images of the T1ρ-weighted and T1ρ bi-exponential maps are shown in Figure 3. Marchenko-Pastur principal component analysis (MP-PCA) was used to verify the signal-to-noise ratio (SNR) of the images acquired from both sequences. The SNR for TFL was 37.1 and for the VIBE was 62.8. The SNR efficiencies, calculated as the SNR divided by the square root of the acquisition time, were 1.09 and 1.96 for the TFL and VIBE, respectively.Table 2 summarizes the mean values across each of the ROIs, along with the corresponding standard deviation (SD). The short-fraction measured with VIBE was usually higher than the TFL measurements, except for the anterior cruciate ligament (ACL), and lower SD. The VIBE short relaxation time also presented lower SDs than with TFL.
Discussion
The spiral trajectory offered acquisitions that were both faster and of higher SNR, making it a more SNR-efficient sequence. The shorter acquisition is important for T1ρ fitting where multiple acquisitions are done with different spin-locking times (TSLs), especially for bi-exponential models which require more TSLs.The spiral trajectory enables the use of UTE, which allows imaging of short T2 tissues. The short-fraction and short-components measured with UTE presented lower SDs, which can mean increased precision when compared to TFL.
Conclusion
The UTE-based spiral sequence is able to quantify T1ρ across different tissues in the knee joint of healthy volunteers. When compared to a non-UTE cartesian acquisition, the developed sequence provided better SNR efficiency as well as whole joint assessment.Acknowledgements
This study was supported by NIH grants R01-AR076328-01A1, R01-AR076985-01A1, R01-AR078308-01A1, and R21-AR075259-01A1, and was performed under the rubric of the Center of Advanced Imaging Innovation and Research (CAI2R) at NYU Grossman School of Medicine, a NIBIB Biomedical Technology Resource Center (NIH P41 EB017183).References
1. Zhang Y, Jordan JM. Epidemiology of Osteoarthritis. Clin Geriatr Med. 2010;26(3):355-369. doi:10.1016/j.cger.2010.03.001
2. Liu J, Nazaran A, Ma Y, et al. Single- and Bicomponent Analyses of T2 Relaxation in Knee Tendon and Ligament by Using 3D Ultrashort Echo Time Cones (UTE Cones) Magnetic Resonance Imaging. Biomed Res Int. 2019;2019. doi:10.1155/2019/8597423
3. Kijowski R, Wilson JJ, Liu F. Bicomponent ultrashort echo time T2* analysis for assessment of patients with patellar tendinopathy. Journal of Magnetic Resonance Imaging. 2017;46(5):1441-1447. doi:10.1002/jmri.25689
4. Regatte RR, Akella SVS, Borthakur A, Kneeland JB, Reddy R. Proteoglycan depletion-induced changes in transverse relaxation maps of cartilage: Comparison of T2 and T1ρ. Acad Radiol. 2002;9(12):1388-1394. doi:10.1016/S1076-6332(03)80666-9
5. Regatte RR, Akella SVS, Lonner JH, Kneeland JB, Reddy R. T1ρ relaxation mapping in human osteoarthritis (OA) cartilage: Comparison of T1ρ with T2. Journal of Magnetic Resonance Imaging. 2006;23(4):547-553. doi:10.1002/jmri.20536
6. Leiphart RJ, Shetye SS, Weiss SN, Dyment NA, Soslowsky LJ. Induced Knockdown of Decorin, Alone and in Tandem With Biglycan Knockdown, Directly Increases Aged Murine Patellar Tendon Viscoelastic Properties. J Biomech Eng. 2020;142(11). doi:10.1115/1.4048030
7. Dunkman AA, Buckley MR, Mienaltowski MJ, et al. Decorin expression is important for age-related changes in tendon structure and mechanical properties. Matrix Biology. 2013;32(1):3-13. doi:10.1016/j.matbio.2012.11.005
8. Lansdown DA, Xiao W, Zhang AL, et al. Quantitative imaging of anterior cruciate ligament (ACL) graft demonstrates longitudinal compositional changes and relationships with clinical outcomes at 2 years after ACL reconstruction. Journal of Orthopaedic Research. 2020;38(6):1289-1295. doi:10.1002/jor.24572
9. Ranmuthu CDS, MacKay JW, Crowe VA, Kaggie JD, Kessler DA, McDonnell SM. Quantitative analysis of the ACL and PCL using T1rho and T2 relaxation time mapping: an exploratory, cross-sectional comparison between OA and healthy control knees. BMC Musculoskelet Disord. 2021;22(1):916-916. doi:10.1186/S12891-021-04755-Y
10. McCarthy MM, Hannafin JA. The Mature Athlete: Aging Tendon and Ligament. Sports Health. 2014;6(1):41-48. doi:10.1177/1941738113485691
11. Sharafi A, Xia D, Chang G, Regatte RR. Biexponential T1ρ relaxation mapping of human knee cartilage in vivo at 3 T. NMR Biomed. 2017;30(10):e3760. doi:10.1002/nbm.3760
12. Theologis AA, Haughom B, Liang F, et al. Comparison of T1rho relaxation times between ACL-reconstructed knees and contralateral uninjured knees. Knee Surgery, Sports Traumatology, Arthroscopy. 2014;22(2):298-307. doi:10.1007/s00167-013-2397-z
13. Wang L, Chang G, Bencardino J, et al. T1rho MRI at 3T of menisci in patients with acute Anterior Cruciate Ligament (ACL) injury. Journal of Magnetic Resonance Imaging. 2015;41(2):544-549. doi:10.1002/jmri.24594
Figures