4571
Advancing Low-Field Abdominal MRI: A Comprehensive Dataset with Various Denoising Strategies1College of Health Science and Environmental Engineering, Shenzhen Technology University, Shenzhen, China, 2College of Applied Sciences, Shenzhen University, Shenzhen, China, 3College of Big Data and Internet, Shenzhen Technology University, Shenzhen, China
Synopsis
Keywords: Data Acquisition, Data Acquisition, Data Processing
Motivation: Abdominal MRI plays a crucial role in non-invasively visualizing abdominal structures.
Goal(s): But abdominal MRI data often faces artifacts such as the strong noise.
Approach: In this work, a low-field abdominal MRI dataset is presented, comprising multi-contrast multi-repetition abdominal images of 58 healthy subjects. The dataset includes images with different contrasts, i.e., BH (Breath Hold)-T1, FB (Free breath)-T2, RT (Respiratory Triggered)-T2, RT-FST2 (Respiratory Triggered Fat-Suppressed T2). Additionally, various denoising methods, including traditional, supervised and self-supervised approaches, were explored with different structures and various loss functions.
Results: These methods show promising results and provide some initial comparative conclusions for abdominal MRI denoising task.
Impact: A low-field abdominal MRI dataset is presented, and various denoising methods were explored. During denoising, the main challenge is the trade-off between detail preservation and denoising. This dataset can inspire further exploration and research in this field.
Synopsis
Abdominal MRI plays a crucial role in non-invasively visualizing abdominal structures. But abdominal MRI data often faces artifacts such as the strong noise. In this work, a low-field abdominal MRI dataset is presented, comprising multi-contrast multi-repetition abdominal images of 58 healthy subjects. The dataset includes images with different contrasts, i.e., BH (Breath Hold)-T1, FB (Free breath)-T2, RT (Respiratory Triggered)-T2, RT-FST2 (Respiratory Triggered Fat-Suppressed T2). Additionally, various denoising methods, including traditional, supervised and self-supervised approaches, were explored on this dataset with different structures and various loss functions. These methods show promising results and provide some initial comparative conclusions for abdominal MRI denoising task. We plan to release this dataset to public domain in near future.Introduction
Abdominal MRI plays a crucial role in non-invasively visualizing abdominal structures. The combination of abdominal MRI and low-field systems may offer a more affordable option for larger populations with some inherent advantages[1-7]. However, low-field abdominal MRI can be very challenging due to low signal-to-noise ratio (SNR) and motion artifacts. Here, we present a low-field abdominal MRI dataset, comprising multi-contrast multi-repetition data with different respiratory motion management. The multi-repetition averaged images can be utilized as labels for learning of real noise. Upon this dataset, various denoising methods were explored, including two supervised methods with different network structures and loss functions, and a self-supervised-Noise2Noise method (SS-N2N).Methods
1. The low-field abdominal MRI dataset.The dataset comprises abdominal MRI data collected from 58 healthy volunteers using a 0.3 Tesla whole-body MRI system (Xingaoyi, Oper-0.3) with 4-channel body coil, and includes BH (Breath Hold)-T1, FB (Free breath)-T2, RT (Respiratory Triggered)-T2, RT-FST2 (Respiratory Triggered Fat-Suppressed T2) images. Each contrast contains three repetitions. The detailed information of the dataset is provided in Fig.1. This dataset includes a total of 58x3x(28+20+20+20)=15312 images.
2. Denoising Methods.
Supervised learning: U-Net[8] and NAFNet[9] were trained. During training, the single repetition image from 46 subjects was used as input, and the multi-repetition averaged image was used as the labels. Both L1-pixel loss and perceptual loss were explored. Test was done on the 12 unseen subjects.
Self-supervised learning: A self-supervised learning method was also explored with similar structure of state-of-the-art method. Zero-shot Noise2noise[10], with the self-supervised module and denoising network module. During training, the single repetition images from 46 subjects were utilized without providing the averaged images as labels. The residual and consistency loss were used[10]. Test was done on the 12 unseen subjects as well.
Traditional: The classical BM3D[11] was evaluated with the sigma parameter set to the standard deviation of the background noise region of each image.
Results
The table in Fig.2 summarizes the objective evaluation results with BM3D[11], Unet[8] (L1), NAFNet[9] (L1), NAFNet[9] (Perceptual) and Self-supervised Noise-2-noise Method (SS-N2N)[10]. Both PSNR[12] and SSIM[13] are presented.L1 loss achieves better objective results than perceptual loss. Models with different structures (Unet vs NAFNet) achieves comparable results. Notably, the robustness of the SS-N2N method is better than that of the supervised and traditional methods, always obtaining the highest two scores for all types of data.
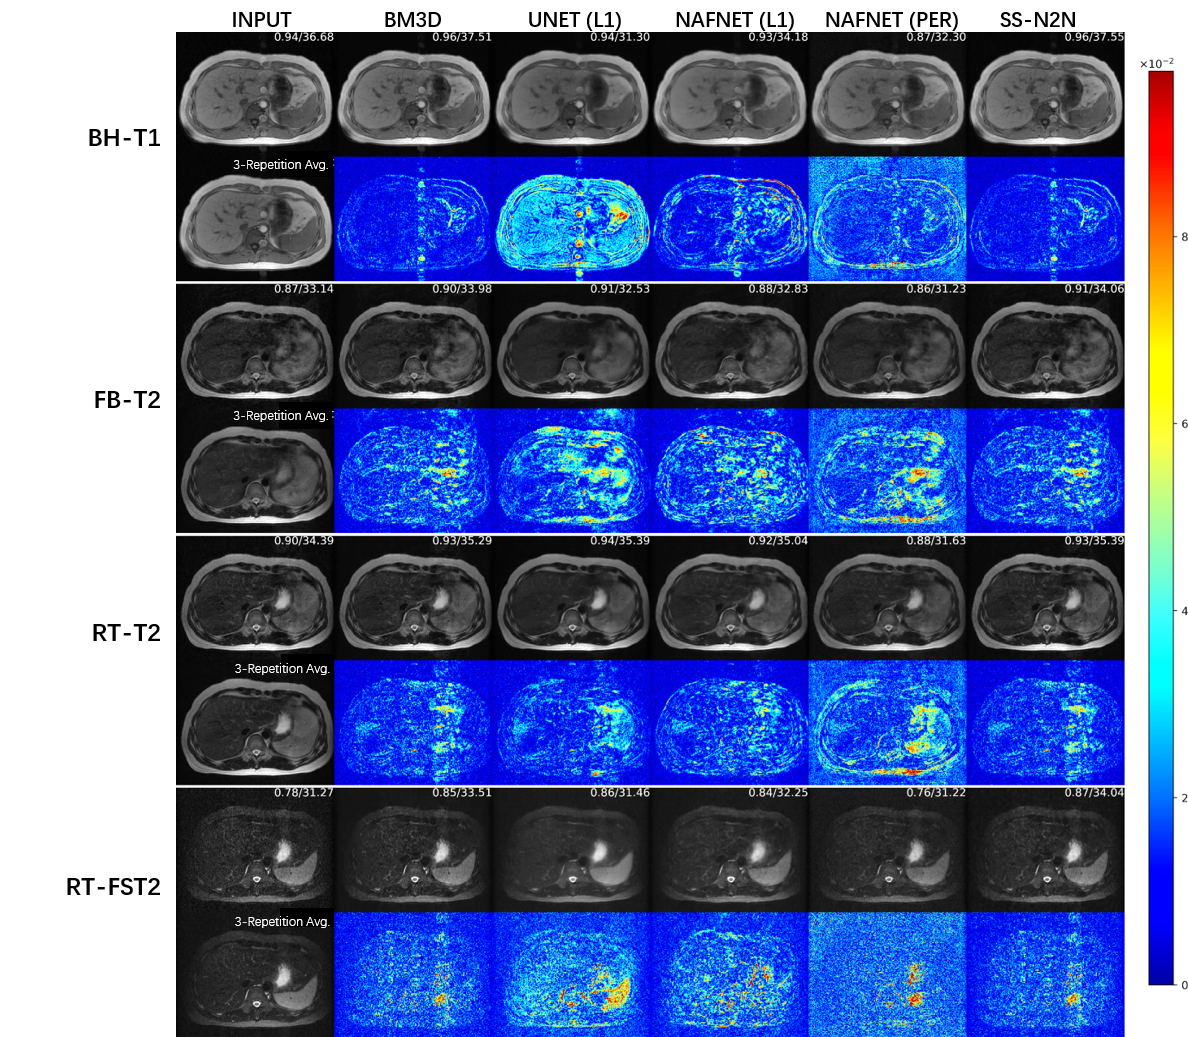
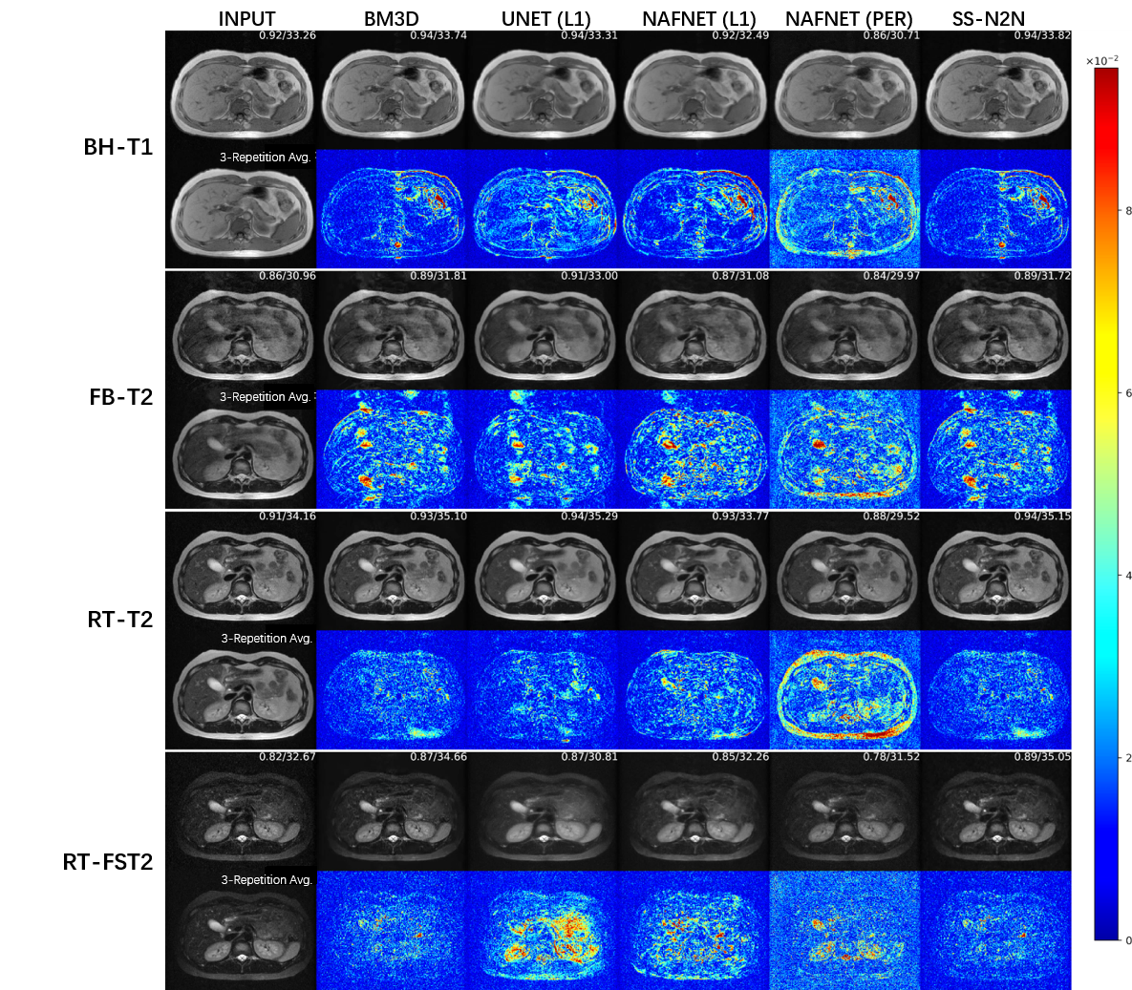
The denoised slices of the one representative subject are presented in Fig.3-4. Fig.3-4 shows the results of each method and the difference between them and the multi-repetition averaged image. These algorithms have good denoising effects on abdominal MRI images, especially the evident noise removal on RT-FST2 in Fig.3. In addition, Unet[8] and NAFNet[9] trained with L1 loss show the best noise removal effects. Besides, NAFNet[9] has better capability in preserving details compared to Unet[8], as shown in the FB-T2, RT-T2 and RT-FST2 of Fig.3. The results trained with perceptual loss generate more details compared to L1, but the denoising effect is relatively unsatisfactory, as shown in the significant differences in the background of the difference maps.
Discussion and Conclusion
This work presents a low-field, multi-repetition, multi-contrast abdominal MRI dataset, which can serve as a benchmark for developing related denoising algorithms. Various denoising methods were investigated on the dataset, and both subjective and objective evaluations were conducted. All of the traditional methods, supervised methods, and self-supervised method achieved evident denoising results. The self-supervised method demonstrated the best generalization power, leading to a good balance between noise removal and structure preserving. This is likely because it does not use the averaged images as labels, which can be misaligned with the single-repetition input due to motion. L1 loss shows better denoising effects but less preservation of details compared with perceptual loss. We plan to release this dataset to public domain in near future.Acknowledgements
This work was supported by the National Natural Science Foundation of China (No. 62101348), Shenzhen Higher Education Stable Support Program (No. 20220716111838002), and Natural Science Foundation of Top Talent of Shenzhen Technology University (No. 20200208).References
[1]. Marques, José P., Frank FJ Simonis, and Andrew G. Webb. "Low‐field MRI: An MR physics perspective." Journal of magnetic resonance imaging 49.6 (2019): 1528-1542.
[2]. Arnold, Thomas Campbell, et al. "Low‐field MRI: Clinical promise and challenges." Journal of Magnetic Resonance Imaging 57.1 (2023): 25-44.
[3]. Sarracanie, Mathieu, and Najat Salameh. "Low-field MRI: how low can we go? A fresh view on an old debate." Frontiers in Physics 8 (2020): 172.
[4]. Lang, Min, et al. "Emerging Techniques and Future Directions: Fast and Portable Magnetic Resonance Imaging." Magnetic Resonance Imaging Clinics 30.3 (2022): 565-582.
[5]. Geethanath, Sairam, and John Thomas Vaughan Jr. "Accessible magnetic resonance imaging: a review." Journal of Magnetic Resonance Imaging 49.7 (2019): e65-e77.
[6]. Liu, Yilong, et al. "A low-cost and shielding-free ultra-low-field brain MRI scanner." Nature communications 12.1 (2021): 7238.
[7] Lyu M, Mei L, Huang S, et al. M4Raw: A multi-contrast, multi-repetition, multi-channel MRI k-space dataset for low-field MRI research[J]. Scientific Data, 2023, 10(1): 264.
[8] Ronneberger, Olaf, Philipp Fischer, and Thomas Brox. "U-net: Convolutional networks for biomedical image segmentation." Medical Image Computing and Computer-Assisted Intervention–MICCAI 2015: 18th International Conference, Munich, Germany, October 5-9, 2015, Proceedings, Part III 18. Springer International Publishing, 2015.
[9] Chen L, Chu X, Zhang X, et al. Simple baselines for image restoration[C]//European Conference on Computer Vision. Cham: Springer Nature Switzerland, 2022: 17-33.
[10] Mansour, Youssef, and Reinhard Heckel. "Zero-Shot Noise2Noise: Efficient Image Denoising without any Data." Proceedings of the IEEE/CVF Conference on Computer Vision and Pattern Recognition. 2023.
[11] Dabov, Kostadin; Foi, Alessandro; Katkovnik, Vladimir; Egiazarian, Karen (16 July 2007). "Image denoising by sparse 3D transform-domain collaborative filtering". IEEE Transactions on Image Processing. 16 (8): 2080–2095.
[12] Oriani, Emanuele. "qpsnr: A quick PSNR/SSIM analyzer for Linux". Retrieved 6 April 2011.
[13] Wang, Zhou; Bovik, A.C.; Sheikh, H.R.; Simoncelli, E.P. (2004-04-01). "Image quality assessment: from error visibility to structural similarity". IEEE Transactions on Image Processing. 13 (4): 600–612.
Figures