4570
Diffusion Tensor Imaging using dual-echo steady-state method at Ultra-High-Field 7T MRI1MR Research Collaboration Team, Siemens Healthineers Ltd., Shanghai, China, 2Siemens Healthcare GmbH, Erlangen, Germany
Synopsis
Keywords: Quantitative Imaging, Diffusion/other diffusion imaging techniques
Motivation: High-resolution diffusion imaging is often perceived as less beneficial at ultra-high magnetic fields due to shorter T2 relaxation times. However, it is critical for detecting small lesions and assessing cartilage integrity.
Goal(s): Our goal was to achieve high-resolution diffusion imaging that leverages the advantages of ultra-high magnetic fields.
Approach: We employed diffusion-weighted DESS imaging to estimate diffusion tensor and fractional anisotropy in hand imaging.
Results: DW DESS yielded superior image quality compared to conventional spin-echo EPI. It shows promise as a high-resolution diffusion imaging method, harnessing the potential benefits of ultra-high magnetic fields for musculoskeletal applications.
Impact: Our study shows that DW DESS imaging offers high-resolution diffusion imaging benefits at ultra-high magnetic fields, particularly in musculoskeletal applications, with superior image quality and clinical relevance.
Introduction
Diffusion-weighted imaging (DWI) has emerged as a promising tool for the early assessment of muscle and cartilage damage1,2. The knee cartilage, with a 2mm thickness, demands high-resolution image. However, high-resolution spin-echo (SE) echo-planar imaging (EPI) often requires longer echo times, posing challenges for tissues with inherently short T2 relaxation times. This issue is further exacerbated at ultra-high magnetic field strengths, where T2 is shorter. To tackle these challenges, the diffusion-weighted (DW) dual-echo steady-state (DESS) method was introduced. DW-DESS has already demonstrated its effectiveness in achieving high-resolution T2 and ADC maps, spanning applications from tumor detection to musculoskeletal disease and brain imaging3,4,5. However, the susceptibility of the DESS method to motion artifacts has limited its application in estimating diffusion tensor parameters. In this study, we demonstrate the use of high-resolution diffusion tensor DESS imaging for hand imaging at 7T.Method
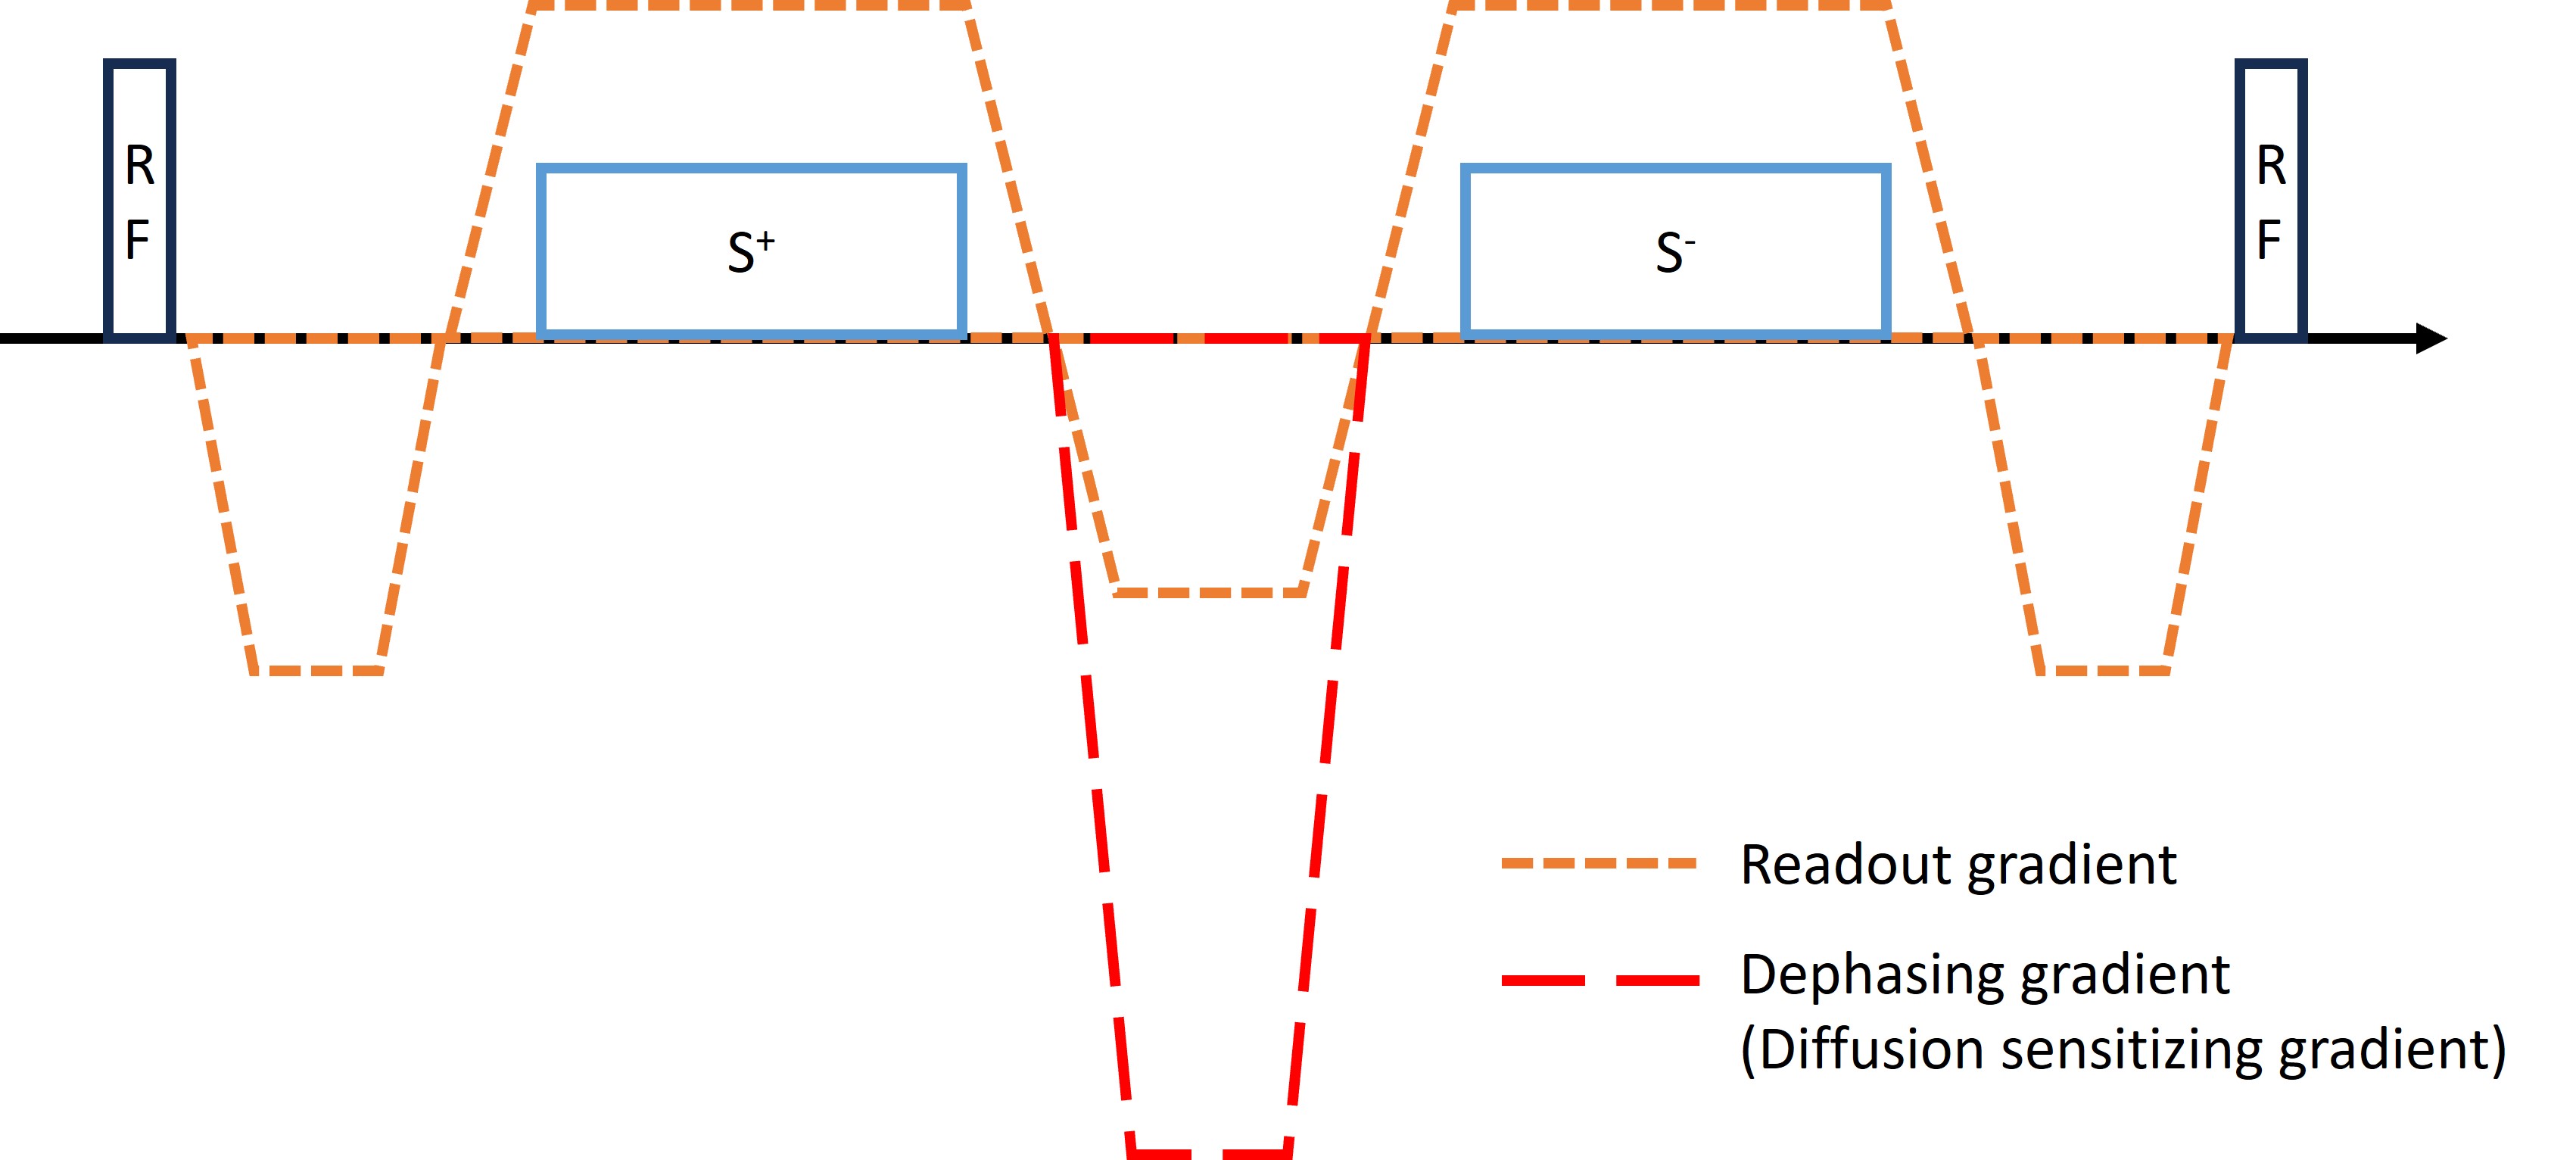
In the DESS research sequence, a dephasing gradient is applied between the acquisition of the GRE echo (S+) and the reversed GRE echo (Figure 1). The diffusion coefficients are estimated by comparing the signal change between small and large dephasing gradients4. In this study, we acquired images along six dephasing gradient directions with a gradient moment of 149.5ms·mT/m and one image with a small dephasing gradient moment (MOMT) of 39.8ms·mT/m. To simulate the signals of S+(MOMT,T1,T2,D,TR,TE,B1) and S-(MOMT,T1,T2,D,TR,TE,B1), we employed extended phase graph theory6. The T2 and diffusion coefficients were estimated by identifying the highest correlation between the acquired signals and the simulated signals for each voxel. The six estimated diffusion coefficients were then used to calculate the diffusion tensor at each voxel and mean diffusivity and fractional anisotropy were subsequently calculated. All imaging data were acquired at a 7T MAGNETOM Terra (Siemens Healthineers, Erlangen, Germany) using a 1Tx/32Rx head coil (Nova Medical, Wilmington, MA). Due to the absence of a dedicated wrist coil, we used the available head coil off-label. The imaging parameters are provided in the figures.Results
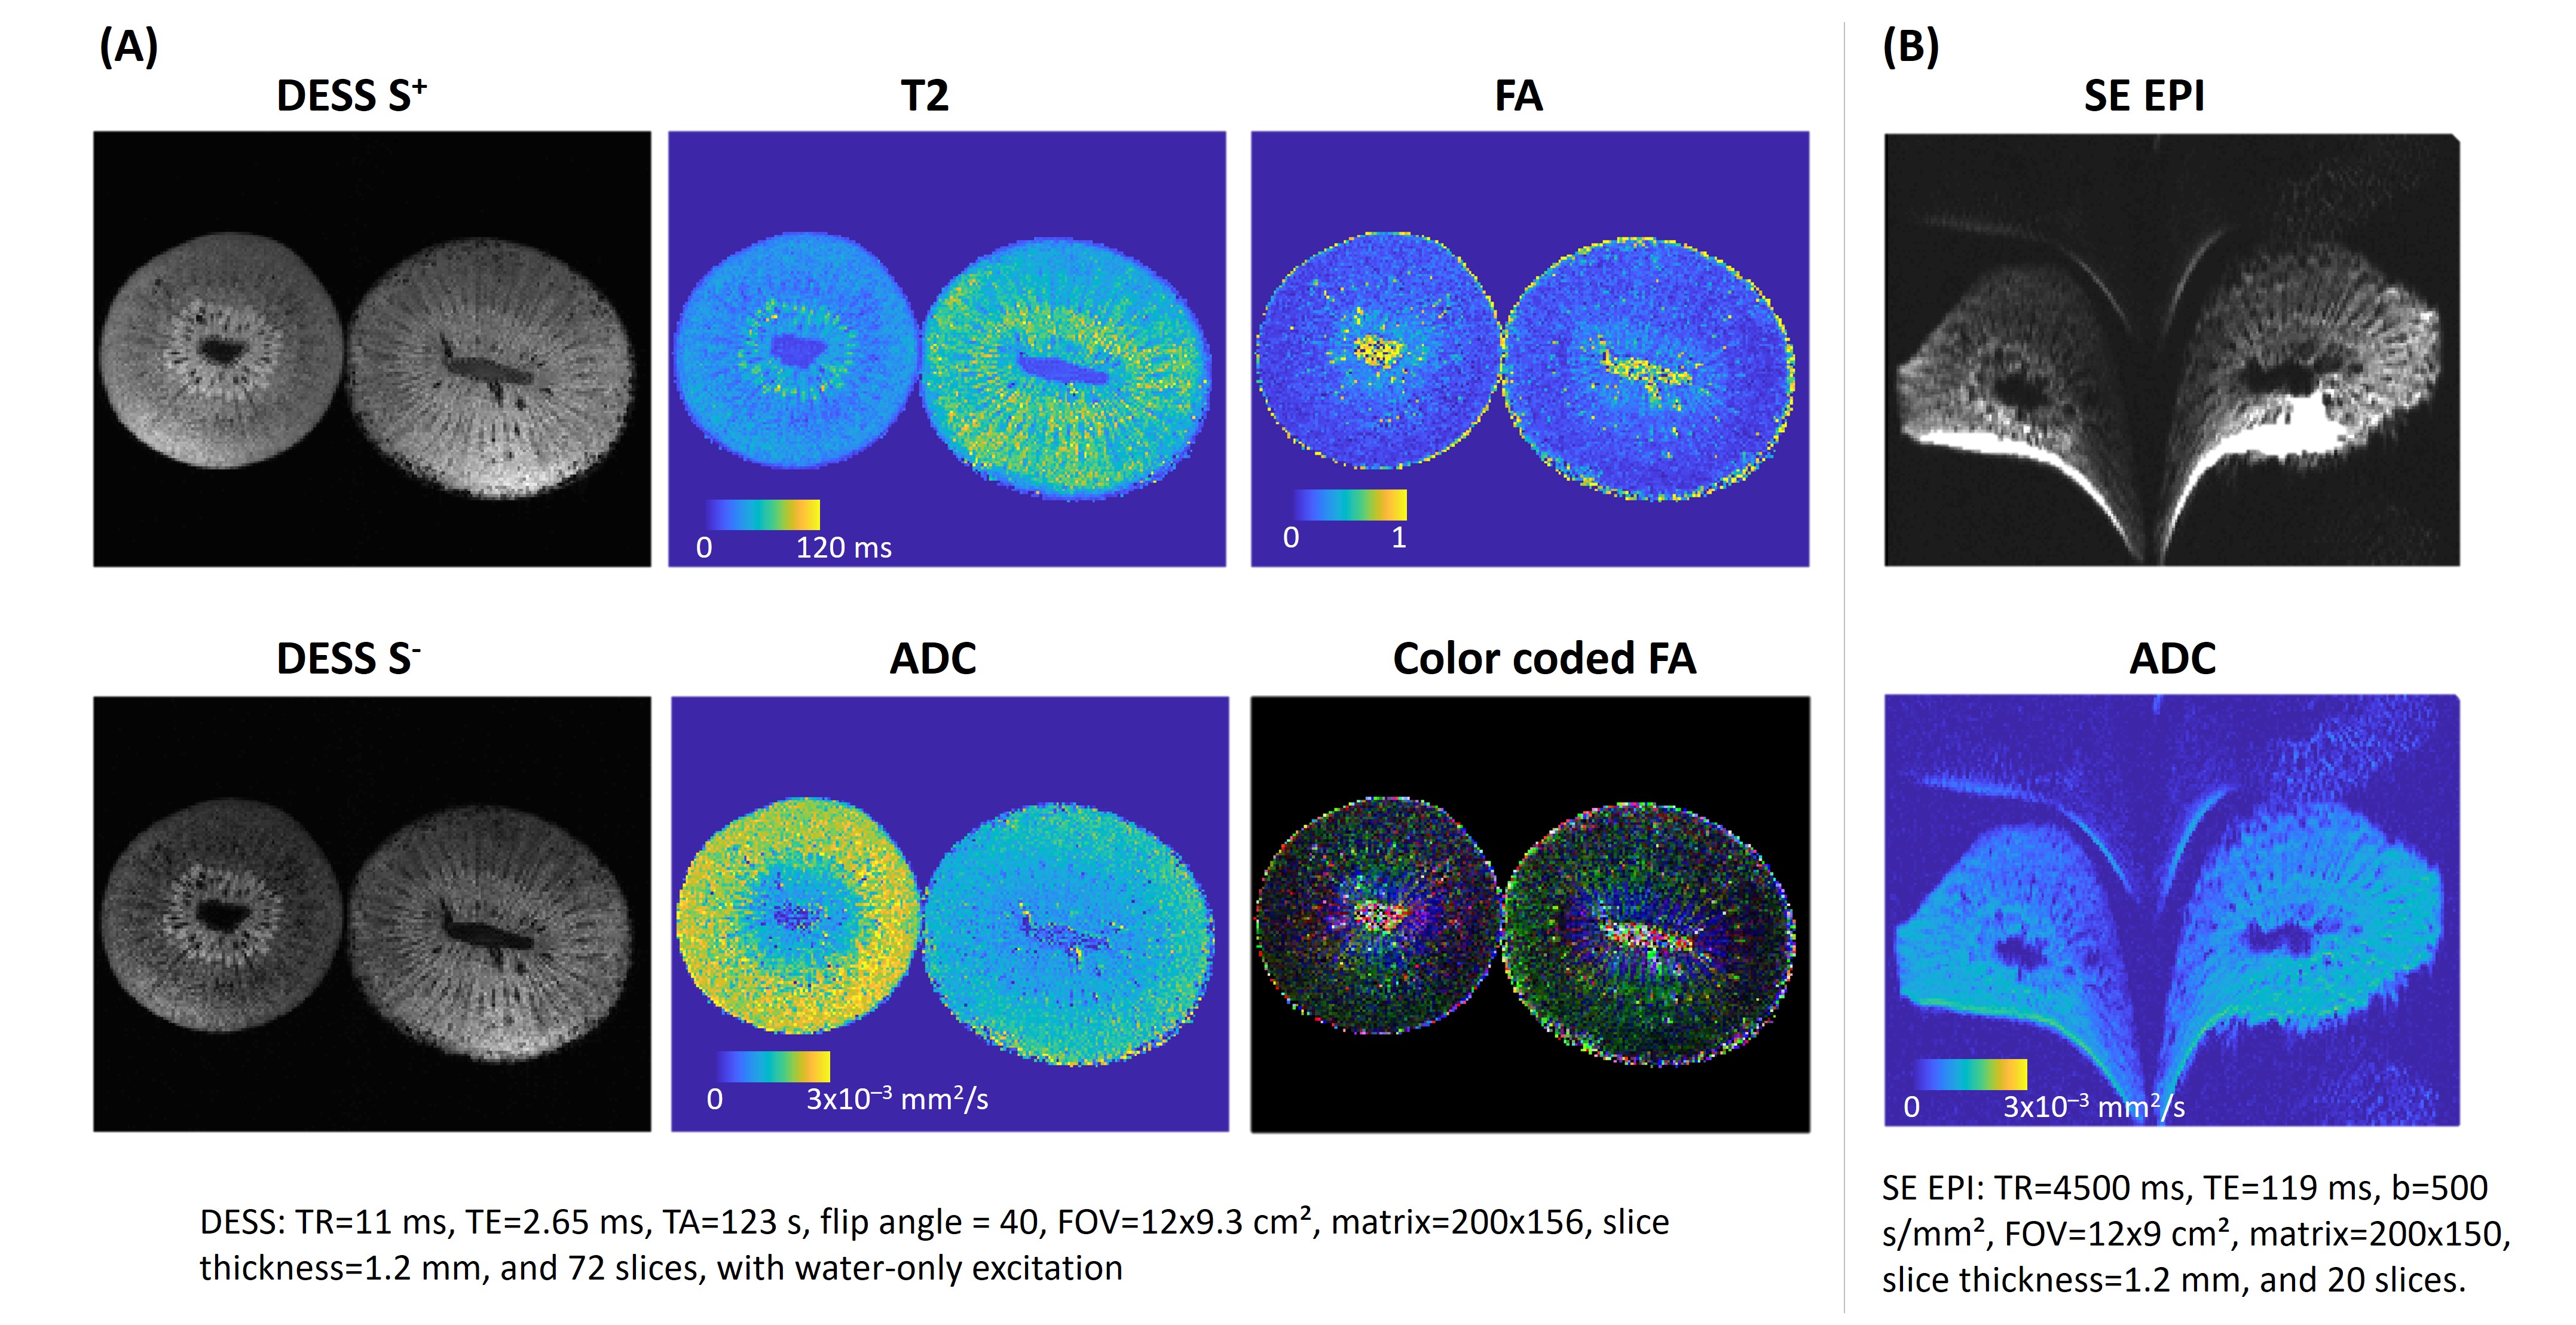
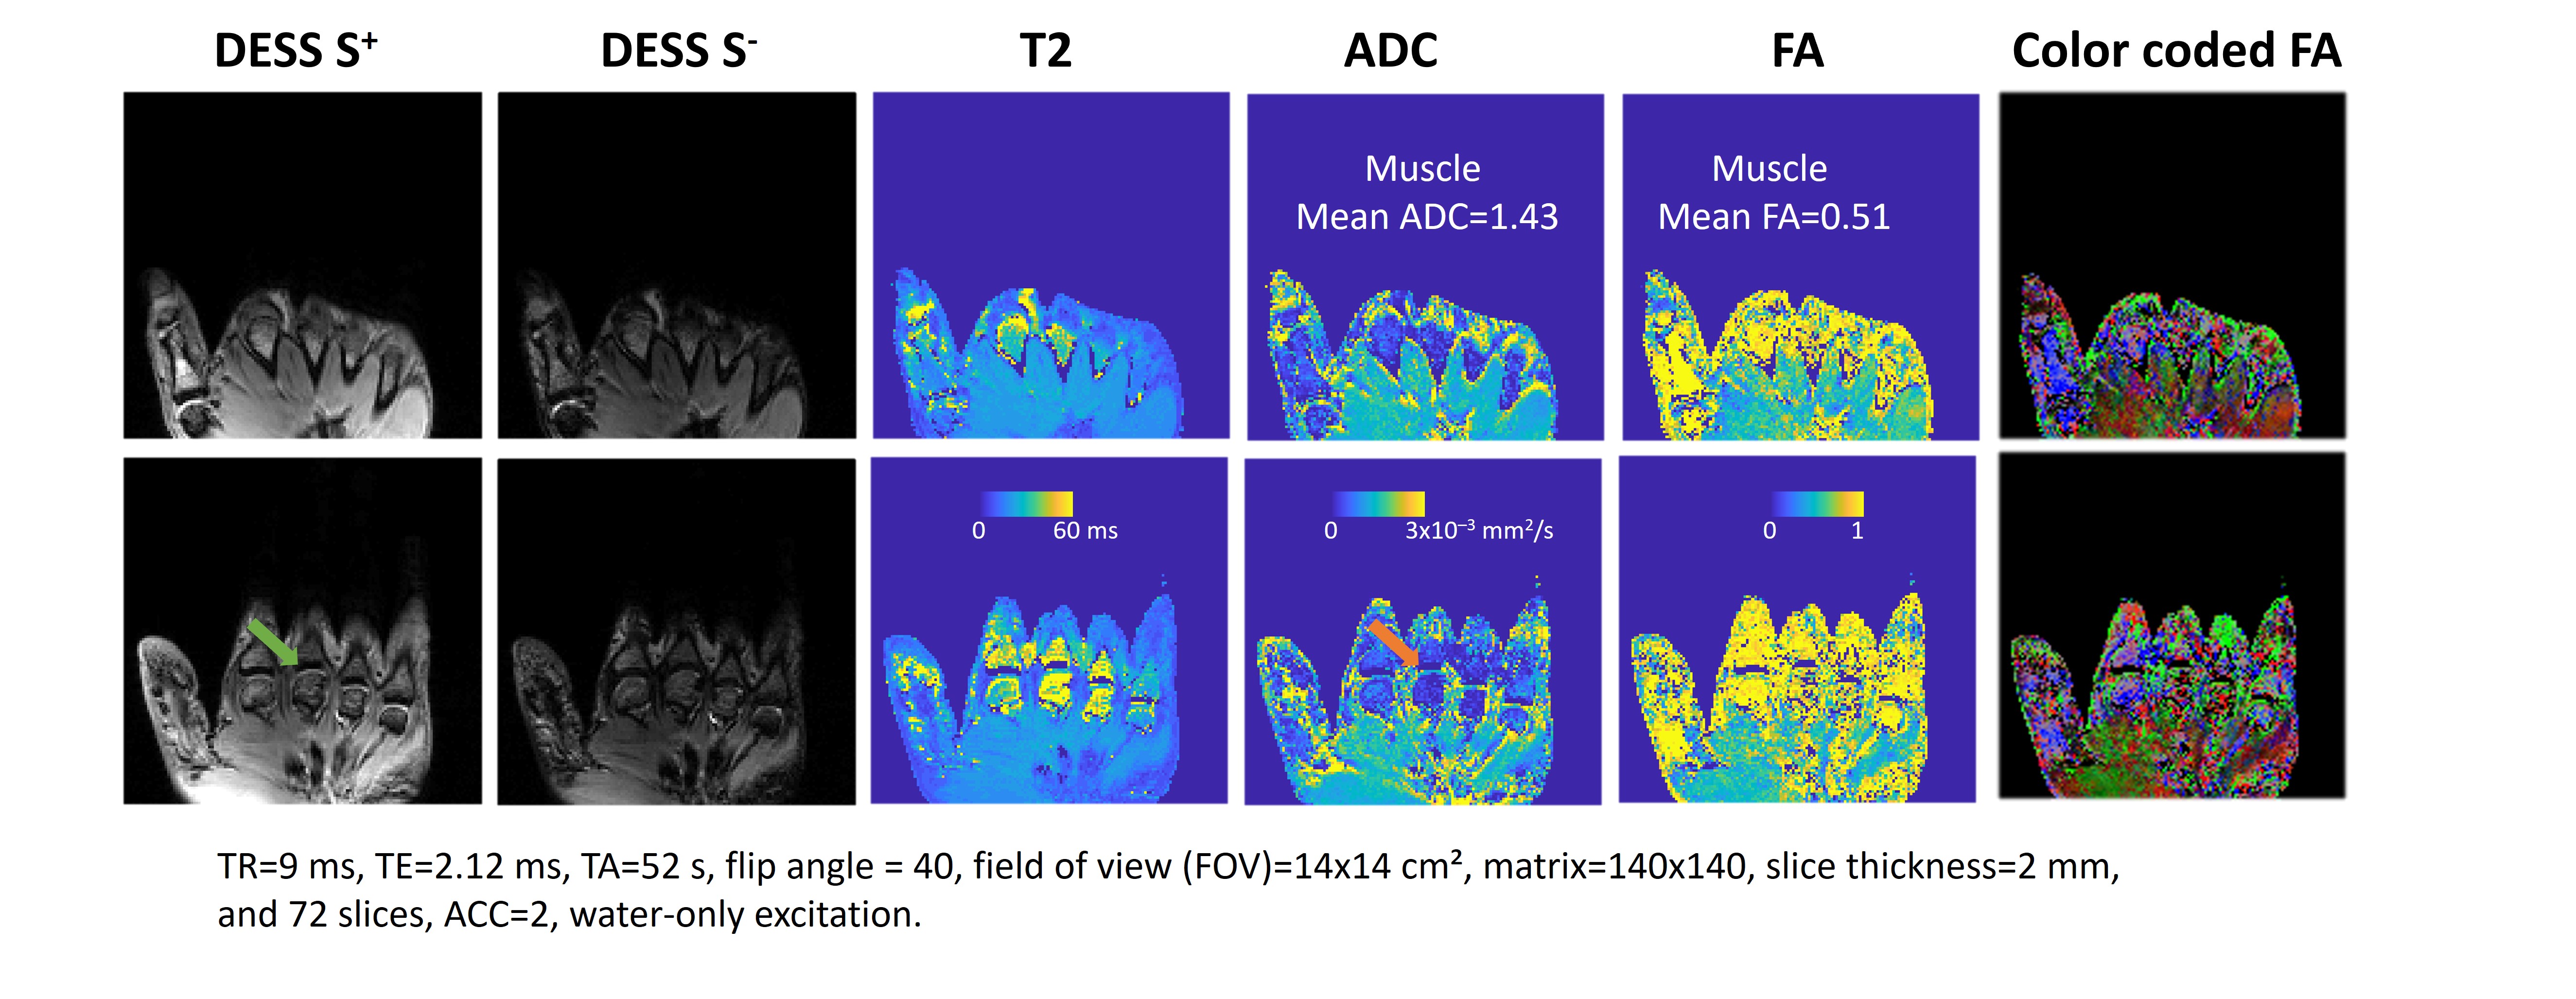
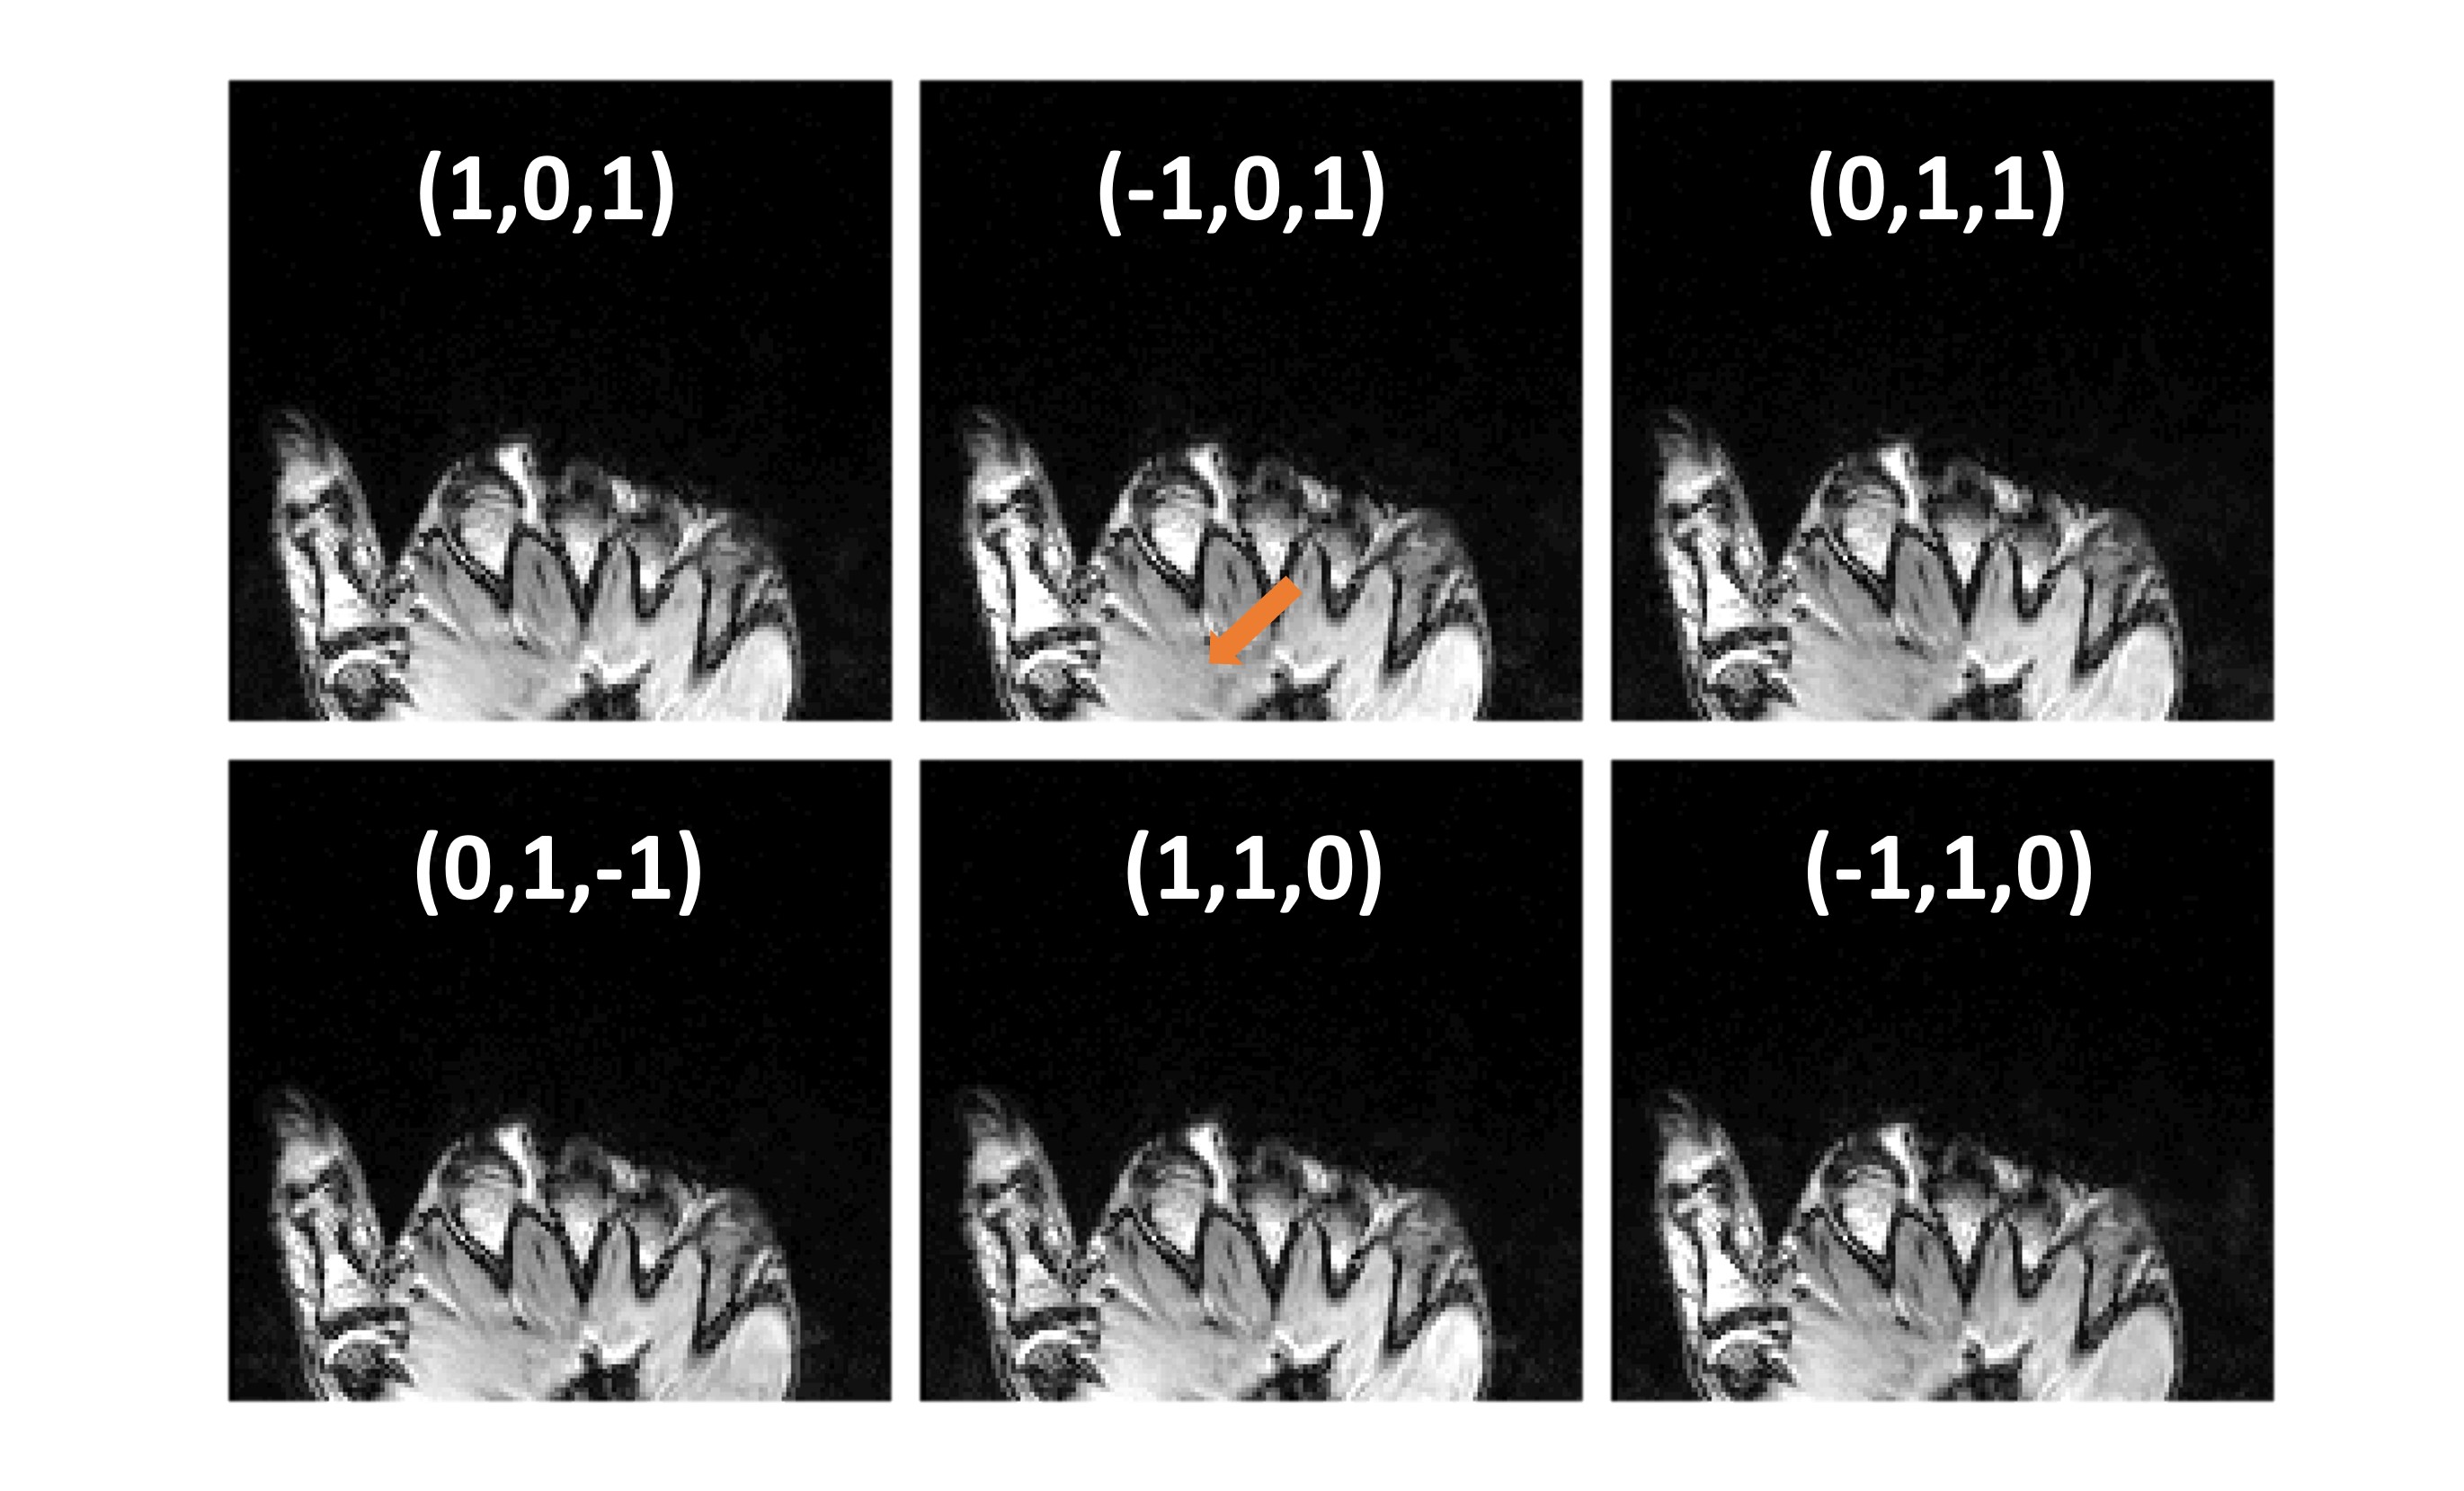
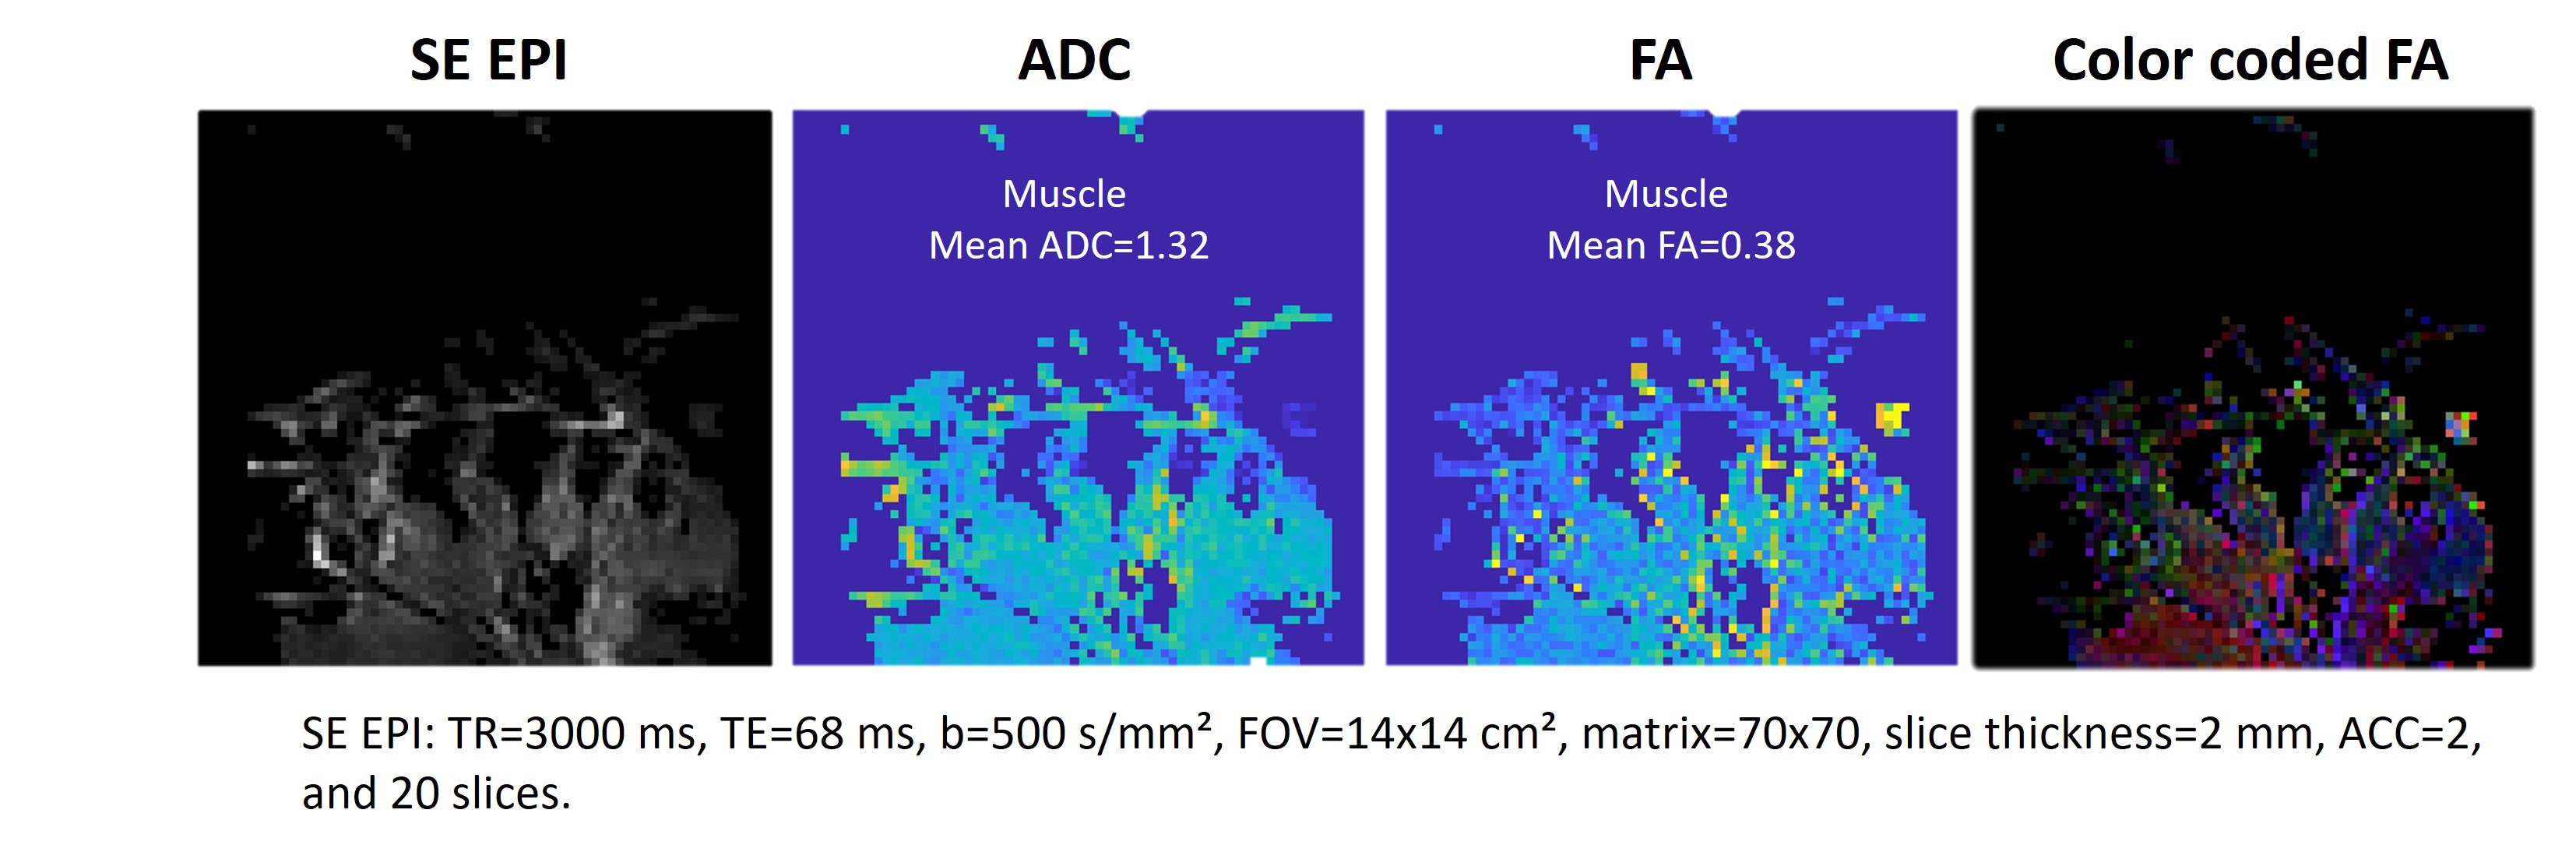
Figure 2A illustrates the DESS images of kiwi fruits. In comparison to the SE-EPI image (Figure 2B), the DESS image has high resolution without discernible distortion. Notably, the calculated FA map reveals elevated FA values in the central fibrous region, emphasizing the radially outward orientation of its fibers. However, the ADC values differ considerably between the two kiwi samples in the DESS images but remain similar in the SE-EPI diffusion data. Figure 3 presents two slices of the DESS images of the hand. The S- signal appears notably smaller than the S+ signal, indicating the presence of short T2 values in certain regions. Additionally, we can observe that the ADC value of cartilage can be estimated (highlighted by the orange arrow). The mean muscle ADC is measured at 1.43x10⁻³mm2/s, and the mean FA is calculated to be 0.51. Figure 4 displays the DESS images with varying directions of strong dephasing gradients, illustrating how muscle signal changes as different gradient directions (indicated by the orange arrow). In Figure 5, the hand diffusion imaging results using SE EPI are presented, showing strong distortion even at two times coarser resolution. The mean muscle ADC is calculated as 1.32x10⁻³mm2/s, with a mean FA of 0.38.Discussion and Conclusion
DW-DESS imaging successfully produced high-resolution T2 and ADC maps without any noticeable distortions. In addition to prior DW-DESS studies, we also calculated diffusion tensors and FA maps. This expansion posed challenges due to the method's inherent sensitivity to motion artifacts. To address this challenge, we harnessed SNR efficiency at the ultra-high field strength, rapidly acquiring six DW-DESS images as depicted in Figure 4, without any observable artifacts. Ensuring stable immobilization of the imaging region during the scan was a critical factor in our success. ADC and FA values obtained through DW-DESS are higher than those derived from conventional SE-EPI. This difference can be attributed to several factors, including the influence of compartments with varying T2 values7 and water diffusion constrained by cell membranes8. These factors render ADC values dependent on echo time and diffusion time. Acquiring high-resolution single-shot SE-EPI diffusion images at ultra-high field strengths is challenging, primarily due to the shorter T2 and increased off-resonance effects. This challenge is particularly evident in musculoskeletal hand imaging, characterized by its irregular shape and the production of pronounced off-resonance artifacts. In contrast, our utilization of DW-DESS convincingly demonstrated the feasibility of diffusion tensor imaging in hand imaging. Moreover, we anticipate that this approach may find broader applicability in various musculoskeletal clinical applications. The DW-DESS method holds the potential to offer advantages in diffusion imaging for ultra-high-field musculoskeletal applications.Acknowledgements
No acknowledgement found.References
- McMillan AB, Shi D, Pratt SJ, Lovering RM. Diffusion tensor MRI to assess damage in healthy and dystrophic skeletal muscle after lengthening contractions. BioMed Research International. 2011 Jan 1;2011.
- Miller KL, Hargreaves BA, Gold GE, Pauly JM. Steady-state diffusion-weighted imaging of in vivo knee cartilage. Magn Reson Med 2004; 51: 394–398.
- Granlund KL, Staroswiecki E, Alley MT, Daniel BL, Hargreaves BA. High-resolution, three-dimensional diffusion-weighted breast imaging using DESS. Magnetic resonance imaging. 2014 May 1;32(4):330-41.
- Staroswiecki E, Granlund KL, Alley MT, Gold GE, Hargreaves BA. Simultaneous estimation of T2 and apparent diffusion coefficient in human articular cartilage in vivo with a modified three‐dimensional double echo steady state (DESS) sequence at 3 T. Magnetic resonance in medicine. 2012 Apr;67(4):1086-96.
- Gras V, Farrher E, Grinberg F, Shah NJ. Diffusion‐weighted DESS protocol optimization for simultaneous mapping of the mean diffusivity, proton density and relaxation times at 3 Tesla. Magnetic resonance in medicine. 2017 Jul;78(1):130-41.
- Weigel M. Extended phase graphs: dephasing, RF pulses, and echoes‐pure and simple. Journal of Magnetic Resonance Imaging. 2015 Feb;41(2):266-95.
- Wang S, Peng Y, Medved M, Yousuf AN, Ivancevic MK, Karademir I, Jiang Y, Antic T, Sammet S, Oto A, Karczmar GS. Hybrid multidimensional T2 and diffusion‐weighted MRI for prostate cancer detection. Journal of Magnetic Resonance Imaging. 2014 Apr;39(4):781-8.
- Novikov DS, Fieremans E, Jespersen SN, Kiselev VG. Quantifying brain microstructure with diffusion MRI: Theory and parameter estimation. NMR in Biomedicine. 2019 Apr;32(4):e3998.
Figures