4568
Improved Saturation Recovery-based Water-Specific T1 (T1W) Mapping1Department of Radiology, University of Wisconsin-Madison, Madison, Wisconsin, USA, University of Wisconsin-Madison, Madison, WI, United States, 2Department of Medical Physics, University of Wisconsin-Madison, Madison, Wisconsin, USA, University of Wisconsin-Madison, Madison, WI, United States, 3Department of Biomedical Engineering, University of Wisconsin-Madison, Madison, Wisconsin, USA, University of Wisconsin-Madison, Madison, WI, United States, 4Mazankowski Alberta Heart Institute, University of Alberta, Alberta, AB, Canada, 5Department of Biomedical Engineering, University of Alberta, Edmonton, AB, Canada, Alberta, AB, Canada, 6Department of Electrical and Computer Engineering, University of Wisconsin-Madison, Madison, Wisconsin, USA, University of Wisconsin-Madison, Madison, WI, United States, 7Department of Medicine, University of Wisconsin-Madison, Madison, Wisconsin, USA, University of Wisconsin-Madison, Madison, WI, United States, 8Department of Emergency Medicine, University of Wisconsin-Madison, Madison, Wisconsin, USA, University of Wisconsin-Madison, Madison, WI, United States
Synopsis
Keywords: Pulse Sequence Design, Quantitative Imaging
Motivation: T1 mapping is a promising biomarker of various chronic diseases, yet existing methods of T1 mapping suffer from high variability.
Goal(s): Improve the overall performance of water-specific T1 (T1W) estimation with a rapid sequence for feasible implementation in body applications.
Approach: Design and implement a multi-echo chemical shift-encoded MRI sequence with an optimized preparation pulse, optimized flip angle-modulation readout scheme, centric encoding, and joint parameter estimation to improve the performance of T1W estimation.
Results: We successfully implemented the proposed sequence on an MRI system and demonstrated its feasibility for T1W mapping in the body.
Impact: The proposed approach to chemical shift-encoded T1 mapping improves the overall performance of T1W estimation in the presence of confounding factors. By showing robustness to confounding factors, this helps improve T1 mapping as a clinically viable diagnostic tool.
Introduction
T1 mapping describes a family of quantitative MRI methods used to produce a voxel-wise maps of tissue T1 relaxation times. Many studies in recent years have demonstrated the usefulness of T1 measurement in noninvasively identifying and quantifying fibrosis in both the heart [1] and body [2,3].Prior work by Thompson et al. describes a water-specific T1 (T1W) mapping method using a saturation-prepared acquisition scheme. In this approach, fat-water separation is performed sequentially on each saturation time image, and the water component is fit to a T1 recovery curve5. Despite promising performance, further optimization is needed for both acquisition and parameter map reconstruction. The purpose of this work is to improve the performance of saturation recovery-based T1W estimation using a chemical shift-encoded (CSE) acquisition scheme with (1) centric k-space encoding, (2) optimized flip angle scheme, and (3) joint parameter estimation multi-echo signal acquired at multiple saturation times.
Theory
The saturation-prepared signal from a voxel containing water and fat can be modeled as follows for a given echo time (TE) and saturation time (TS):$$S(TE, TS) = \left[W(1-e^{-\frac{TS}{T1_W}}) + F(1-e^{-\frac{TS}{T1_F}}) \Sigma^{6}_{k=1} \alpha_k e^{i2\pi f_k TE} \right] e^{-R_2* TE} e^{i2 \pi \phi TE} $$
where W and F represent the complex water and fat signals and T1W and T1F represent T1 of water and fat. Fat is modeled with a six-peak spectral model [6]. Common T2* relaxation of the water and fat signals I assumed [7]. In the prior work [5], T1W was estimated by separating water and fat, followed by fitting T1w, termed sequential fitting. We propose a single non-linear fit, termed joint fitting. Through simultaneous estimation, we enforce a common PDFF and R2* estimate , reducing the degrees of freedom and improving SNR performance.
Methods
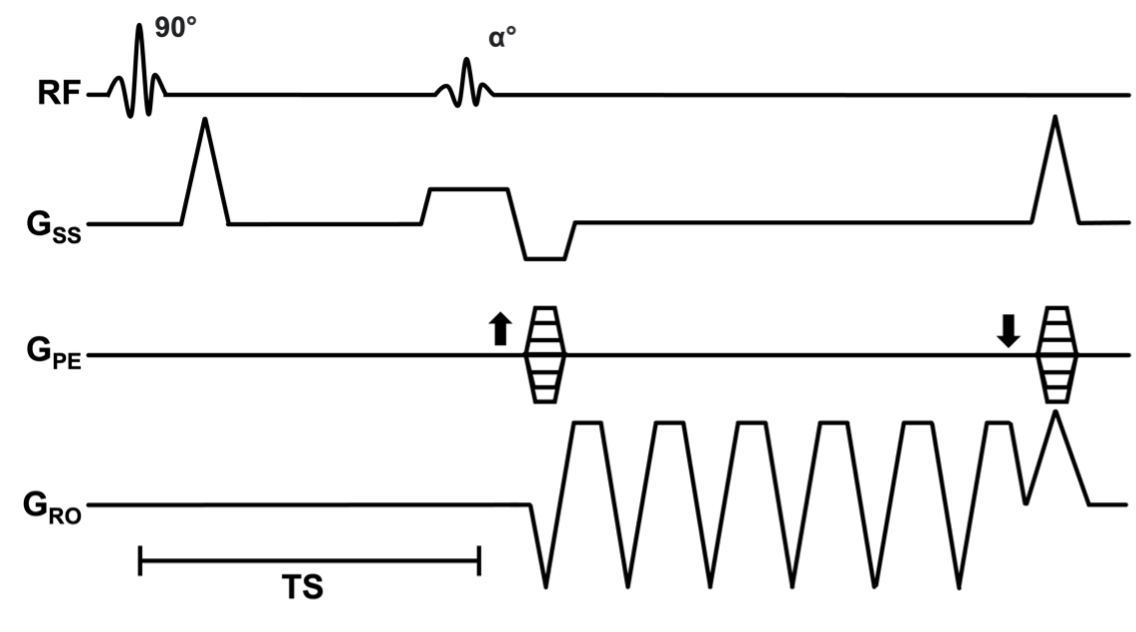
Data AcquisitionA schematic of the proposed acquisition is shown (Figure 1). The 90º preparation is a six-pulse composite pulse for uniform saturation at 3.0 T [8]. Six echoes are acquired using flyback gradients for PDFF and R2* estimation Four saturation-prepared images are acquired with increasing TS, the time between the end of the saturation pulse and center of k-space.
K-space data are acquired using centric encoding and an optimized flip angle-modulation (FAM) scheme [9]. The centric-FAM scheme maximizes SNR while minimizing T1 bias and blurring in the phase encoding direction [9, 10].
Simulation
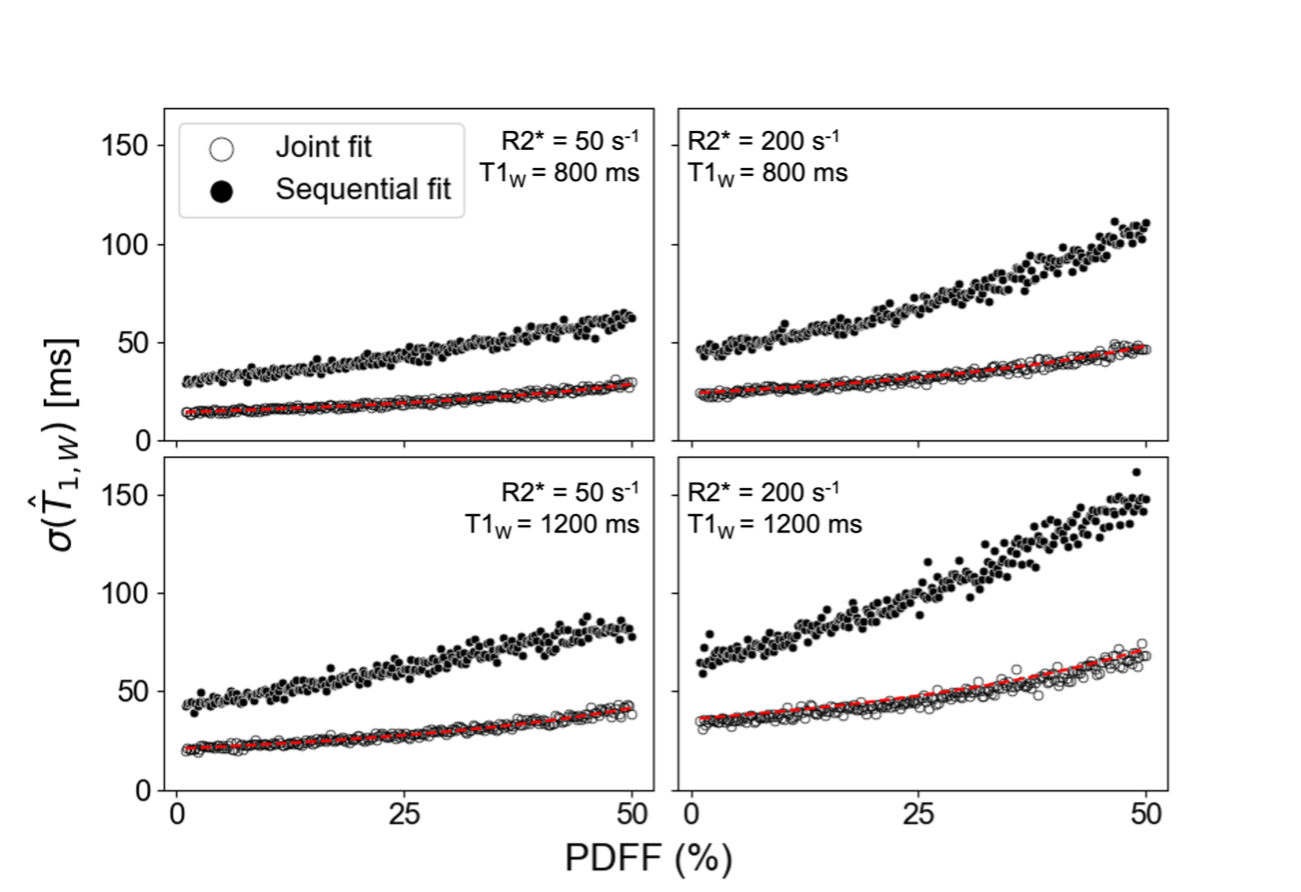
Simulations were performed to assess SNR performance of the proposed joint fitting strategy in comparison to sequential fitting, comparison of the T1W variance for the two reconstruction methods, simulated over a range of PDFF [0%,50%] with T1W=800ms or 1200ms and R2*=50s-1 or 200s-1. 300 signal evolutions were generated with additive complex Gaussian noise. The lower bound on the expected variance of T1W was also calculated using the Cramér–Rao bound [11].
Phantom
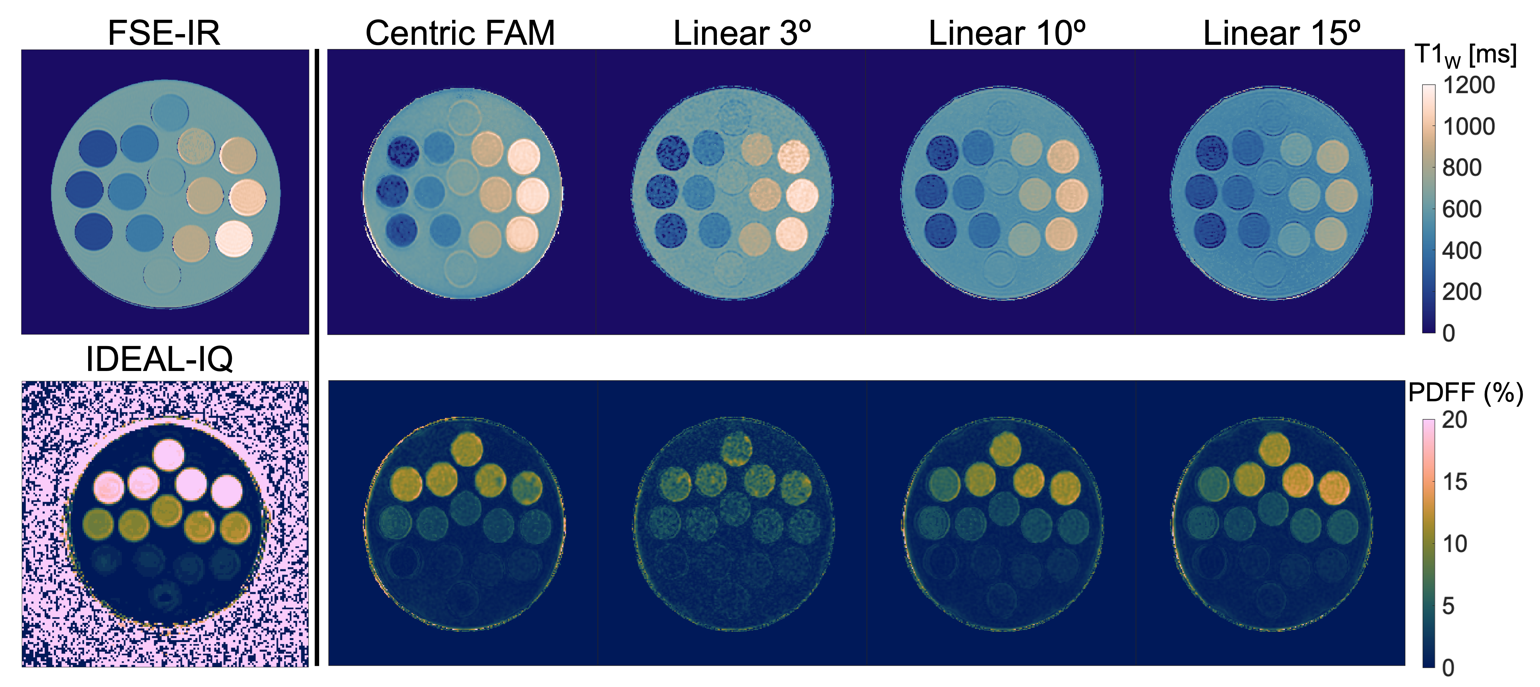
Data were acquired in a spherical agar-gel phantom on a 3.0T clinical MR system (Signa Premier, GE HealthCare) using a 48-channel head coil. Peanut oil and NiCl2 were used to modulate PDFF (0-20%) and water-specific T1 relaxation (200-1000 msec) in the phantom. Imaging parameters included: FOV=220x220mm2, resolution=0.9x0.9mm2, slice thickness=5.0mm, TR=13.2ms, nTE/∆TE/TE0=6/1.42ms/1.10ms, nTS/∆TS/ TS0=4/300ms/1200ms. Total acquisition time was 11s for one slice. Linearly-encoded acquisitions were also performed using flip angles of 3º, 10º, and 15º for comparison.
2D-IR-SE data were acquired to provide reference T1 maps12. 3D-CSE-MRI (IDEAL-IQ, GE HealthCare) data were acquired for reference PDFF maps. Acquisition parameters for 2D-IR-SE acquisitions included: FOV=200x200mm2, resolution=0.4x0.4mm2, slice thickness=5.0mm, TR/TE=2550/14ms. Acquisition parameters for 3D CSE-MRI included: FOV=400x320mm2, resolution=0.4x0.4mm2, slice thickness=8.0mm, TR=6.4ms, and nTE/∆TE/ TE0=6/0.78ms/0.97ms.
In-vivo acquisition
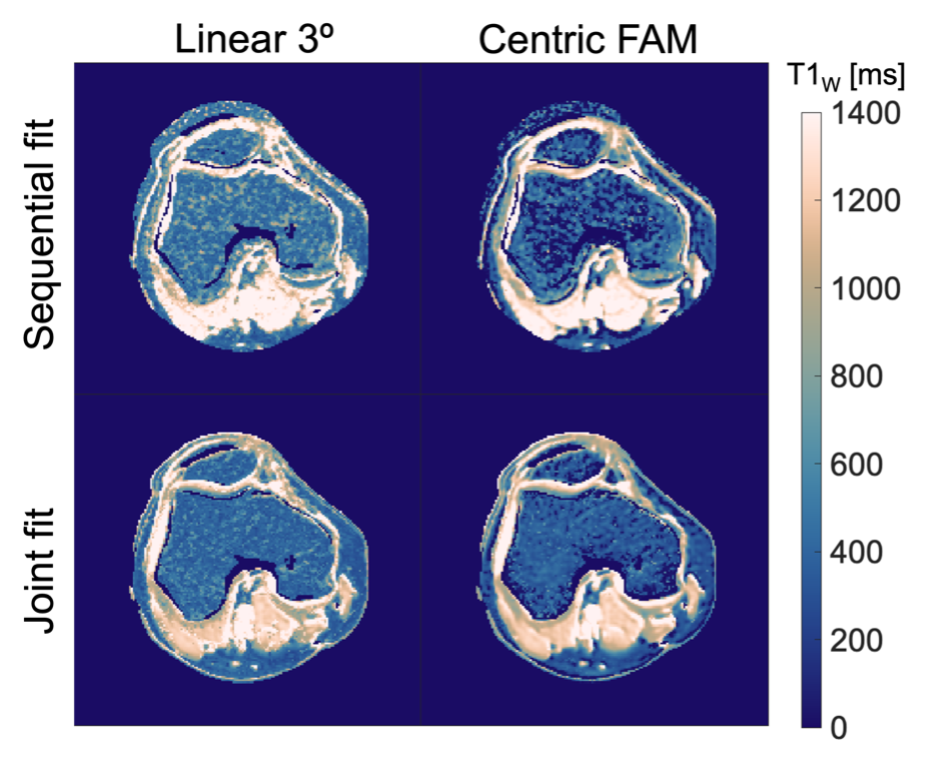
Saturation-prepared CSE-MRI data were acquired in the knee of one volunteer using an 18-channel knee coil. Imaging parameters included: FOV=220x220mm2, resolution=0.9x0.9mm2, TR=13.2ms, nTE/∆TE/TE0=6/1.42ms/1.10ms, nTS/∆TS/ TS0=4/300ms/1200ms. Reference saturation-prepared CSE-MRI data were also acquired using a linear-encoded, with a 3º flip angle, for comparison.
Results
Joint fitting demonstrated reduced T1W estimation variability across all simulated parameters compared to the prior sequential fitting method (Figure 2).T1W estimation generally showed good agreement with reference methods (Figure 3).
Figure 4 shows T1w maps acquired in the knee using the proposed acquisition and low flip angle linear encoding, both reconstructed with the proposed joint fitting reconstruction and sequential reconstructive algorithms. A visible improvement in variability of the reconstructed T1w maps is noted with the proposed acquisition and reconstruction methods.
Discussion
We have successfully demonstrated an improved approach for a rapid saturation recovery-based water-specific T1 mapping approach using a flip-angle modulated centric k-space encoding with joint parameter reconstruction.Acknowledgements
We wish to acknowledge support from GE Healthcare who provides research support to the University of Wisconsin. We wish to acknowledge support from the University of Wisconsin-Madison Office of the Vice Chancellor for Research and Graduate Education with funding from the Wisconsin Alumni Research Foundation, as well as from the UW Departments of Radiology and Medical Physics. Jiayi Tang is a shareholder of GE HealthCare. Dr. Reeder is the John H. Juhl Endowed Chair of Radiology.This material is based upon work supported by the National Science Foundation Graduate Research Fellowship Program under Grant No. DGE-2137424. Any opinions, findings, and conclusions or recommendations expressed in this material are those of the author(s) and do not necessarily reflect the views of the National Science Foundation.References
1. Puntmann VO, Peker E, Chandrashekhar Y, Nagel E. T1 Mapping in Characterizing Myocardial Disease. Circulation Research. 2016; 119(2):277–299.2. Fellner C, Nickel MD, Kannengiesser S, et al. Water–Fat Separated T1 Mapping in the Liver and Correlation to Hepatic Fat Fraction. Diagnostics. 2023; 13(2):201.3. Breit HC, Block KT, Winkel DJ, et al. Evaluation of liver fibrosis and cirrhosis on the basis of quantitative T1 mapping: Are acute inflammation, age and liver volume confounding factors? European Journal of Radiology. 2021; 141:109789.4. Stikov N, Boudreau M, Levesque IR, Tardif CL, Barral JK, Pike GB. On the accuracy of T1 mapping: Searching for common ground. Magnetic Resonance in Medicine. 2015; 73(2):514–522.5. Thompson RB, Chow K, Mager D, Pagano JJ, Grenier J. Simultaneous proton density fat‐fraction and imaging with water‐specific T 1 mapping (PROFIT 1): application in liver. Magn Reson Med. 2021; 85(1):223–238.6. Yu H, Shimakawa A, McKenzie CA, Brodsky E, Brittain JH, Reeder SB. Multiecho water-fat separation and simultaneous R2* estimation with multifrequency fat spectrum modeling. Magn Reson Med. 2008; 60(5):1122–1134.7. Reeder SB, Bice EK, Yu H, Hernando D, Pineda AR. On the performance of T2* correction methods for quantification of hepatic fat content. Magn Reson Med. 2012; 67(2):389–404.8. Chow K, Kellman P, Spottiswoode BS, et al. Saturation pulse design for quantitative myocardial T1 mapping. J Cardiovasc Magn Reson. 2015; 17(1):84.9. Zhao R, Zhang Y, Wang X, et al. Motion‐robust, high‐SNR liver fat quantification using a 2D sequential acquisition with a variable flip angle approach. Magn Reson Med. 2020; 84(4):2004–2017.10. Starekova J, Zhao R, Colgan TJ, et al. Improved free-breathing liver fat and iron quantification using a 2D chemical shift–encoded MRI with flip angle modulation and motion-corrected averaging. Eur Radiol. 2022; 32(8):5458–5467.11. Scharf LL, McWhorter LT. Geometry of the Cramer-Rao bound. Signal Processing. .12. Barral JK, Gudmundson E, Stikov N, Etezadi-Amoli M, Stoica P, Nishimura DG. A Robust Methodology for In Vivo T1 Mapping. Magn Reson Med. 2010; 64(4):1057–1067.Figures