4559
Quantitative differences in the heart habitus between breath-hold and free-breathing states, measured using a 3D survey in cardiac patients1Philips India Limited, Bengaluru, India, 2Narayana Hrudayalaya, Bengaluru, India
Synopsis
Keywords: Data Acquisition, Heart, Cardiac MRI planning
Motivation: Quantitative understanding of the differences in the heart’s habitus (position, orientation and size) between free-breathing (FB) and breath-hold (BH) mode of cardiac MR imaging (CMR) is lacking.
Goal(s): To quantitatively measure the differences in the heart’s position, orientation and size between free-breathing and breath-hold mode in cardiac patients
Approach: Used an accelerated 3D GRE survey, acquired in BH (cardiac gated) and FB modes (cardiac and respiratory gated) in a large cohort of cardiac patients and quantified the location, orientation and size differences.
Results: We find that quantitatively heart’s habitus differs significantly, in all three factors, between the two modes of imaging.
Impact: We have, for the first time, quantified the extent to which the heart’s habitus (position, orientation and size) changes between breath-hold and free-breathing modes of Cardiac MRI (CMR). CMRI planning, whether manual or AI based, needs to account for this.
Background
Automated/semi-automated planning for magnetic resonance imaging (MRI) examinations is a growing clinical need to reduce technologists workload [(1–5)]. This has been especially true for cardiac MRI (CMR) examinations, which require considerable technologist’s expertise, owing to the complex geometry of the heart, often requiring double-oblique planning for the clinically relevant cardiac planes. Conventional surveys/scouts that help plan CMR scans are 2 dimensional (2D) and are obtained while patients hold their breath (breath-hold condition). To improve patient compliance with CMR, there is increasing interest in imaging under free-breathing conditions. Currently, some scans are obtained during breath hold (BH) and others during free breathing (FB). Accurate planning of cardiac imaging planes between FB and BH states can be challenging. Understanding the quantitative differences in heart habitus between the two modes can help speed and more accurately plan CMR examinations. In this study, we quantitatively evaluate these differences using a 3D survey acquired in both FB and BH modes in a large cohort of patients undergoing CMR examination.Materials and Methods
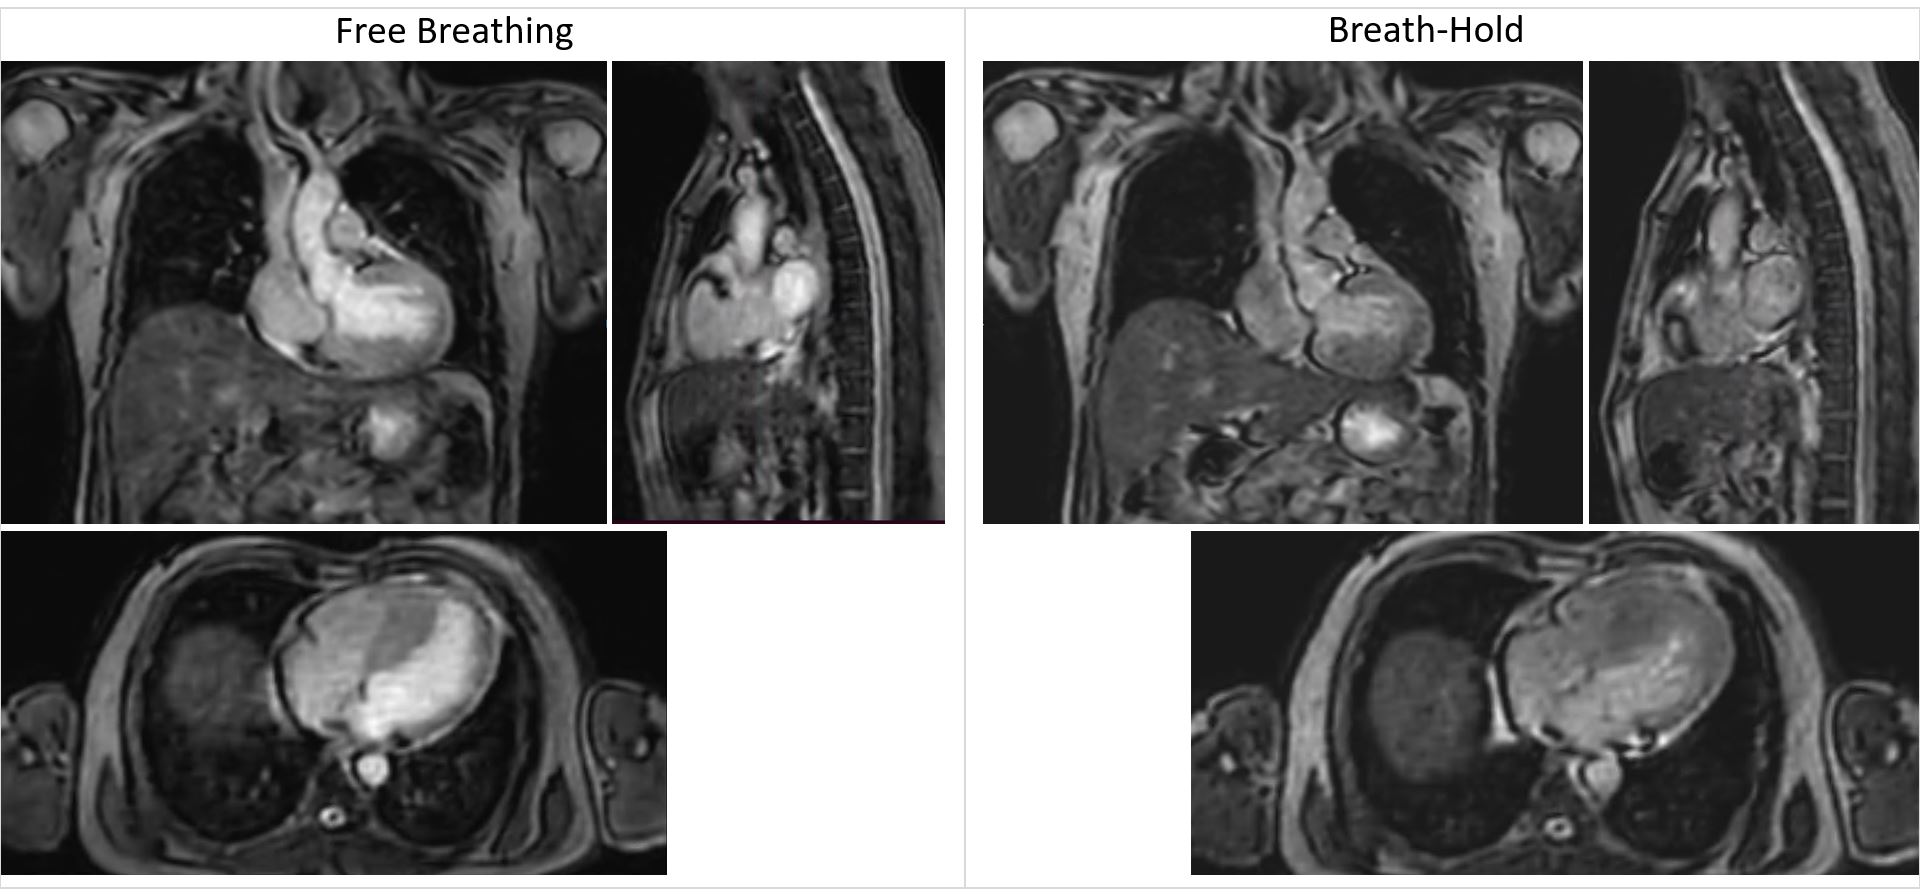
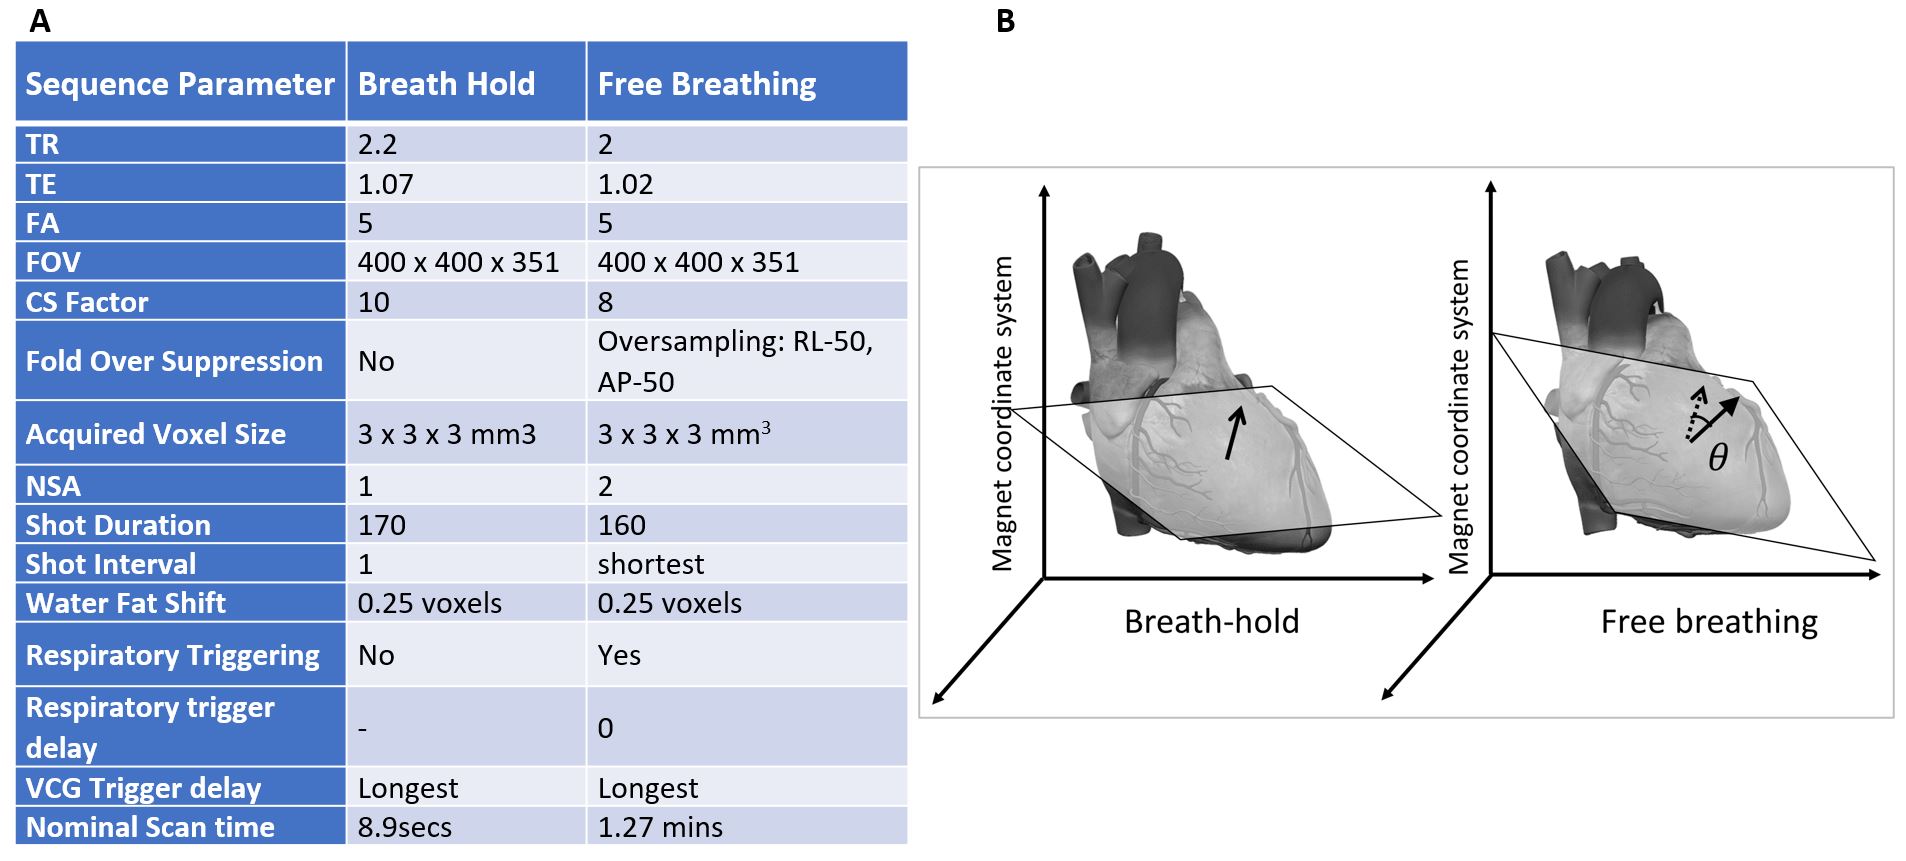
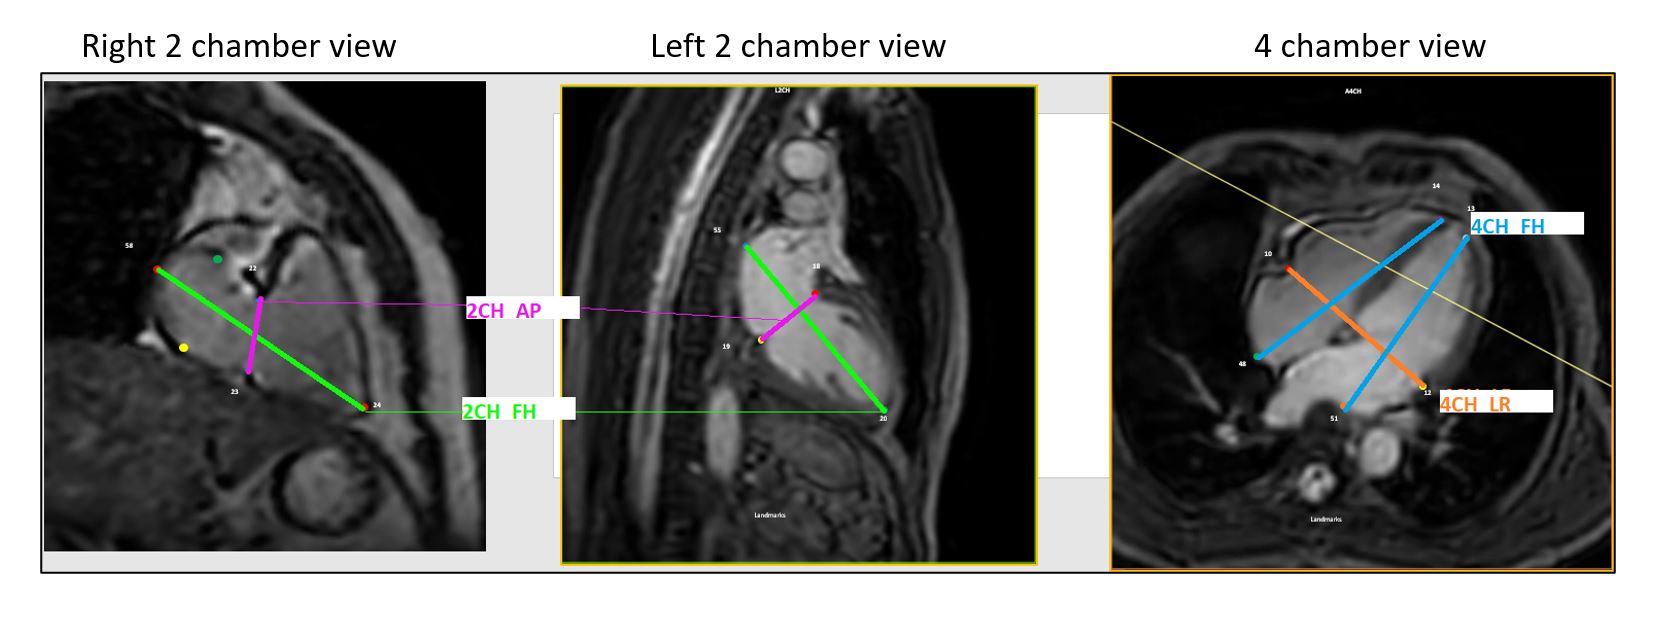
All CMR studies were performed on a Philips Ingenia 3.0T system (Best, NL). Three-dimensional cardiac surveys were obtained in FB and BH states in all adult patients undergoing clinically indicated CMR examination (Figure 1). Respiratory triggering was on end expiration and BH instruction was also typically on end expiration but modulated based on patient compliance/comfort. Imaging parameters for the 3D survey are provided in Figure 2A. Both BH and FB 3D surveys were evaluated by an experienced CMR technologist (>12 yrs of experience), for differences in a) orientation; b) location; and c) size of the heart. Orientation of the heart was evaluated by calculating the vector angle between the vectors normal-to-the axial-plane of the heart (4 Chamber view) in the BH and FB surveys (Figure 2B). The coordinates of the geometric centre of the heart, relative to the magnet coordinate system, were used to evaluate the vector distance between the location of the heart in BH and FB. Size of the heart was evaluated through its volume measure, which was obtained by approximating the heart as an elliptical cone. Volume was computed using 1/3 x pi x a x b x c relation where, the length from apex-to-top of the atria as major axis, a, the depth, c , was taken as half the width of the heart in the left and right 2 chamber views (max of the two) and width of the heart, b, was measured as ½ of the width seen in 4 chamber view as shown Figure 3.Results
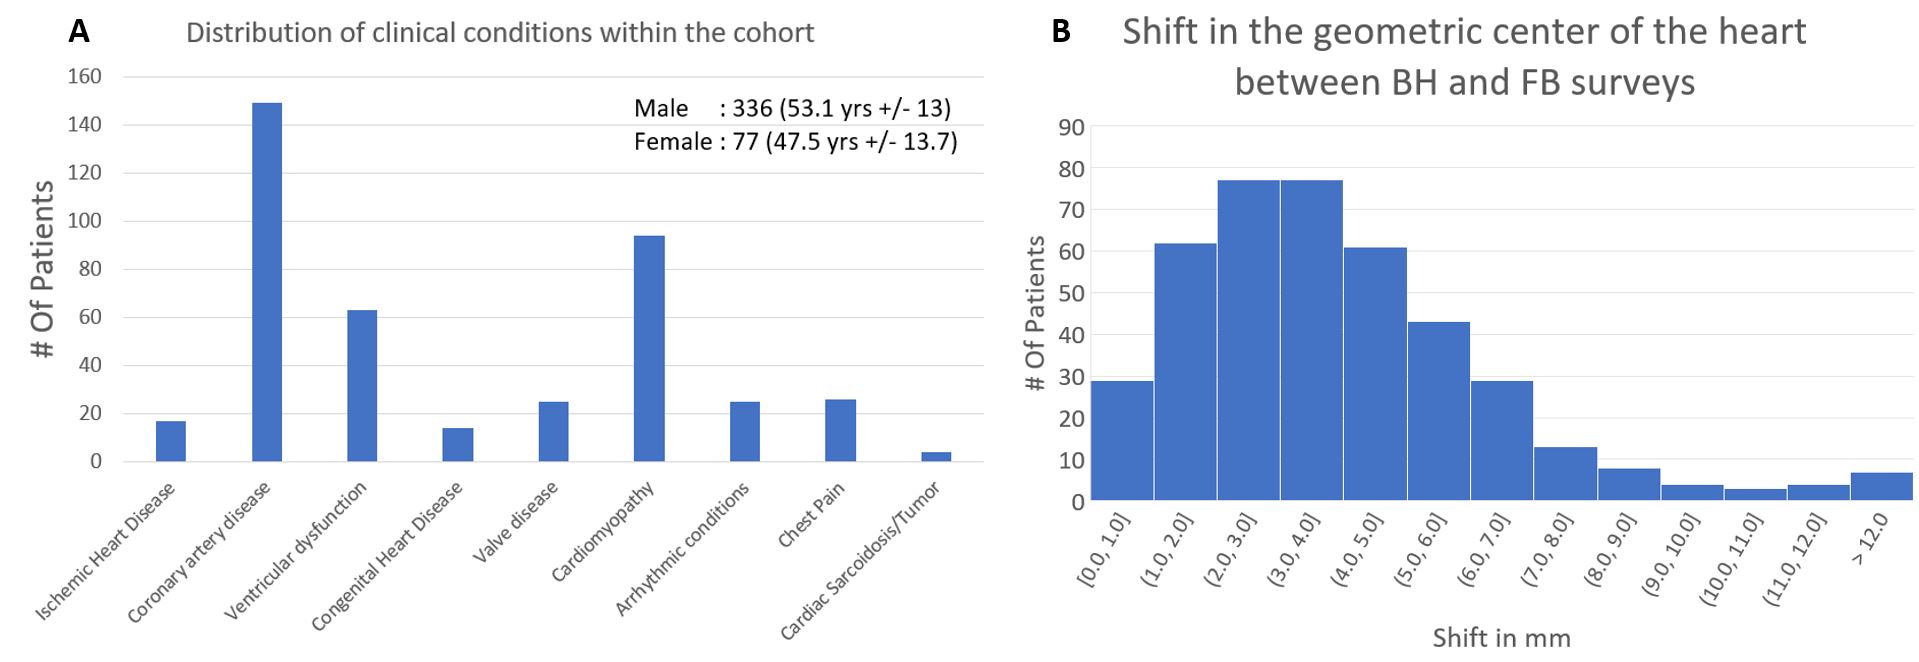
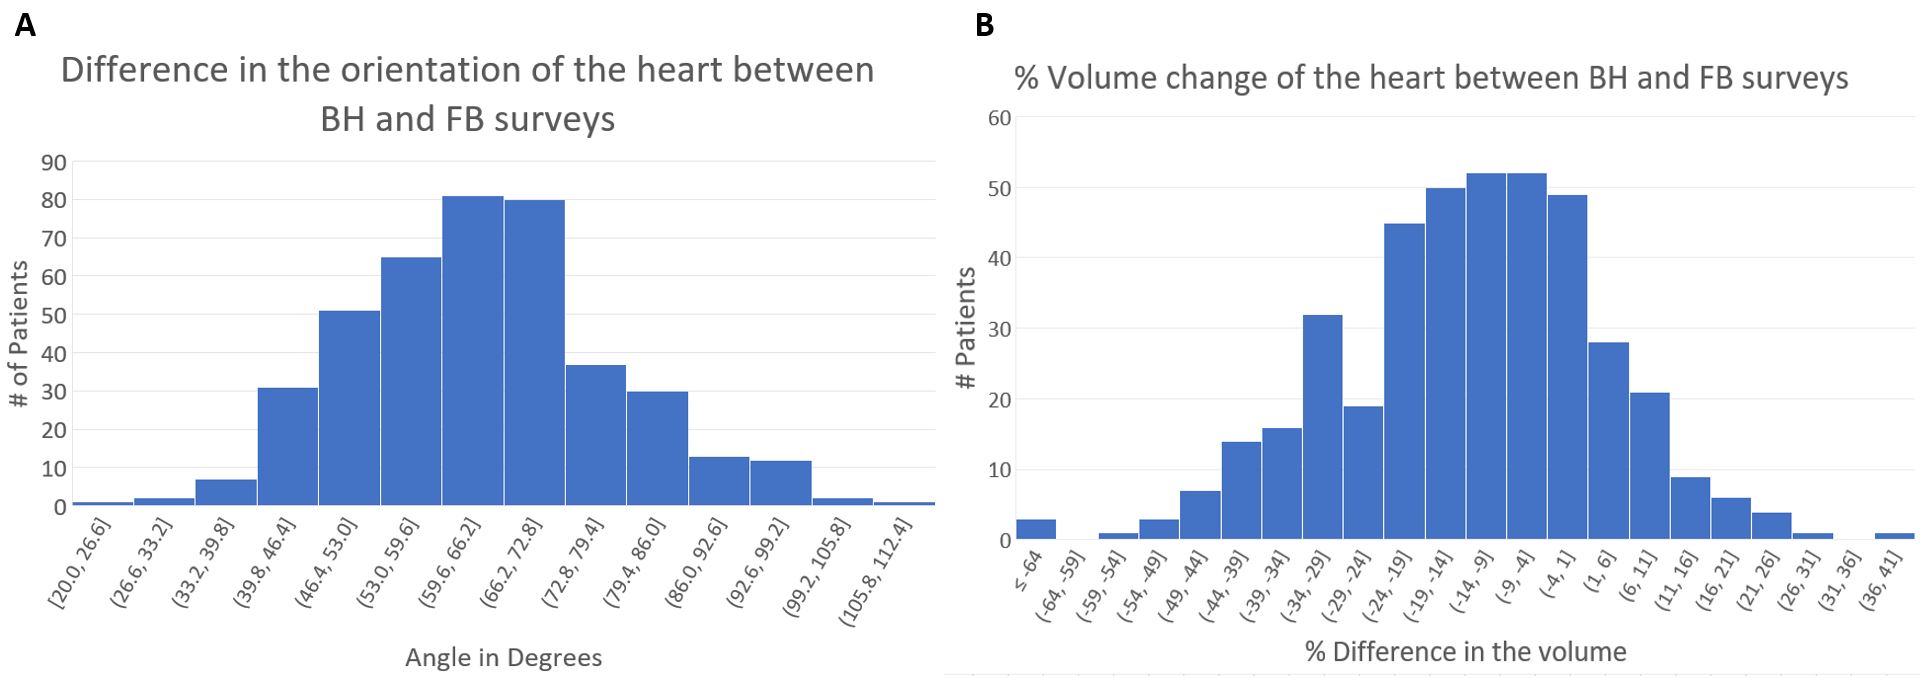
A total of 413 patients underwent CMR examinations during the study period. The age, gender distribution, and clinical profile of the patients are shown in Figure 4A. There was a difference in heart size and orientation between the FB and BH surveys (Figure 1). Across the cohort, the center of the heart is seen to be shifted by about 4 +/- 2mm between FB and BH. The histogram of the shift across the group is shown in Figure 4B. The orientation of the heart also is seen to differ by 64o +/- 14o degrees between BH and FB. Figure 5A shows the histogram of the orientation change, i.e., vector angle between the true axial of the heart in BH and FB modes. Additionally, a significant difference of -13.7 +/- 16.9 %, was observed in the volume of the heart in FB survey, relative to BH survey (Figure 5B).Discussion and Conclusion
We have quantitatively evaluated the differences in the heart’s habitus in BH and FB modes in patients with cardiac ailments. We see that the heart can shift by about 4mm +/- 2mm between the two modes, along with an average tilt of 63o +/- 14o degrees. Although it has been conventionally known that the heart habitus changes between the FB and BH modes, this is the first report, to our knowledge, that has quantified these differences. We also observe that the volume of the heart changes between the two modes. This may partly be due to capturing of a slightly different cardiac phase between the two modes, or slight variation in the respiratory phase captured in different patients. Nevertheless, practically, this needs also to be kept in mind, for example when considering the setting of the Field of View (FOV) for small FOV imaging. In conclusion, quantitative knowledge of how the heart position and orientation changes between BH and FB modes, can better help cardiac technologists to plan CMR examinations. This data can also help improve the planning of automated planning solutions.Acknowledgements
No acknowledgement found.References
1. Fenchel M, Thesen S, Schilling A. Fully automatic liver scan planning-slice and navigator positioning from stacked 2D localizer scans. In: Proceedings of the 14th Annual Meeting of ISMRM. 2006. p. 467.
2. Lu X, Jolly M-P, Georgescu B, Hayes C, Speier P, Schmidt M, et al. Automatic view planning for cardiac MRI acquisition. In: Medical Image Computing and Computer-Assisted Intervention–MICCAI 2011: 14th International Conference, Toronto, Canada, September 18-22, 2011, Proceedings, Part III 14. Springer; 2011. p. 479–86.
3. Pekar V, Bystrov D, Heese HS, Dries SPM, Schmidt S, Grewer R, et al. Automated planning of scan geometries in spine MRI scans. In: Medical Image Computing and Computer-Assisted Intervention–MICCAI 2007: 10th International Conference, Brisbane, Australia, October 29-November 2, 2007, Proceedings, Part I 10. Springer; 2007. p. 601–8.
4. Alansary A, Folgoc L Le, Vaillant G, Oktay O, Li Y, Bai W, et al. Automatic view planning with multi-scale deep reinforcement learning agents. In: Medical Image Computing and Computer Assisted Intervention–MICCAI 2018: 21st International Conference, Granada, Spain, September 16-20, 2018, Proceedings, Part I. Springer; 2018. p. 277–85.
5. Geng R, Sundaresan M, Starekova J, Buello C, Panagiotopoulos N, Ignaciuk M, et al. Automated Image Prescription for Liver MRI Using Deep Learning. In: Proc Intl Soc Mag Reson Med. 2021.
Figures