4557
Mapping fat-water separated R1, R2*, and fat fraction with bipolar multi-echo MP2RAGE1Medical Physics Unit, McGill University, Montreal, QC, Canada, 2Norwegian University of Science and Technology, Trondheim, Norway, 3Medical Imaging, McGill University Health Center, Montreal, QC, Canada, 4Athinoula A. Martinos Center for Biomedical Imaging, Harvard Medical School, Boston, MA, United States, 5Research Institute of the McGill University Helth Centre, Montreal, QC, Canada
Synopsis
Keywords: Quantitative Imaging, Quantitative Imaging, MP2RAGE, Bipolar, R1, R2*, Proton density fat fraction, Multi-echo, Cramér–Rao bounds, Fat-water phantom
Motivation: Multi-Echo Magnetization Prepared Two Rapid Acquisition of Gradient Echoes (ME-MP2RAGE) can be combined with chemical shift-encoded fat-water separation to simultaneously map fat and water-specific R1. However, long echo times in the multi-echo portion of the technique can lead to poor fat-water separation and compromised accuracy and precision of the estimates.
Goal(s): Simultaneous mapping of fat and water-specific R1, R2*, and proton density fat fraction with bipolar ME-MP2RAGE.
Approach: Unipolar and bipolar ME-MP2RAGE sequences were compared in simulation and phantom experiments.
Results: Numerical simulations and phantom experiments showed that bipolar readouts produce more accurate and precise estimates than unipolar alternatives.
Impact: We propose a technique for simultaneous measurement of PDFF, fat and water-specific R1, and R2* combining multi-echo MP2RAGE and fat-water separation. Moreover, we show that bipolar readouts produce more accurate and precise estimates of these parameters using multi-echo MP2RAGE.
Introduction
Measuring fat and water-specific longitudinal relaxation rates (R1,f and R1,w), proton density fat fraction (PDFF), and effective transverse relaxation rate (R2*) enables MRI-based applications like MR-oximetry1,2. Simultaneous measurement of R1,f and R1,w was previously done by combining multi-echo chemical shift-encoded (CSE) fat-water separation with Multi-Echo Magnetization Prepared Two Rapid Acquisition of Gradient Echoes (ME-MP2RAGE)3. This work shows the extension of this technique to map R2* and PDFF and to include bipolar readouts. We hypothesized that bipolar readouts can provide more accurate and precise estimates of PDFF, R1,f, R1,w, and R2* than unipolar readouts. Also, bipolar readouts will enable a reduction in scan time, improved spatial resolution, and/or increased SNR in future research with this technique4–6.Methods
R1,w and R1,f were calculated with fat and water-specific MP2RAGE signals3. R2* and the signal fat-fraction (SFF) were obtained from fat-water separation from the second RAGE block. PDFF was obtained by correcting SFF to eliminate R1-bias7.Sequence parameter optimization was done independently for the inversion preparation and multi-echo readout of the sequence. Inversion preparation was previously optimized3 to map R1=1–5 s-1. Cramér–Rao bounds (CRBs) formalism was used to optimize echo time (first echo time and echo spacing). CRBs were calculated for fat-water separation with unipolar8,9 and bipolar5 readouts. These were used to select sequence parameters that maximize value-to-noise ratios for R2*, SFF, R1,f, R1,w. Further study of the theoretical accuracy and precision of the estimates was done with Monte Carlo (MC) simulations.
Fat-water separation was performed with a version of the graph-cut method10 modified to correct phase and amplitude variations induced by bipolar readouts4–6. Graph cut optimization was used to estimate $$$B_0$$$ inhomogeneities $$$ψ$$$ and R2*. Then, complex fat and water signals from even and odd echo sets were used to estimate phase and amplitude corrections $$$θ(x,y)=ϕ-iε$$$ (Equation 1)5. Finally, the complex map $$$θ(x,y)$$$ was used to eliminate bipolar-induced phase and amplitude variations and fat and water signals were calculated. Chemical-shift and field-inhomogeneity-induced spatial misregistration were minimized by using a high receiver bandwidth (1700–1720 Hz/pixel)4. We used an eight-resonance spectral model of fat11 and a single R2* value for the fat and water components12,13.
$$ S_{n}(x,y)=\begin{cases}\left(W(x,y)+F(x,y)\sum_{m=1}^{M}\alpha_{m}e^{i2\pi\Delta f_{m}TE_{n}}\right)e^{i2\pi\psi(x,y)TE_{n}}e^{-R_{2}^{*}(x,y)TE_{n}}e^{-i\theta(x,y)} & \text{for n odd}\\\left(W(x,y)+F(x,y)\sum_{m=1}^{M}\alpha_{m}e^{i2\pi\Delta f_{m}TE_{n}}\right)e^{i2\pi\psi(x,y)TE_{n}}e^{-R_{2}^{*}(x,y)TE_{n}}e^{i\theta(x,y)} & \text{for n even}\end{cases}\text{(Equation 1)}$$
The effects of the number of echoes and of the bipolar readout were evaluated in a custom-made phantom. The phantom consisted of 4 vials containing emulsions14 of agar, peanut oil, and gadolinium-based contrast agent (GBCA; Gadovist 1.0 M, Bayer), 2 vials of doped distilled water, and 1 vial of pure oil, immersed in a cylindrical enclosure filled with a water solution of GBCA and NaCl (Figure 3).
3-way ANOVA and Tukey’s post hoc test were used to compare SSF, PDFF, R1 (grouping R1,w and R1,f), and R2*maps between techniques. PDFF maps were compared to measures from fat-water separation on 3D FLASH data with unipolar readout. Agreement was assessed using the intraclass correlation coefficient (ICC) of the mean values in ROIs 1-8.
Results and discussion
ME-MP2RAGE-IV, with 10 bipolar echoes, achieved greater CRB value-to-noise ratio and precision for SFF, R1,f, R1,w, and R2* across all PDFFs for echo spacing below 1 ms compared to ME-MP2RAGE I-III (Figure 1). However, bipolar acquisitions presented a steep decrease of value-to-noise-ratio between 1.0 and 1.2 ms, consistent with lower precision in fat-water separation with bipolar readouts5.ME-MP2RAGE-IV also had the smallest mean relative error for all parameters given a PDFF value in MC simulations. MC simulation predicted more accurate estimates for PDFF, R1,f R1,w, and R2* with more echoes, unipolar or bipolar, as indicated by decreasing mean and standard deviation of the relative error (Figure 2). PDFF was also more accurate after correction for R1-bias (Figure 2). The difference between SFF and PDFF is expected to be smaller for larger R1,w values (phantom ROIs 4–7)7.
In phantom experiments, post hoc testing comparing ME-MP2RAGE I-IV revealed no statistically significant effect of measurement technique for R1 (P=0.9). ME-MP2RAGE II-IV results matched ME-P2RAGE I, previously shown as accurate3. Figure 3 shows the quantitative maps for all experiments and Figure 4 plots the R1,f, R1,w, and R2*. Measurement had a statistically significant effect on R2* values (P<0.001). R2* was more precise for ME-MP2RAGE II-IV. PDFF from all ME-MP2RAGE experiments matched the reference technique with ICC=0.99.
Conclusion
Fat-water separated ME-MP2RAGE can be used with bipolar readouts to improve accuracy and precision in PDFF, R1,f R1,w, and R2* mapping. This conclusion is supported by CRB analysis and MC simulations. Phantom experiments showed R1,f, R1,w, and PDFF agreement when comparing with reference techniques and improved precision of R2* mapping.Acknowledgements
We acknowledge funding from The Natural Sciences and Engineering Research Council of Canada (NSERC) and The Fonds de recherche du Québec – Nature et technologies (FRQNT). We would also like to acknowledge the Montreal General Hospital (MGH) MRI Research Platform where we collected data, and the authors of the ISMRM Toolbox for fat-water separation.
References
1. Burrell JS, Walker‐Samuel S, Baker LCJ, et al. Exploring ΔR 2 * and ΔR 1 as imaging biomarkers of tumor oxygenation. Magnetic Resonance Imaging. 2013;38(2):429-434. doi:10.1002/jmri.23987
2. O’Connor JPB, Robinson SP, Waterton JC. Imaging tumour hypoxia with oxygen-enhanced MRI and BOLD MRI. BJR. 2019;92(1096):20180642. doi:10.1259/bjr.20180642
3. Fortin MA, Véronique F, Campos Pazmino, J, van der Kouwe, A, Levesque, I. Fat-water separated T1 mapping with multi-echo MP2RAGE. In: Intl. Soc. Mag. Reson. Med. ; 2022. doi:DOI: https://doi.org/10.58530/2022/2854
4. Lu W, Yu H, Shimakawa A, Alley M, Reeder SB, Hargreaves BA. Water-fat separation with bipolar multiecho sequences. Magn Reson Med. 2008;60(1):198-209. doi:10.1002/mrm.21583
5. Peterson P, Månsson S. Fat quantification using multiecho sequences with bipolar gradients: Investigation of accuracy and noise performance: Fat Quantification Using Bipolar Multiecho Sequences. Magn Reson Med. 2014;71(1):219-229. doi:10.1002/mrm.24657
6. Yu H, Shimakawa A, McKenzie CA, et al. Phase and amplitude correction for multi-echo water-fat separation with bipolar acquisitions. J Magn Reson Imaging. 2010;31(5):1264-1271. doi:10.1002/jmri.22111
7. Liu CY, McKenzie CA, Yu H, Brittain JH, Reeder SB. Fat quantification with IDEAL gradient echo imaging: Correction of bias fromT1 and noise. Magn Reson Med. 2007;58(2):354-364. doi:10.1002/mrm.21301
8. Pineda AR, Reeder SB, Wen Z, Pelc NJ. Cramér-Rao bounds for three-point decomposition of water and fat. Magn Reson Med. 2005;54(3):625-635. doi:10.1002/mrm.20623
9. Diefenbach MN, Liu C, Karampinos DC. Generalized parameter estimation in multi-echo gradient-echo-based chemical species separation. Quant Imaging Med Surg. 2020;10(3):554-567. doi:10.21037/qims.2020.02.07
10. Hernando D, Kellman P, Haldar JP, Liang ZP. Robust Water/Fat Separation in the Presence of Large Field Inhomogeneities Using a Graph Cut Algorithm. Magn Reson Med. 2010;63(1):79-90. doi:10.1002/mrm.22177
11. Triay Bagur A, Hutton C, Irving B, Gyngell ML, Robson MD, Brady M. Magnitude-intrinsic water–fat ambiguity can be resolved with multipeak fat modeling and a multipoint search method. Magnetic Resonance in Medicine. 2019;82(1):460-475. doi:10.1002/mrm.27728
12. Chebrolu VV, Hines CDG, Yu H, et al. Independent Estimation of T2* for Water and Fat for Improved Accuracy of Fat Quantification. Magn Reson Med. 2010;63(4):849-857. doi:10.1002/mrm.22300
13. Yu H, Shimakawa A, McKenzie CA, Brodsky E, Brittain JH, Reeder SB. Multiecho water-fat separation and simultaneous R 2* estimation with multifrequency fat spectrum modeling. Magn Reson Med. 2008;60(5):1122-1134. doi:10.1002/mrm.21737
14. Bush EC, Gifford A, Coolbaugh CL, Towse TF, Damon BM, Welch EB. Fat-Water Phantoms for Magnetic Resonance Imaging Validation: A Flexible and Scalable Protocol. J Vis Exp. 2018;(139):57704. doi:10.3791/57704
Figures
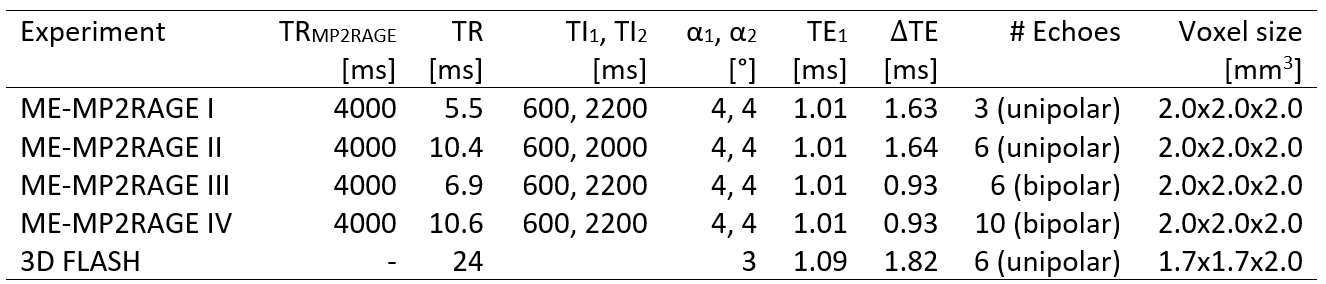
Table 1: Acquisition parameters for the ME-MP2RAGE and 3D FLASH experiments used in this study. Inversion times TI1 and TI2, the flip angles α1 and α2, the repetition time TR, and the shot interval TRMP2PRAGE were previously optimized for mapping R1=0.5–5 s-1. Experiments changed the number of echoes, TR, and readout (unipolar vs. bipolar). The shortest TI1 was selected to fit the longest combination of number of echoes and readouts with minimum TR and echo spacing, and then held constant. Scan time for all ME-MP2RAGE acquisitions was 4 min 28 s, and 7 min 04 s for 3D FLASH.
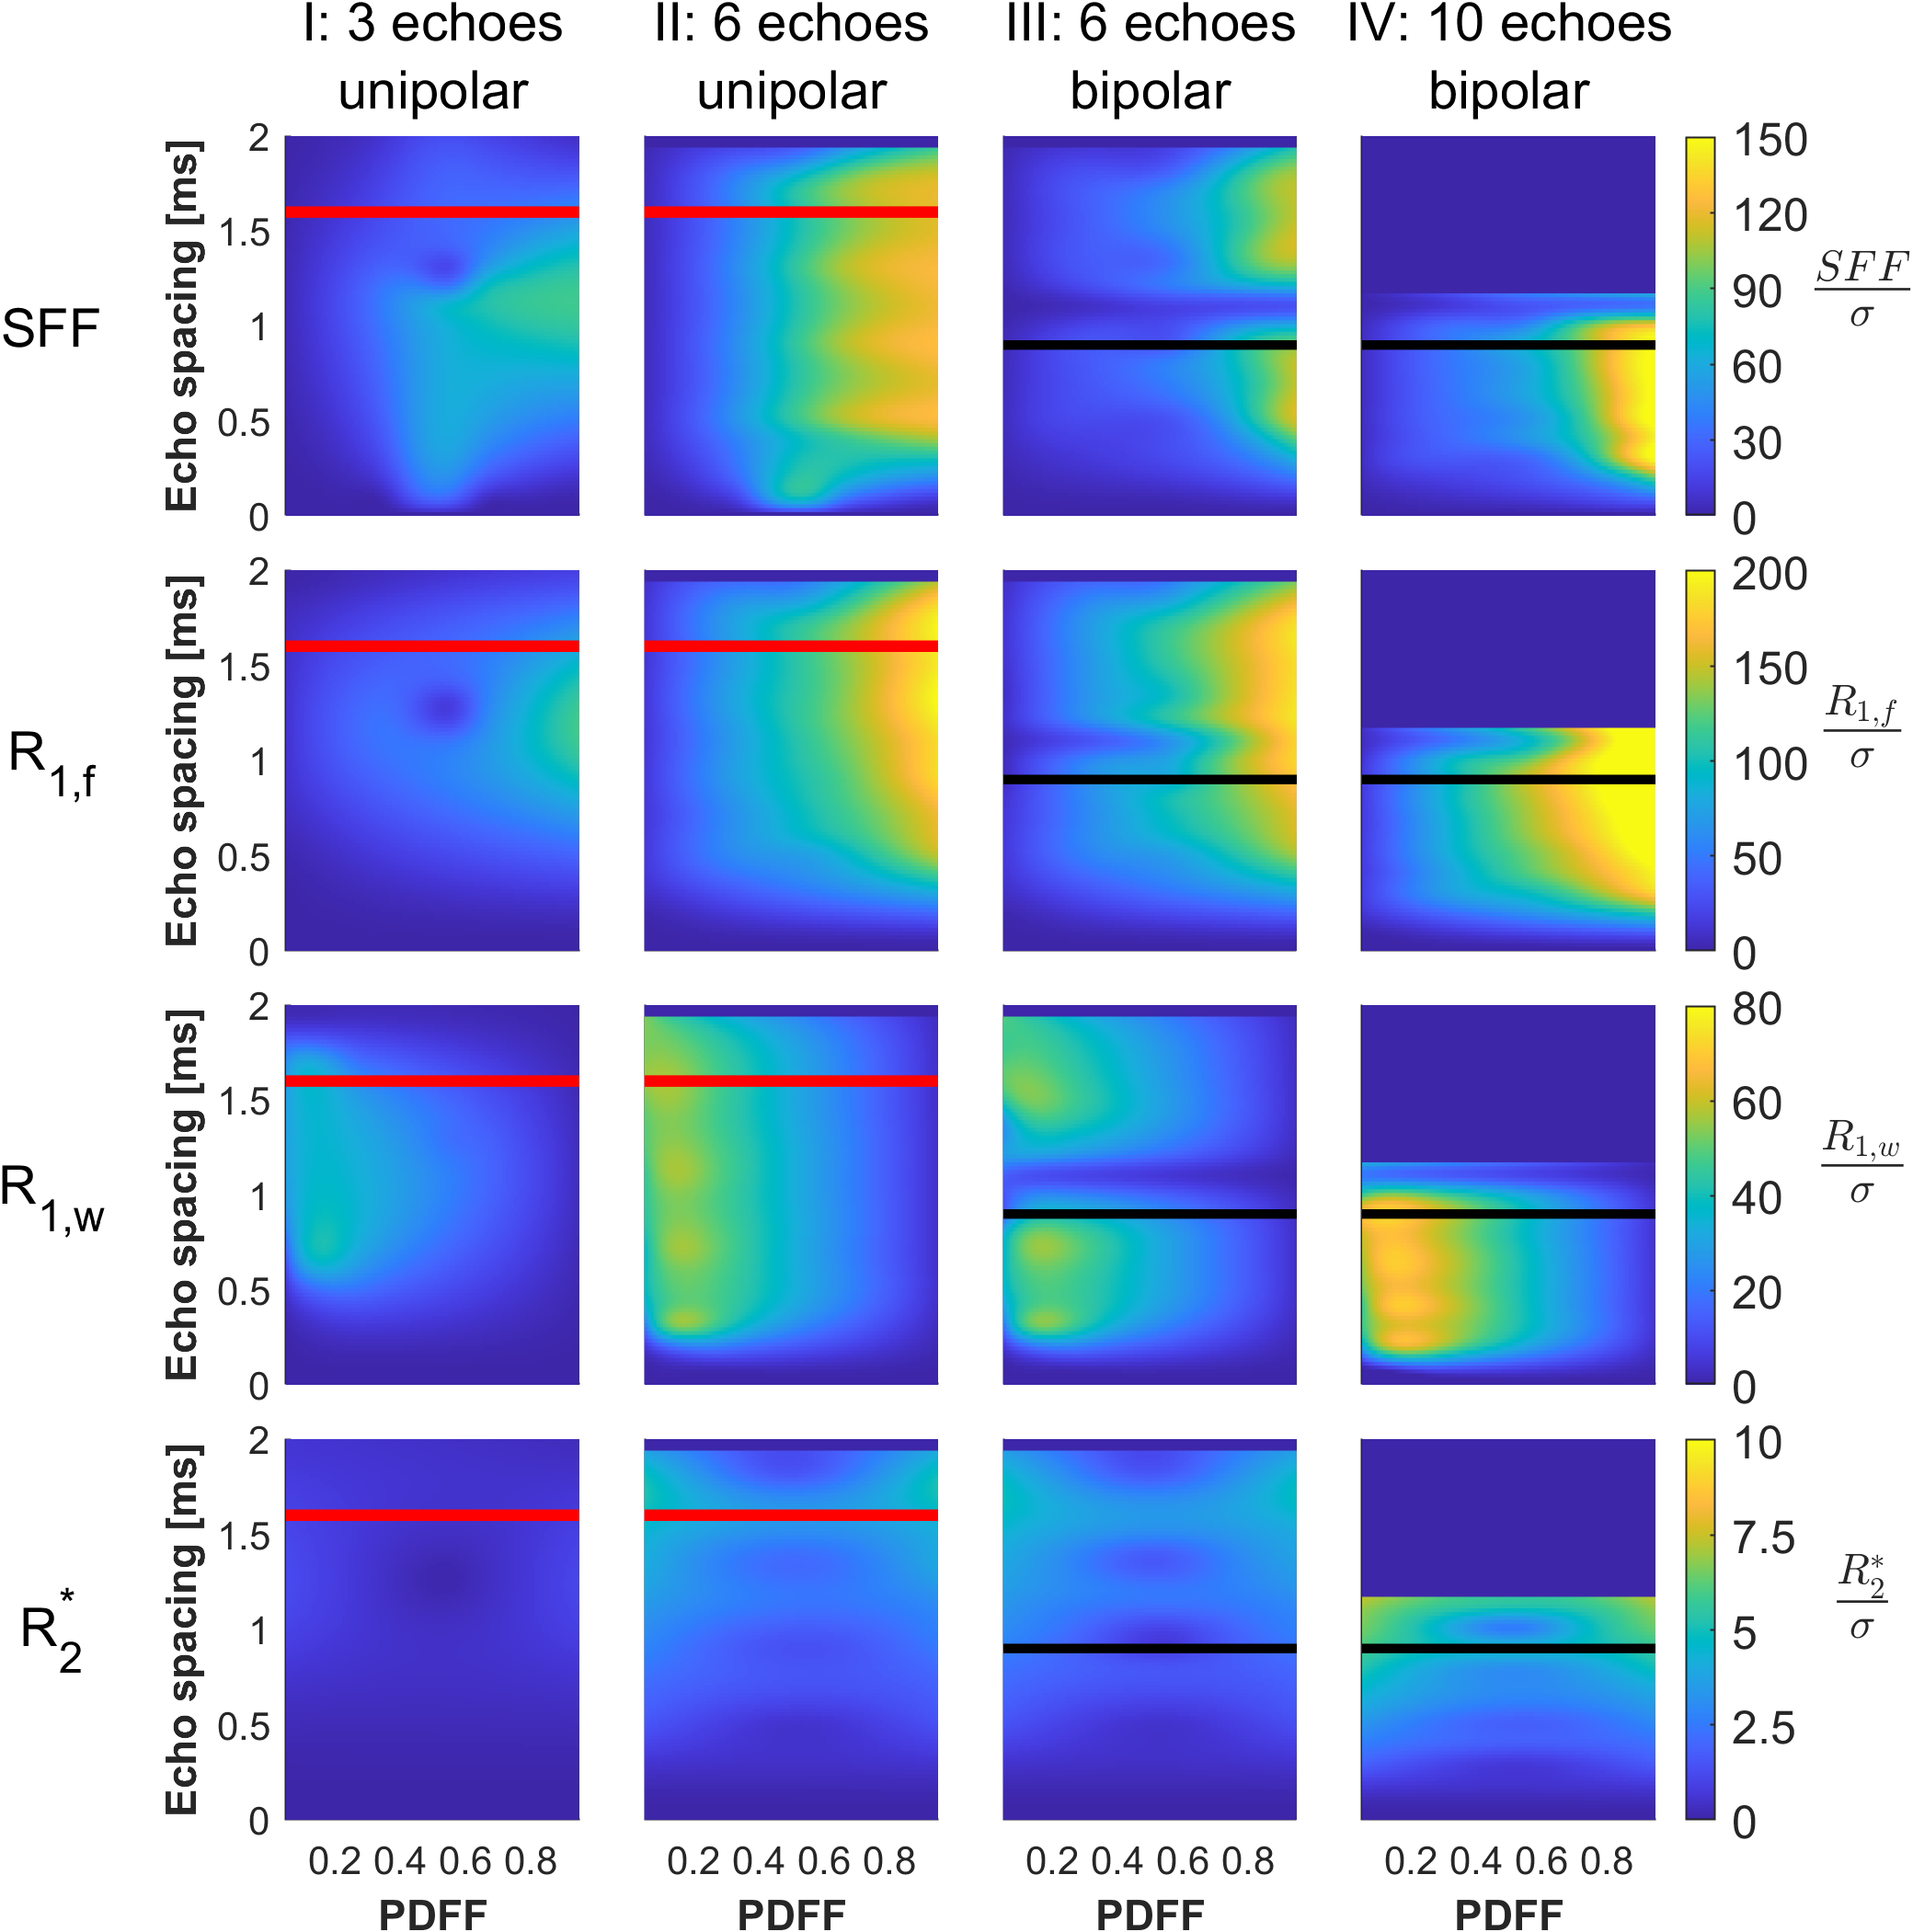
Figure 1: CRB heat maps of the value-to-noise-ratio as function of echo spacing and PDFF. Rows: parameters SFF, R1,f, R1,w, and R2*. Columns: ME-MP2RAGE I-IV. Red and black lines: minimum echo spacing with unipolar (1.6 ms) and bipolar (0.9 ms) readouts on our MR system. Calculations assume: R1,f=3.3 s-1, R1,w=1.0 s-1, R2*=20 s-1, $$$ψ=π/20$$$ Hz, $$$ϕ=0.02π$$$, $$$ε=0.03$$$, TRMP2RAGE=4 s, TI1=0.6 s, TI2=2.2 s, α1=α2=4 degrees, TE1=1 ms, minimum TR, and infinite bandwidth. Echo spacings that are not possible for the considered TRMP2RAGE, TR, TI1, and TI2 are set to 0.
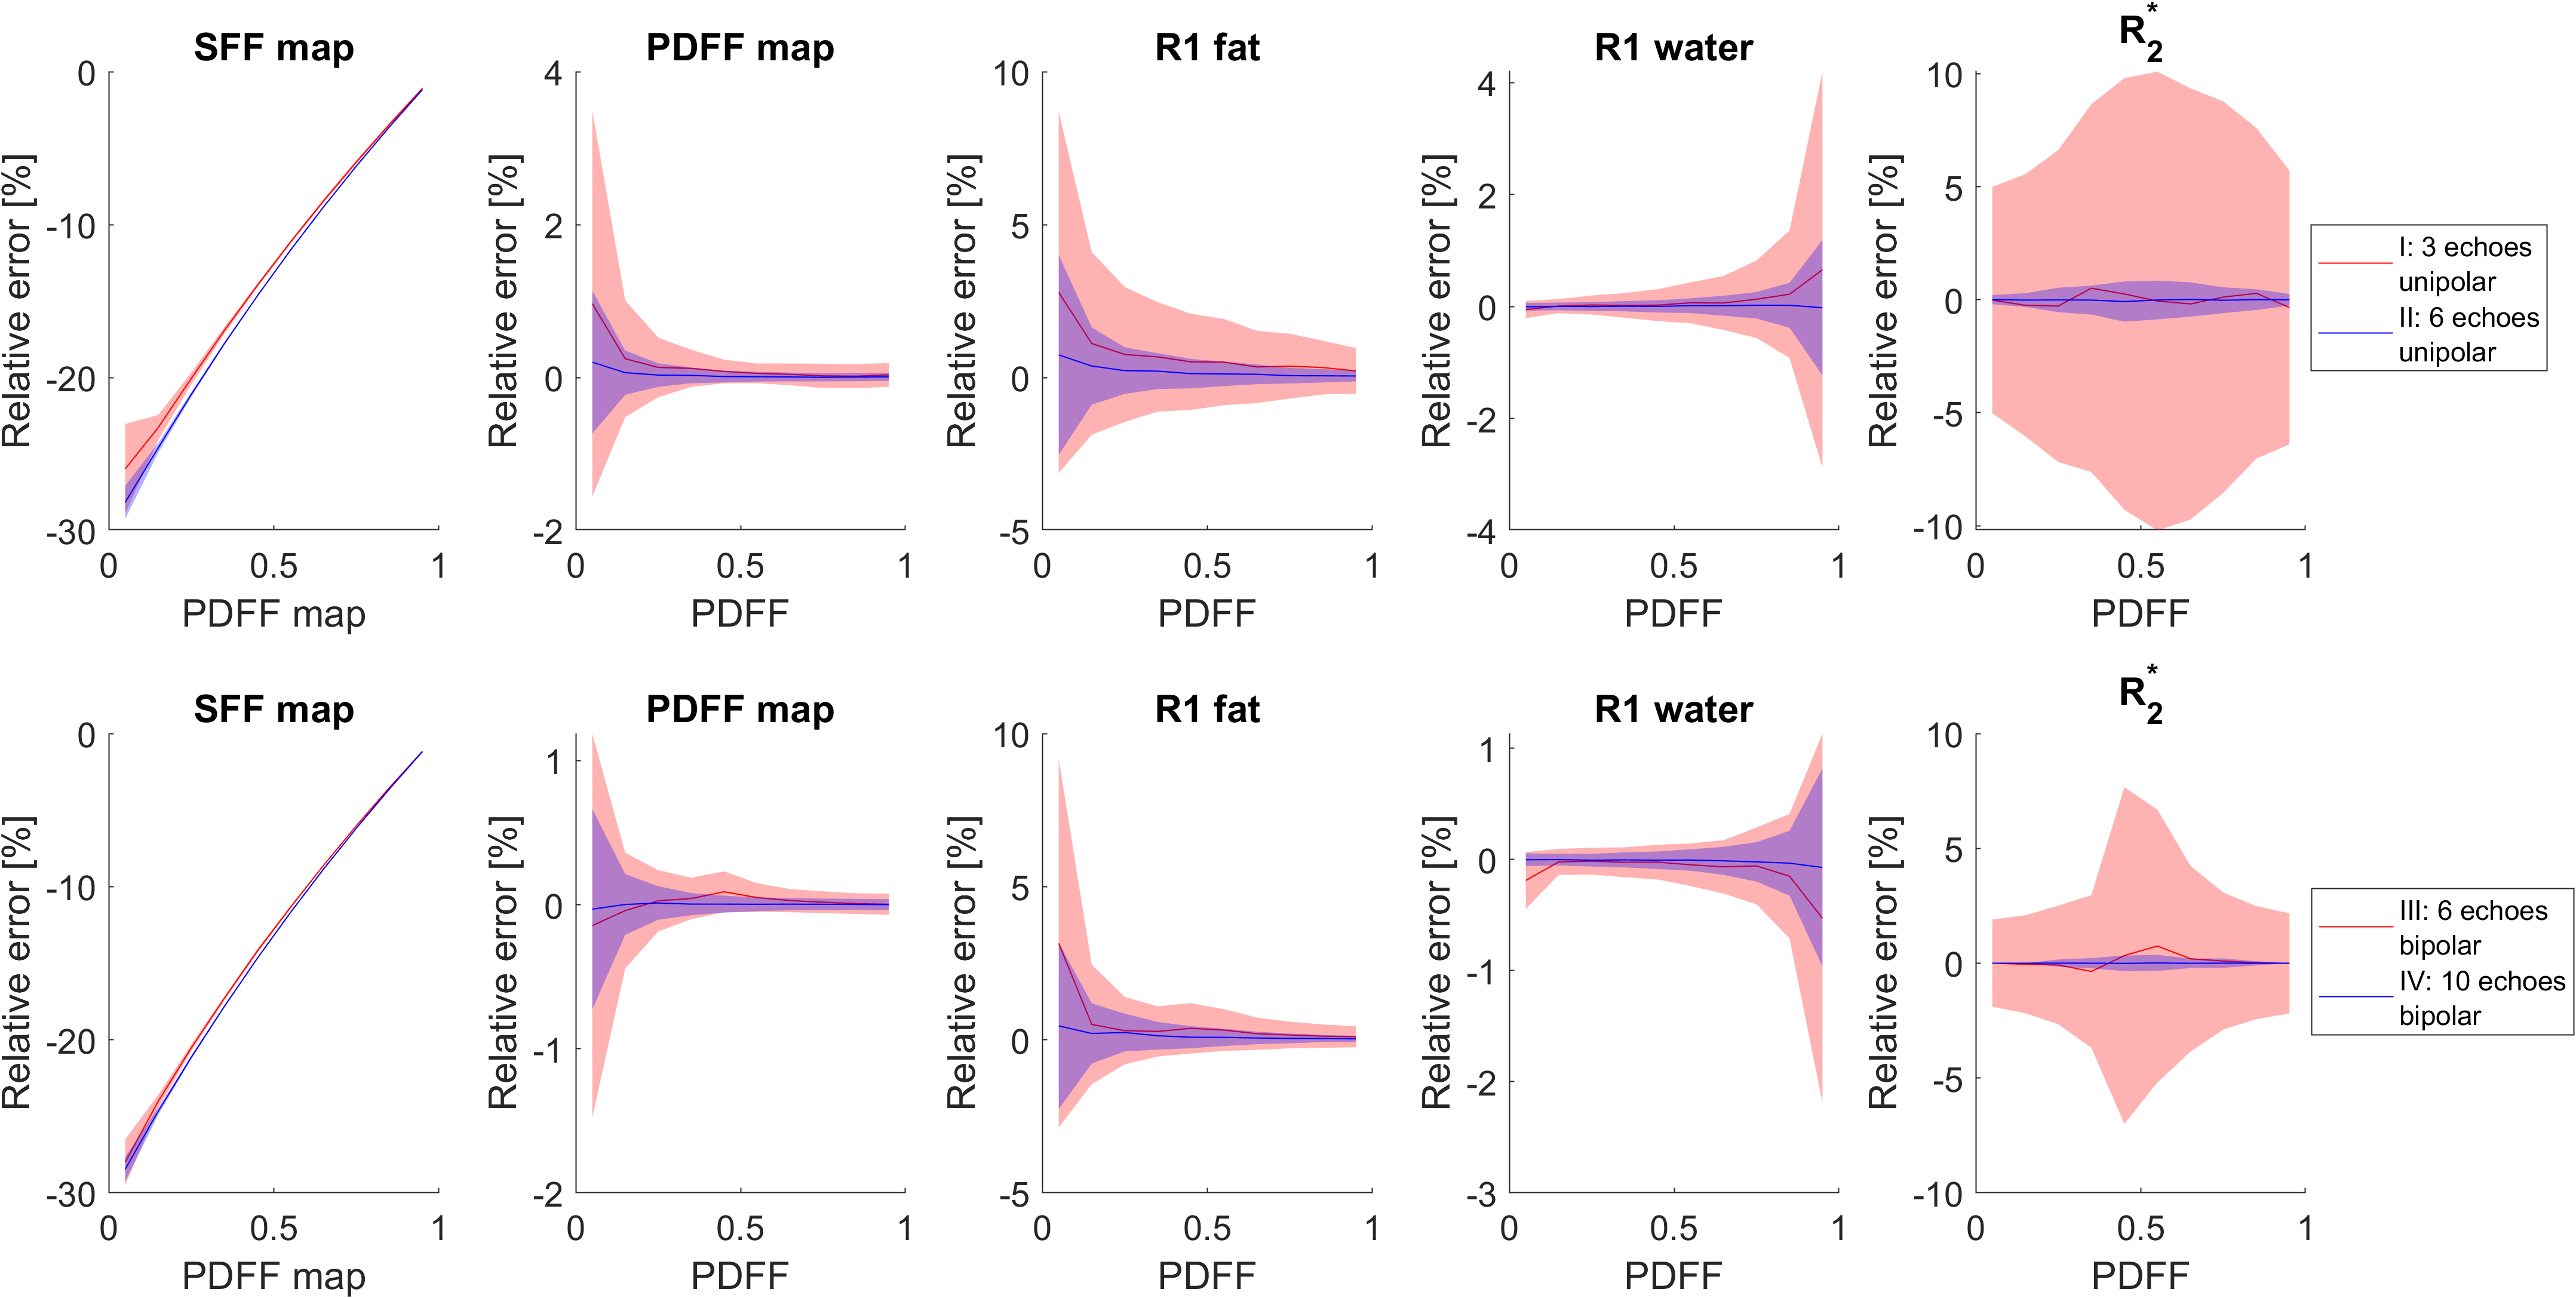
Figure 2: MC simulations of mean (solid line) and standard deviation (width of shaded region) of relative error. Top row: ME-MP2RAGE I and II with TE1=1 ms and ΔTE=1.6 ms. Bottom row: ME-MP2RAGE III-IV with TE1=1 ms and ΔTE=0.9 ms. Results assume: R1,f=3.3 s-1, R1,w=1.0 s-1, R2*=20 s-1, $$$ψ=π/20$$$ Hz, $$$ϕ=0.02π$$$, $$$ε=0.03$$$, TRMP2RAGE=4 s, TI1=0.6 s, TI2=2.2 s, α1=α2=4 degrees, TE1=1 ms, minimum TR, infinite bandwidth, and SNR=30.
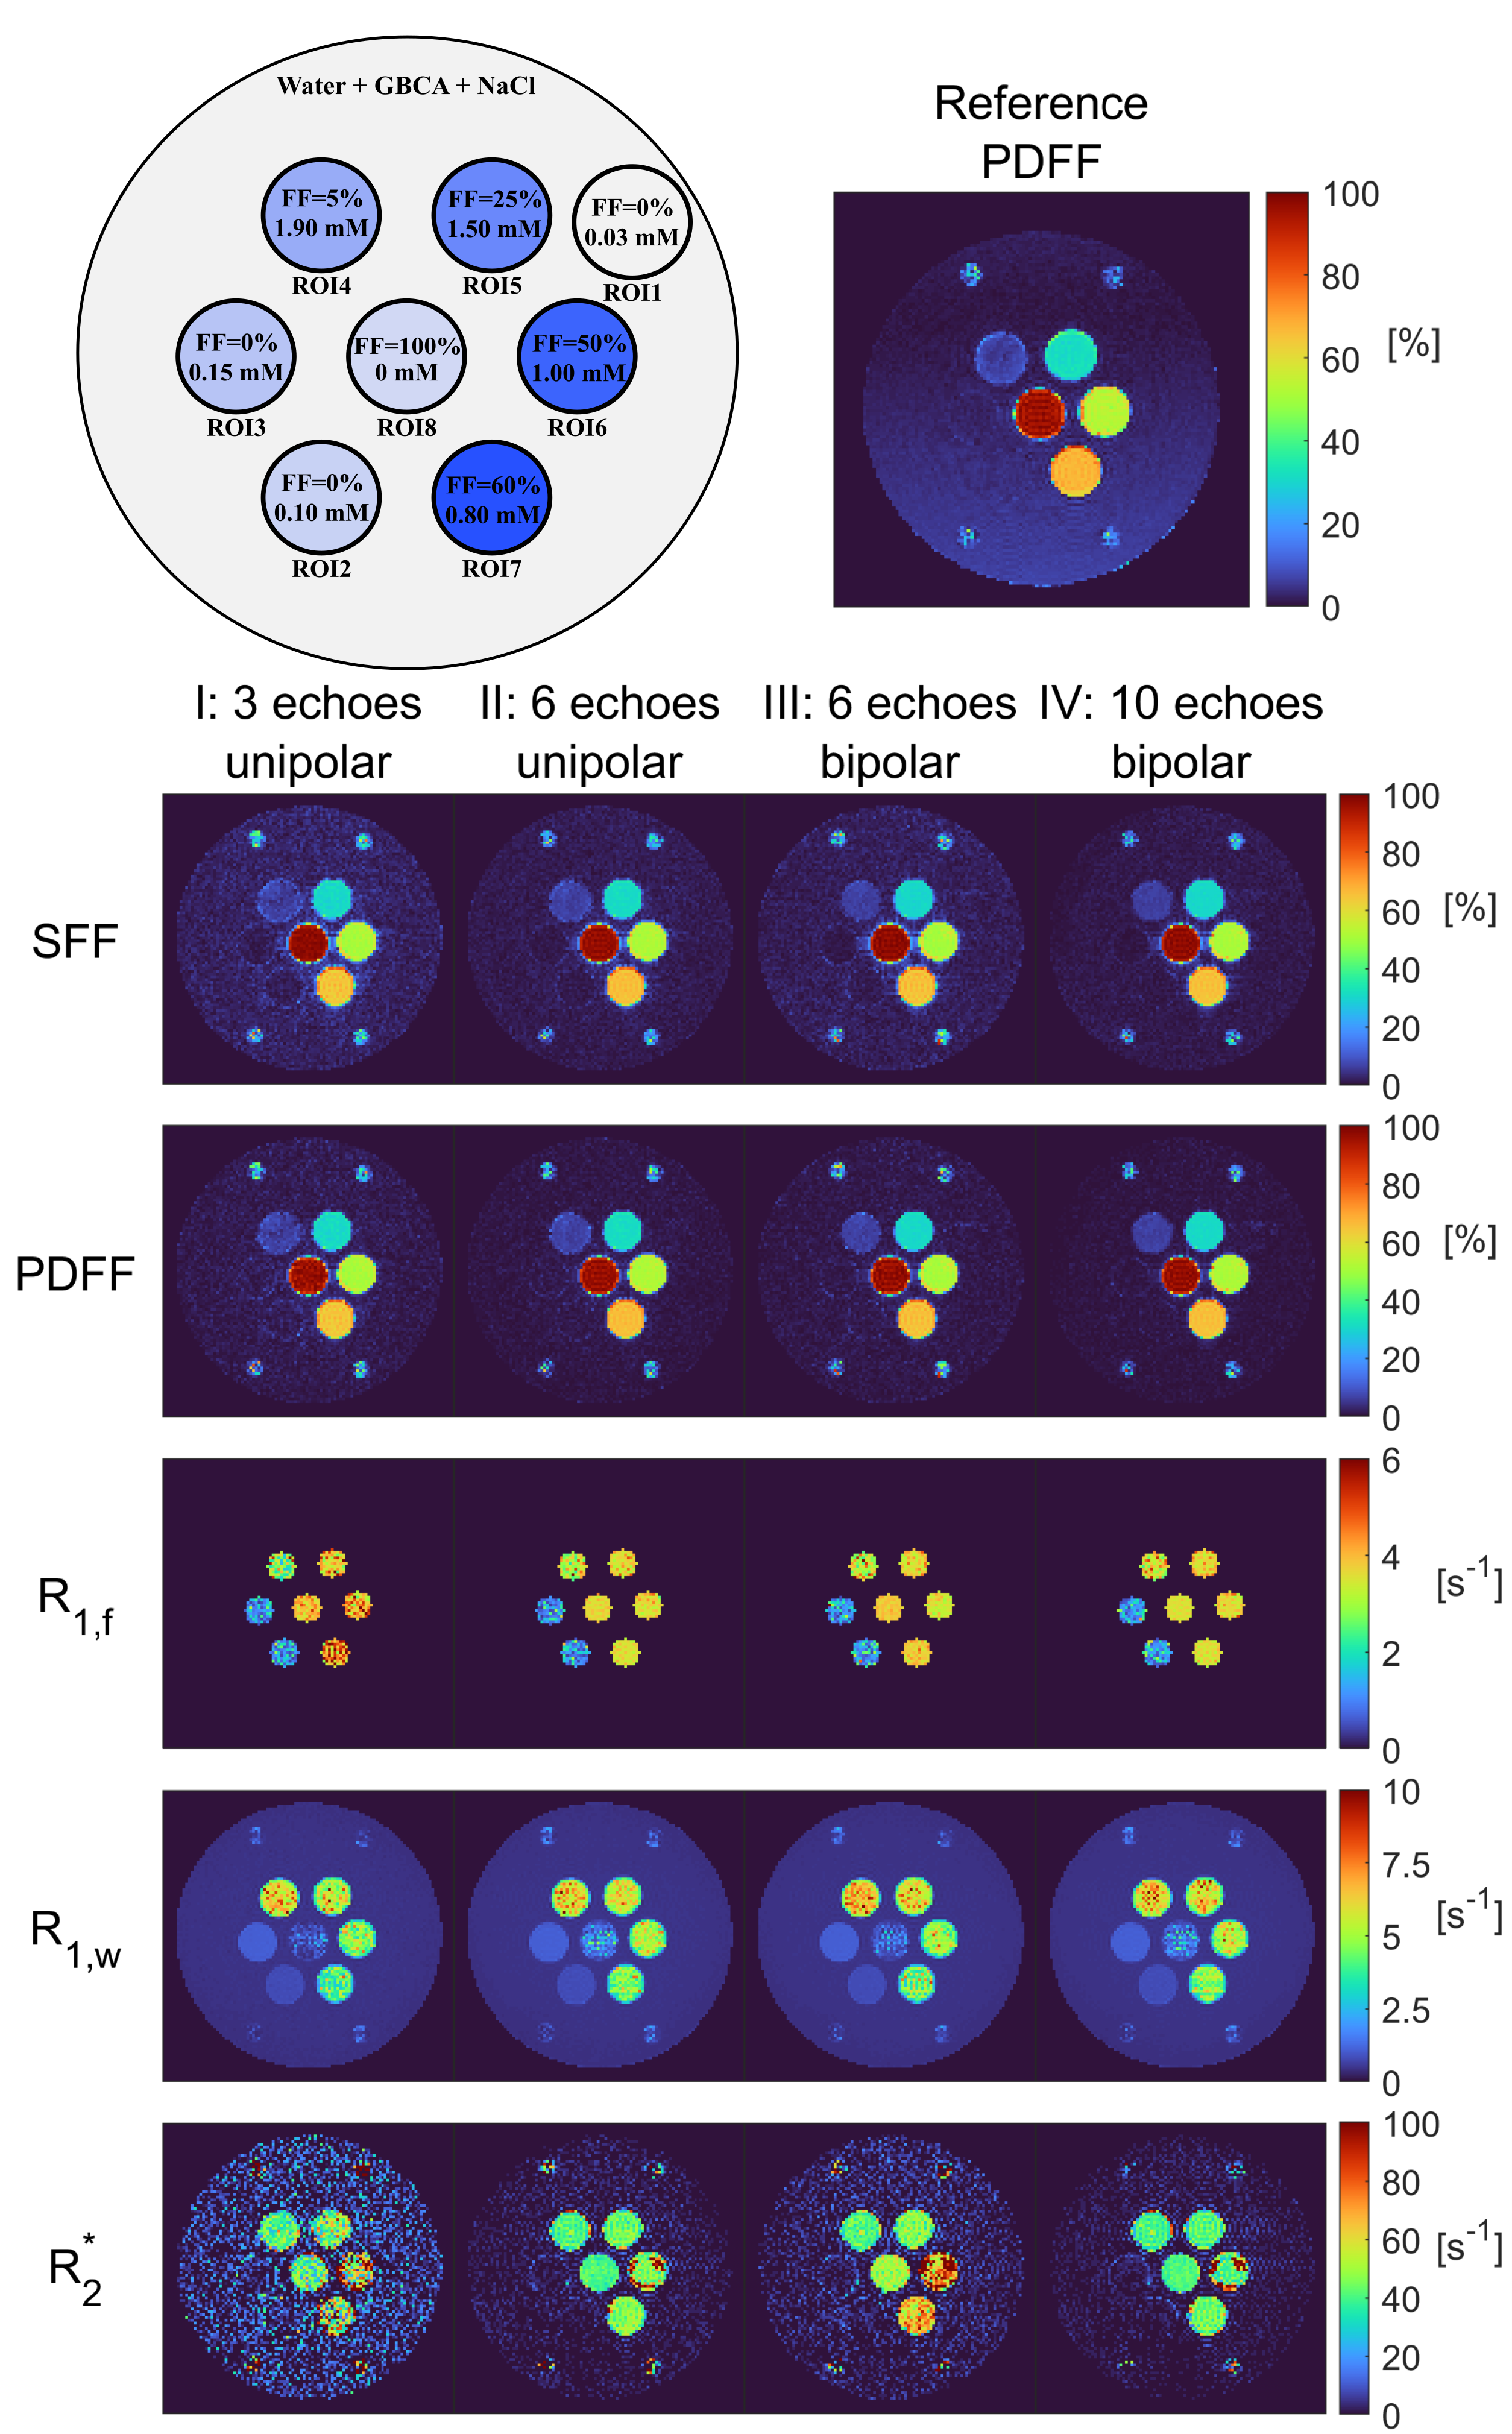
Figure 3: Quantitative maps for phantom experiments. Top figure: Phantom diagram and reference PDFF map from FLASH3D experiment. Bottom figure: Quantitative maps for ME-MP2RAGEI-IV experiment. In the phantom, 8 ROIs are considered. ROI1 is representative of the large phantom compartment. ROI2-8 cover the 7 vials inside the phantom with varying fat volume fraction and GBCA concentration (values are reported in the phantom diagram).
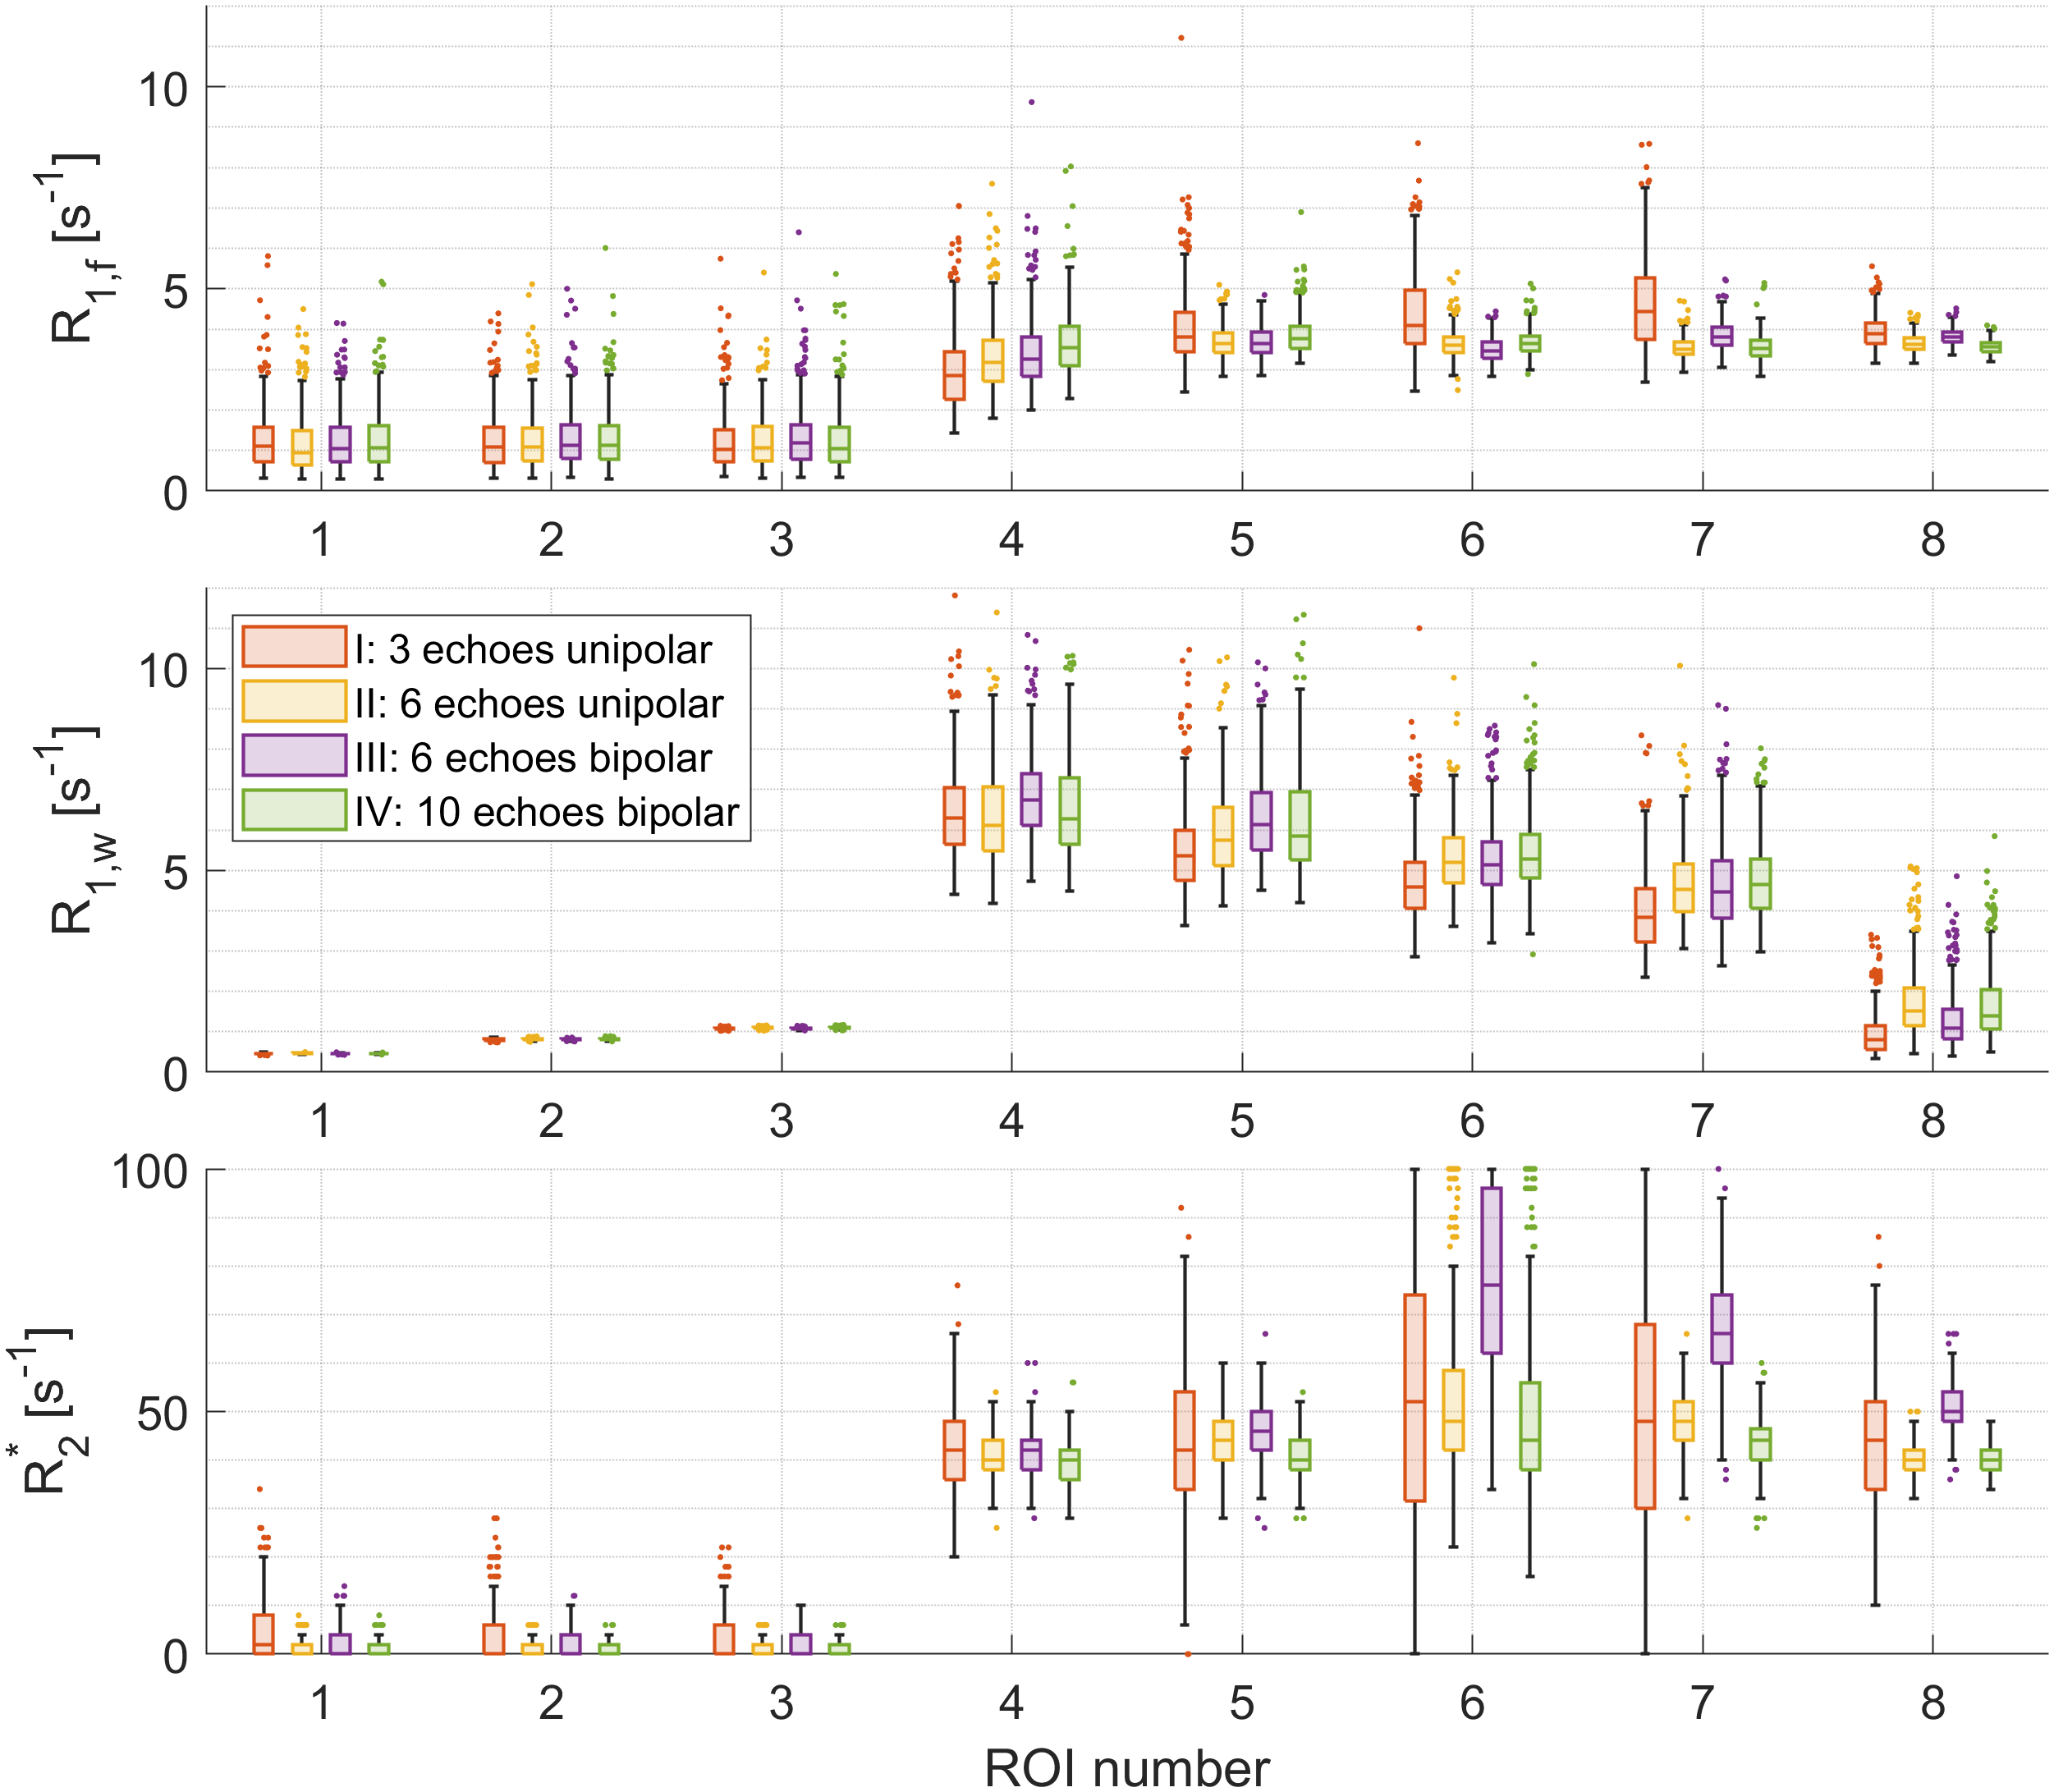
Figure 4: Box plots of R1,f, R1,w, and R2* (top, middle, and bottom row, respectively) and ME-MP2RAGE experiments (identified by color for each ROI 1–8). In ROIs 4–8, R1,f remains relatively constant for all acquisitions. R1,w decreases with GBCA concentration, i.e. from ROI 1-7. ROIs are shown in Figure 3.