4556
KTSSI: Quantitative fascial magnetic resonance imaging1National Center for Nanoscience and Technology, Beijing, China, 2School of Future Technology, University of Chinese Academy of Sciences, Beijing, China, 3Beijing Wandong Medical Technology Co.,Ltd., Beijing, China
Synopsis
Keywords: Quantitative Imaging, Quantitative Imaging, Fascia
Motivation: Fascia, a challenging component in MRI due to its rapid signal decay, remains elusive in in vivo imaging under normal physiological conditions.
Goal(s): This study introduces an innovative K-T Space Section Imaging-MRI (KTSSI) method, aimed at illuminating the T2* characteristics of fascial tissues.
Approach: Through extensive phantom testing and MRI scans of healthy human lower legs using KTSSI, we reveal a new dimension of fascia within the broader MRI domain.
Results: Obtained were extensive, continuous 3D reconstructed images of the fascia in healthy individuals, displaying distinct and clear features under normal physiological conditions.
Impact: This work reframes enable the imaging of fascia, paving the way for patients with myofascial conditions by enabling early detection and precise evaluation of structural changes. This opens avenues for investigating dynamic anatomical adhesions or structural ruptures.
INTRODUCTION
In inflammatory or traumatic myofascial conditions, there is a critical need for vigilant observation before the onset of inflammatory responses. For patients requiring the evaluation of dynamic anatomical structures, fascia imaging introduces a diverse range of diagnostic opportunities 1. Thus, a tool for early detection and precise evaluation of structural changes in myofascial conditions is needed. Investigations on fascia MRI under normal condition is limited due to its short T2 relaxation time and rapid signal decay 2. Recently, UTE and ZTE techiniques have been used to imaging fascia and related structures 3,4. However, it is still difficult to separate fascia from surrounding tissues. To image and quantify T2* value of fascia continuum, a K-T Space Section Imaging (KTSSI) MRI technique was propsed in this study. And the feasibility of KTSSI was evaluated with phantoms and in vivo fascia imaging experiments.METHODS
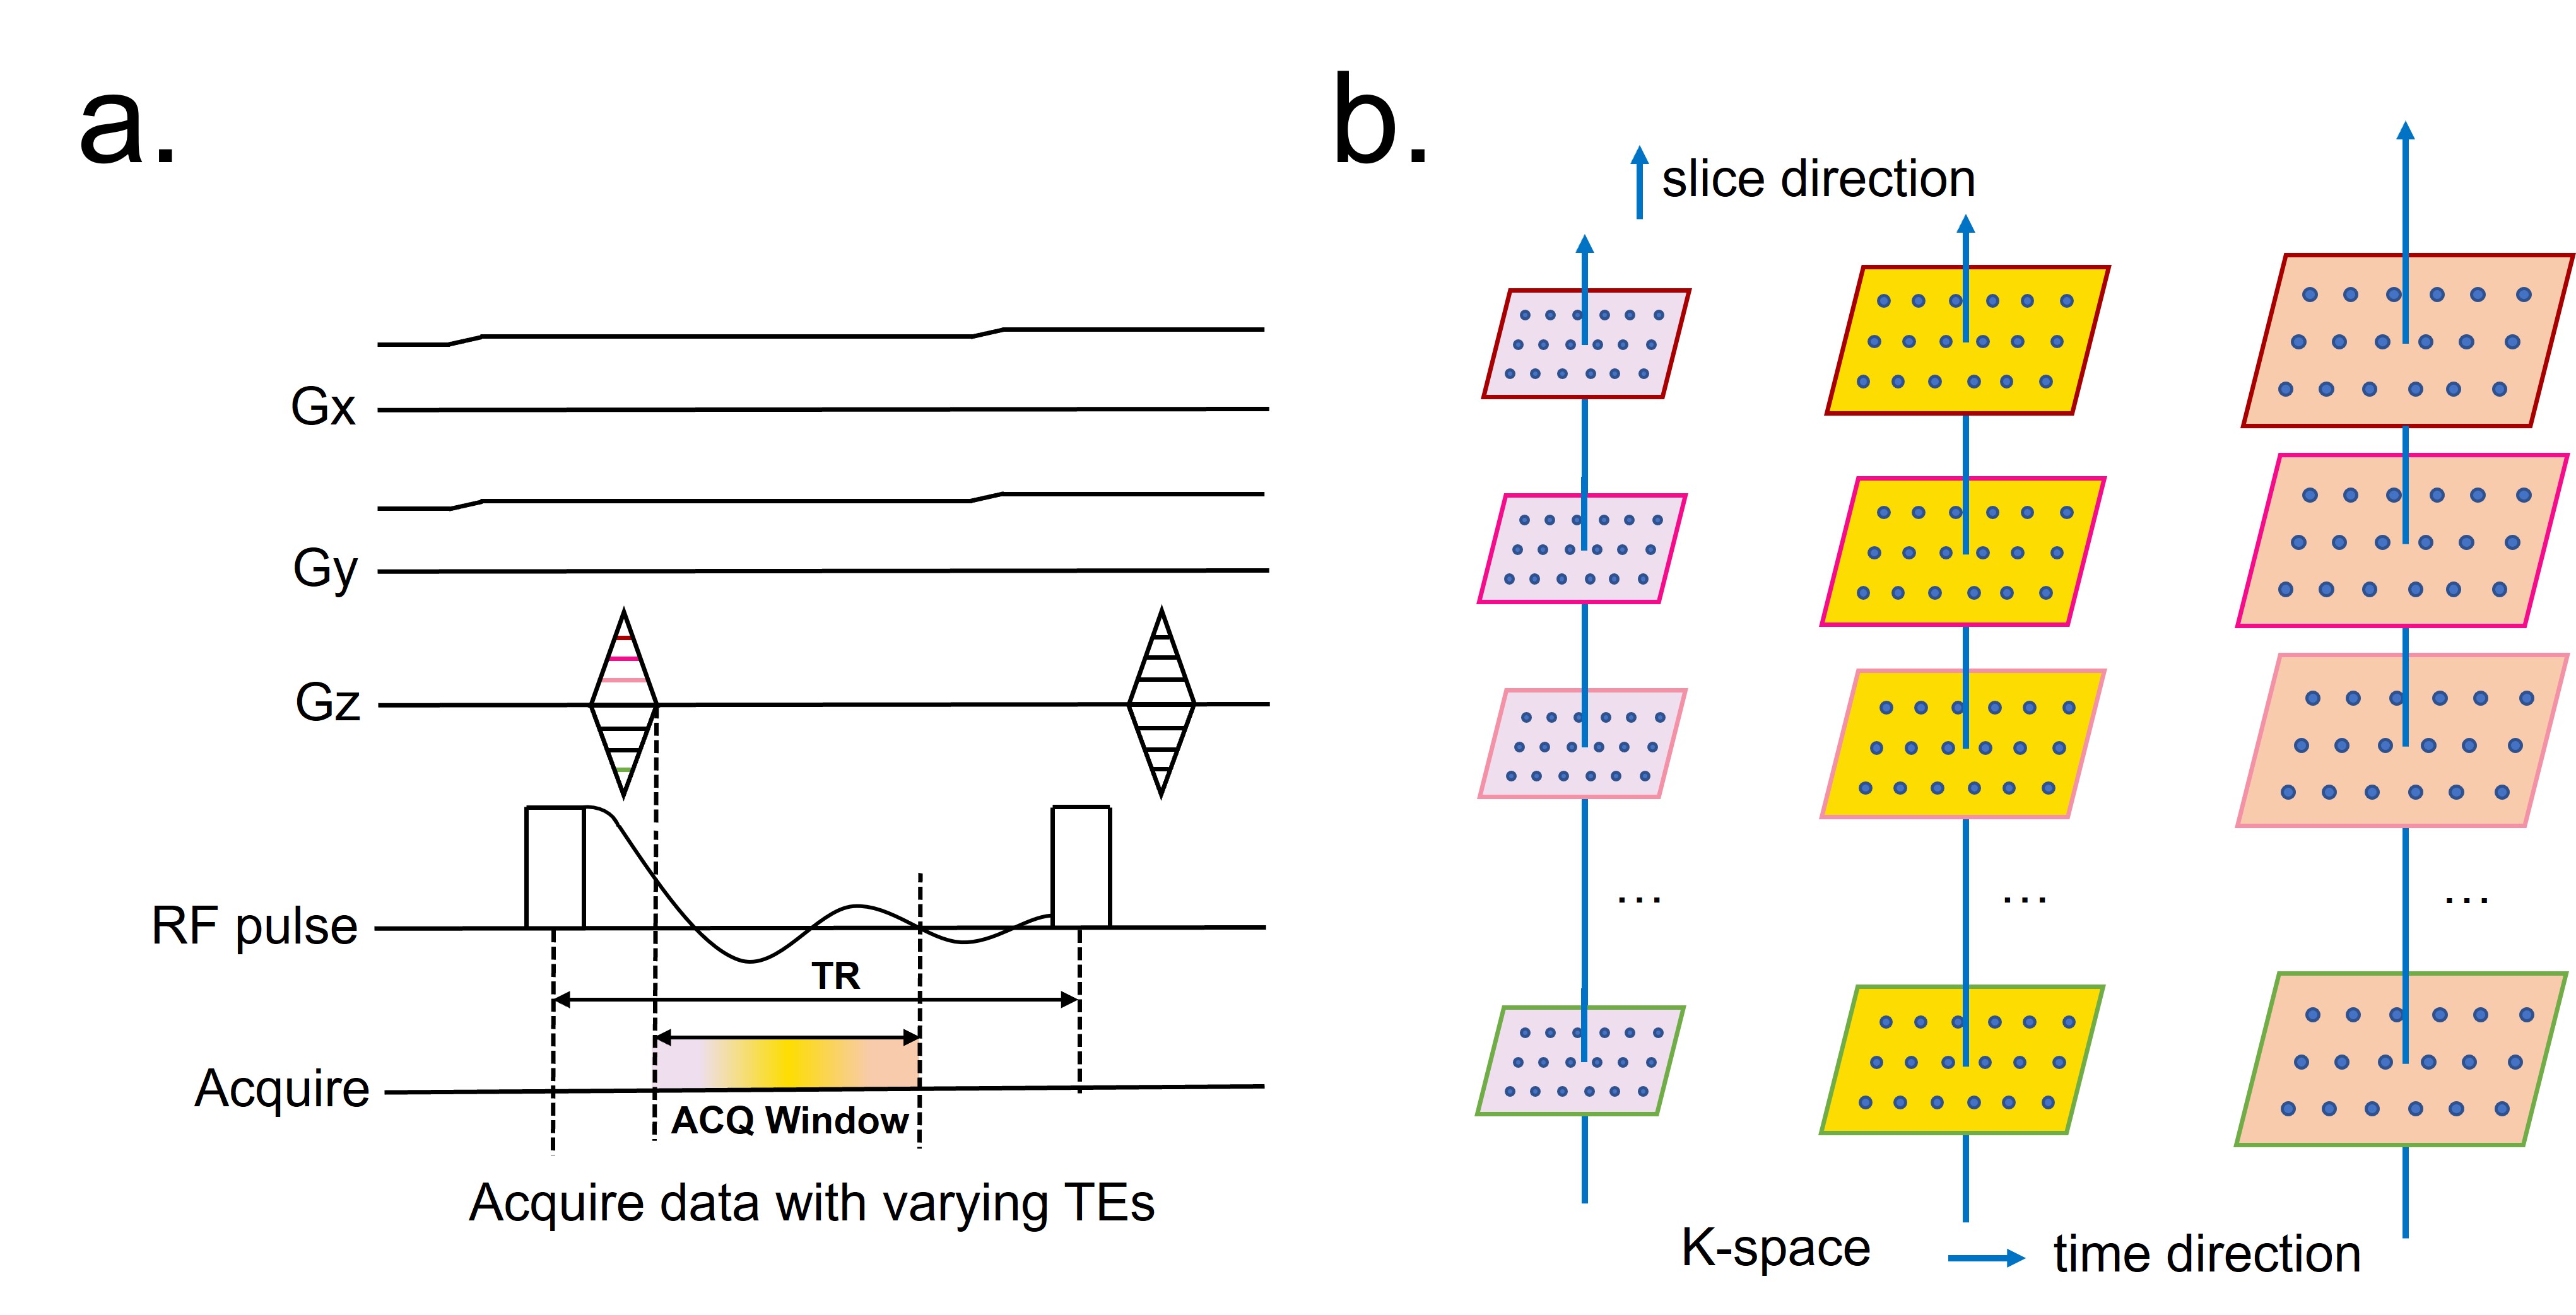
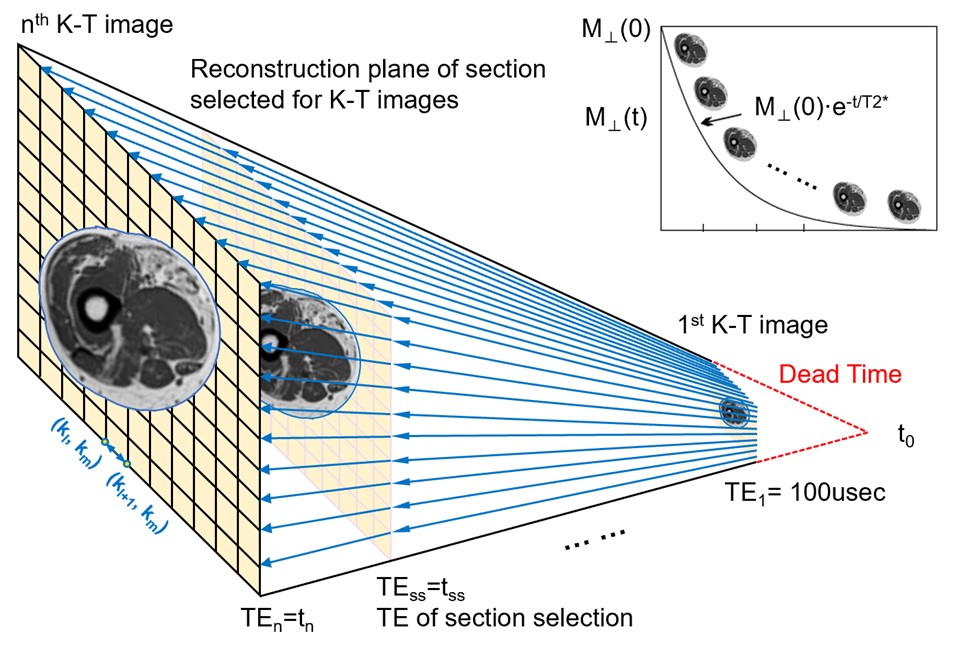
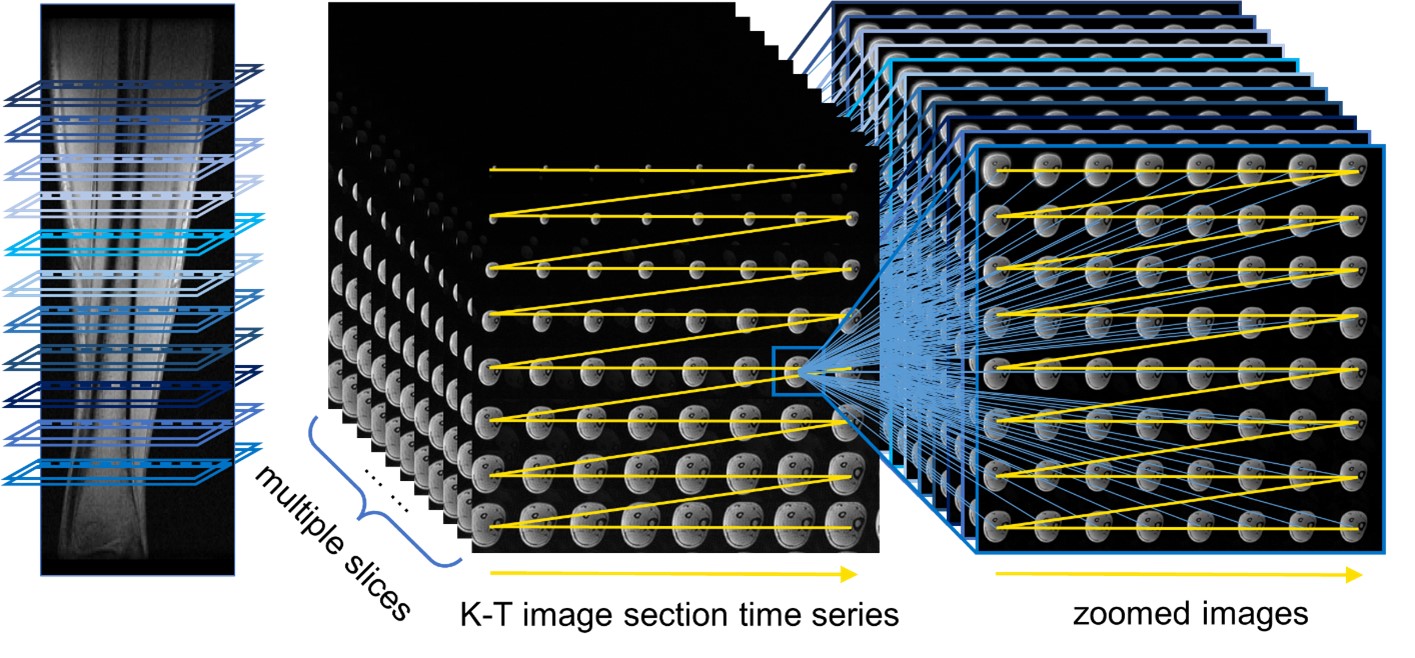
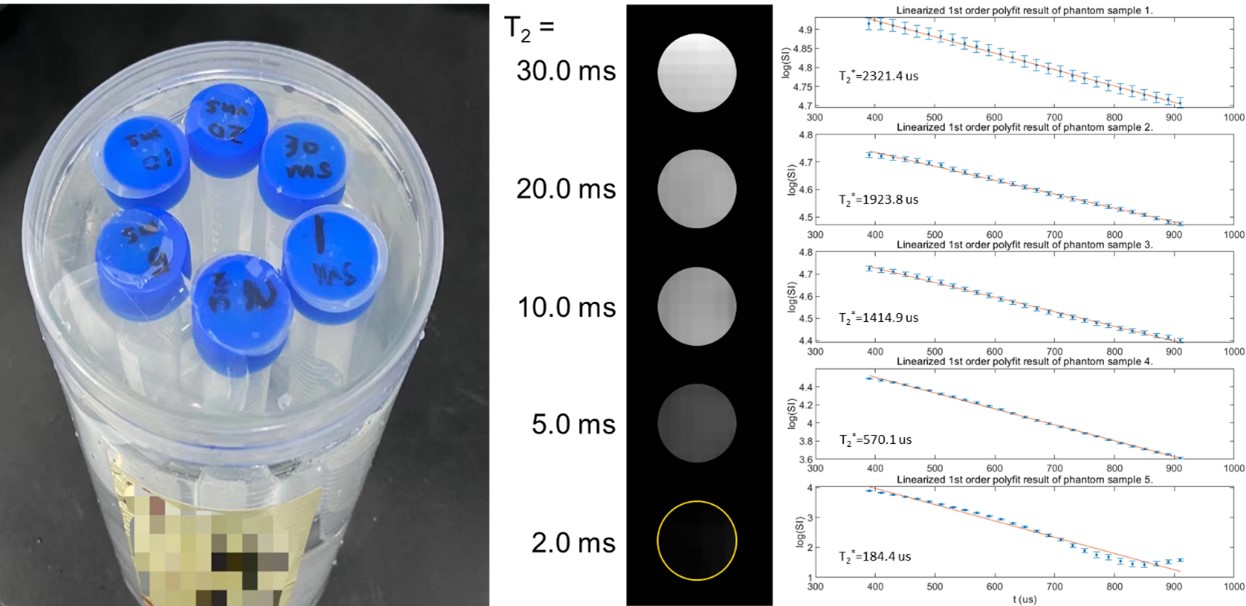
The illustration of KTSSI sequence was shown in Fig.1. It is similar to stack-of-star acquisition, but a 4D K-T space data was aquired. A hard RF pulse was used for excitation. Then, the FID signal was acquired to fill the T-dimension of 4D K-T space. Thus, it acquired one point in the 3D K-space per TR. And the Gx, Gy, Gz gradients varied between different TRs to fill the whole 4D K-T space (See Fig. 1b). For the T-dimention, TEs start from the dead time t0 and ends at the corresponding coordinate point of position in the last (nth) K-T image plane at tn. The acquired 4D data are firstly Fourier-transformed along the Z-direction. After that Fourier transformations, the green box in the image represents the first layer of the Kz direction, which is converted into the first layer of the image. The first layer of K-space in the Z-direction undergoes a two-dimensional Fourier transformation in the X-Y plane, resulting in physical space images along the first layer along the Z-axis (see Fig.2). The images along the T-dimension enlarged with the continuing dephasing due to the presence of the Gx and Gy gradients. A physical space image at a specific TE, which best matches the FOV, is selected as the reference. And other images are resized to the reference slice (see Fig.3 for details). Phantom test was performed on a 1.5T system (iSpace Pro 1.5T, Wandong Medical Technology, China). The T2 relaxation times of Gd-DTPA solution phantoms were 30.0, 20.0, 10.0, 5.0, 2.0 (msec). For in-vivo feasibily assessment, KTSSI-MRI was performed on a 36-years-old health male. Scanning parameters were as follows: TR= 2.85 msec, TE= 110+k∆t (∆t=10, k=1,2,3...) usec, thickness= 4.5mm, in-plane matrix= 192×192, FOV= 96 mm×96 mm, slice number= 42, total scanning time= 8.3 min (with parallel imaging and CS acceleration). After reconstruction, pixelwise T2* maps are fitted from KTSSI images using the exponential decay model.RESULTS
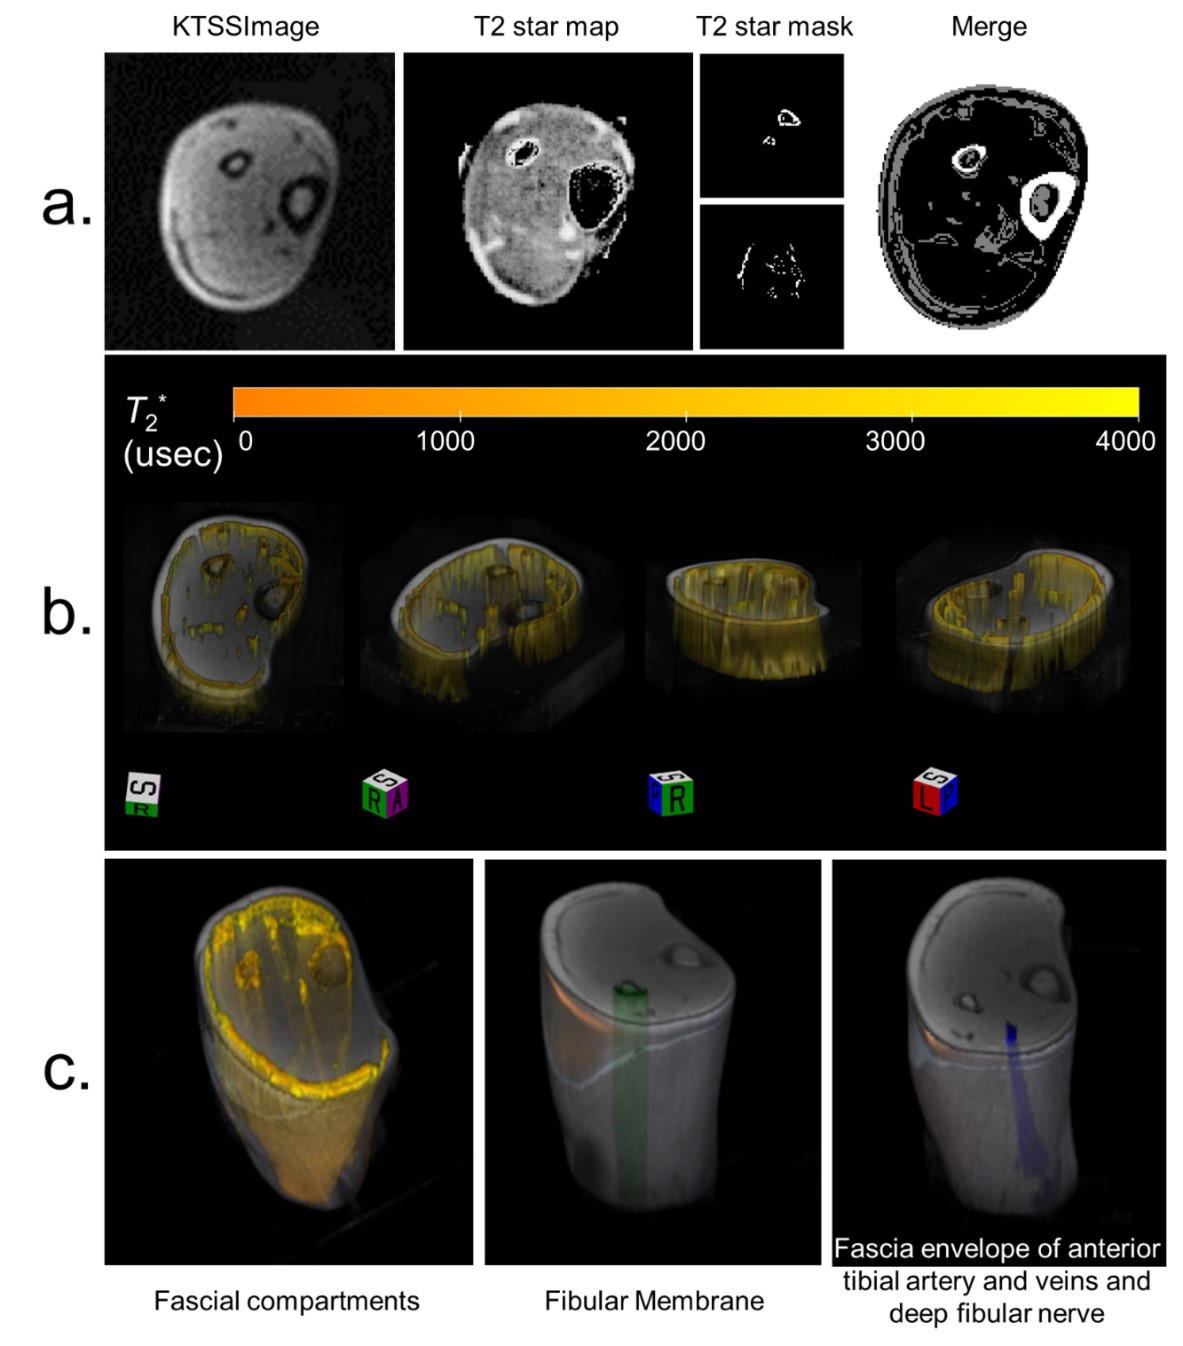
Phantoms with different T2 values were acquired with KTSSI sequence and fitted to have T2* values (see Fig.4). In vivo fascia imaging with KTSSI technique was demonstrated in Fig.5. As it was depicted, 3D-rendered results showed the structure of fascia as a continuum in male leg (Fig.5). Fibular membrane and fascial envelopes have clear boundaries and without artifacts. The T2* value of the deep fascia of the lower leg is majorly at 1000usec to 4000usec. The T2* value of the muscular septum is majorly at 3000usec to 6000usec (ROIs with T2* values exceed 4000usec were not exhibited).DISCUSSION and CONCLUSION
T2* value is dependent on both T2 relaxation time and the non-uniformity of magnetic field. The measured T2* value is the result of loss of phase coherence among spins. The field inhomogeneity is spatially distributed and can be affected by different components of tissues. The edge of skin leads to intrinsic local field variation, so that the fascia under skin was excluded in 3D structure display. Results of proposed KTSSI sequence revealed good image quality on health adult leg and can be used to quantify T2* values of fascial compartments, interosseous membrane, and fascial envelopes that packs arteries, veins, and nerves in and among anterior, posterior, medial and lateral part of leg. T2* value could be a potential biomarker to characterize microstructural tissue features and to diagnosis symptom severity of athletic injuries and evaluate clinical outcome throughout and after the course of therapy.Acknowledgements
This work was supportedby the National Natural Science Foundation of China (No. 61971151).References
1. Benjamin M. The fascia of the limbs and back – a review. J Anat. 2009;214.
2. Ali S Z, Srinivasan S, Peh W C. MRI in necrotizing fasciitis of the extremities [J]. The British Journal of Radiology, 2014, 87(1033): 20130560.
3. Ma Y J, Jerban S, Jang H, et al. Quantitative Ultrashort Echo Time (UTE) Magnetic Resonance Imaging of Bone: An Update [J]. Frontiers in Endocrinology, 2020, 11: 567417.
4. Carl M, Bydder G M, Du J. UTE imaging with simultaneous water and fat signal suppression using a time-efficient multispoke inversion recovery pulse sequence [J]. Magnetic Resonance in Medicine, 2016, 76(2): 577-82.
Figures