4553
Highly efficient simultaneous joint T1-T2 mapping for isotropic resolution 3D knee imaging at 0.55 T1Instituto de Ingeniería BIológica y Médica, Pontificia Universidad Católica de Chile, Santiago, Chile, 2Millenium Institute for intelligent Healthcare Engineering, Santiago, Chile, 3School of Biomedical Engineering and Imaging Sciences, King’s College London, London, United Kingdom, 4Escuela de Ingeniería, Pontificia Universidad Católica de Chile, Santiago, Chile, 5Institute for Advanced Study, Technical University of Munich, Munich, Germany
Synopsis
Keywords: Quantitative Imaging, Low-Field MRI, Quantitative imaging
Motivation: Low-field 0.55T knee imaging promises to provide more accessible assessment of injuries. Anatomic imaging has been evaluated, however quantitative knee imaging at 0.55T has not been demonstrated.
Goal(s): To investigate the feasibility of 3D joint T1-T2 mapping for evaluation of the articular cartilage at 0.55T.
Approach: A free-running, 3D-radial sequence with golden-angle and spoiled gradient echo readout and 1mm3 isotropic resolution was implemented using Pulseq for T1-T2 mapping. Bloch simulations were used for dictionary matching.
Results: The sequence was tested with a standardized phantom, showing good agreement with reference values, and promising results for in-vivo images in healthy subjects in a ~4min scan.
Impact: 3D joint T1-T2 mapping of knee articular cartilage with low-field MRI could provide a fast, more accessible and comprehensive test to assess knee injuries and chronic knee disease.
Introduction
Osteoarthritis is a multi-systemic degenerative disease characterized by structural and biochemical deterioration of the hyaline articular cartilage1. Quantitative MRI techniques (T1-T2 mapping) provide relevant information in the cartilage and are an effective and non-invasive approach to identify early cartilage degeneration2. Also, low-field MRI (0.55 T) is a promising alternative to high-field MRI systems, due to lower costs and reduced off-resonance artifacts. Knee imaging at 0.55T has shown promising results for morphological and pathologic assessment3,4, however 3D quantitative knee imaging at 0.55T has not been demonstrated. The aim of this study is to determine the feasibility of a recently proposed free-running 3D-radial sequence for obtaining simultaneous T1-T2 maps with co-registered anatomical images5, for multi-parametric characterization of articular cartilage at 0.55T with isotropic resolution of 1mm3 in a ~4min scan.Methods
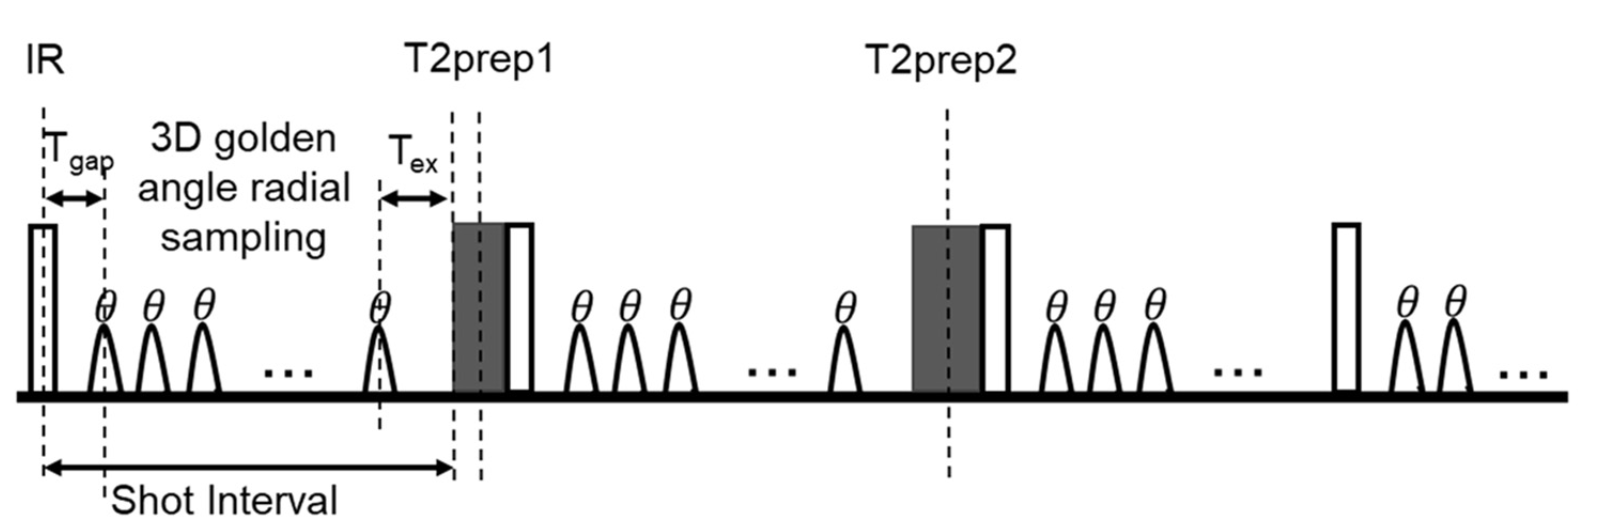
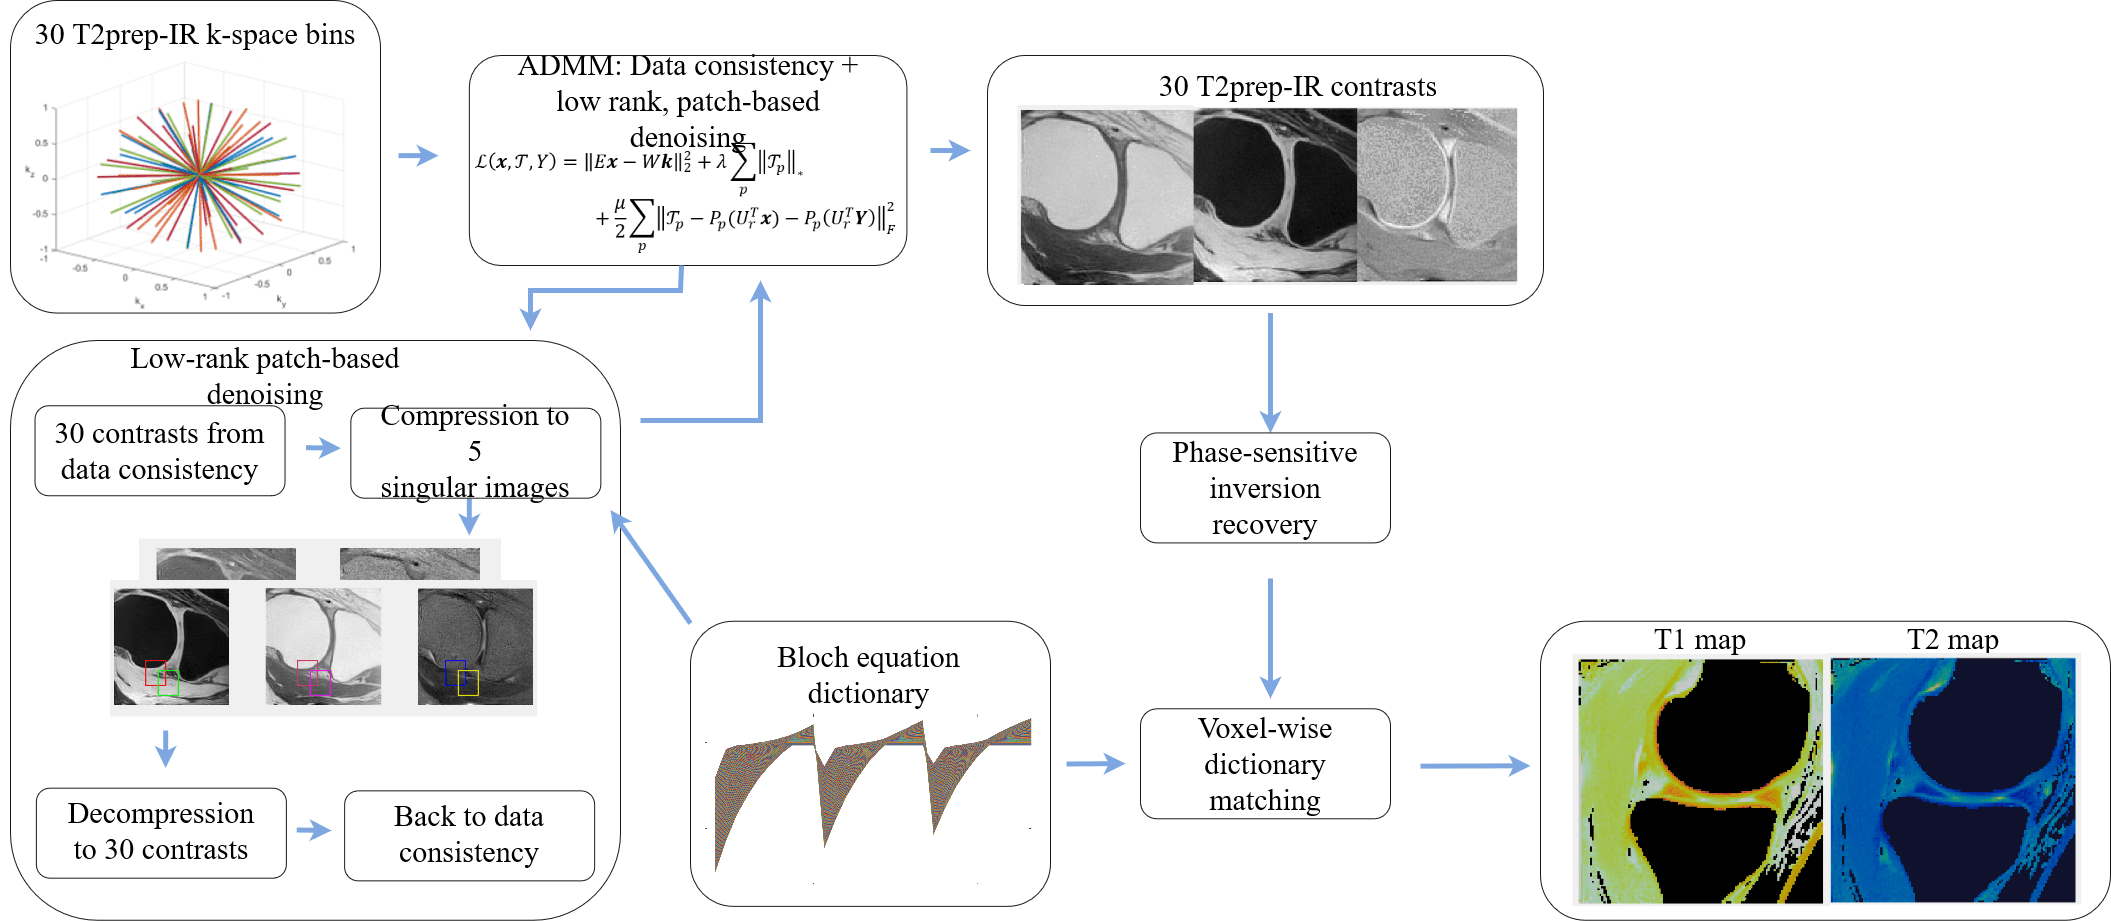
The proposed sequence consists of a spoiled gradient echo readout with 3D golden-angle radial trajectory5. Each shot interval is preceded by an inversion-recovery pulse and T2-prep with varying times of 0ms (no T2-prep), 30ms and 60ms. This acquisition pattern is repeated several times to obtain sufficient data in each contrast bin (Figure 1). The sequence was implemented with Pulseq file format6 on a Siemens scanner.The proposed approach was evaluated on a standardized T1MES phantom10 and in-vivo experiments in three healthy subjects. Acquisitions were performed on a 0.55T scanner (Siemens,FreeMax) with a 12-channel Contour-M coil and a 9-channel Spine coil. Parameters included FOV=120 mm, resolution=1mm3, flip angle 8°, TR/TE=12.9/4.8, 100 repetitions of the sequence. IR-repetition time=2700 ms, scan time=4.5min. After the acquisition, data was binned into 10 different IR times for each IR-T2-prep, resulting in 30 contrasts to be reconstructed. A Bloch-equation dictionary was generated for different T1-T2 values. T1 values varied between 100ms and 2000ms with 2% increment, and values for T2 varied between 2ms and 300ms with 1% increment. The reconstruction of 30 contrasts was performed using L2-norm data consistency and high dimensional patch-based low-rank regularization (HD-PROST)8 on dictionary-based compressed images7. The contrast images were recovered by minimizing the following Lagrangian with ADMM:
$$L(x,T,Y)=‖Ex-Wk‖_2^2+λ∑_p ‖T_p ‖_* +μ/2 ∑_p ‖T_p-P_p (U_r^T x)-P_p (U_r^T Y)‖_F^2$$
Where $$$x∈\mathbb{C}^{NL\times1}$$$ is the multi-contrast image with $$$N$$$ voxels and $$$L$$$ contrasts, $$$k∈\mathbb{C}^{KN_c\times1}$$$ is the k-space data with $$$K$$$ samples and $$$N_c$$$ coils, $$$W$$$ is a k-space density compensation matrix, $$$E=WFS$$$ is the encoding operator with $$$S∈\mathbb{C}^{NN_cL\times NL}$$$ the estimated sensitivity maps, $$$F∈\mathbb{C}^{KN_c\times NN_cL}$$$ the non-uniform Fourier transform. $$$T_p$$$ is the HD-PROST tensor formed with similar patches centered at voxel $$$p$$$, $$$P(\cdot)$$$ is the patch-selecting operator, $$$U_r∈\mathbb{R}^{NL\times Nr}$$$ the compressed signal-evolution dictionary with the highest $$$r$$$ singular values of the dictionary compression, $$$Y$$$ are the augmented Lagrange multipliers, $$$λ$$$ and $$$μ$$$ are regularization parameters, $$$||\cdot||_*$$$, $$$||\cdot||_F$$$ are the nuclear and Frobenius norms.
In each iteration, different contrasts were reconstructed in the data consistency step and were compressed to singular images $$$x_c$$$ for denoising. In the next iteration, the singular images were decompressed by minimizing $$$||U_rx-x_c||_2$$$. A phase-sensitive9 dictionary matching was used to obtain T1-T2 maps. A diagram of the reconstruction is shown in Figure 2.
Results
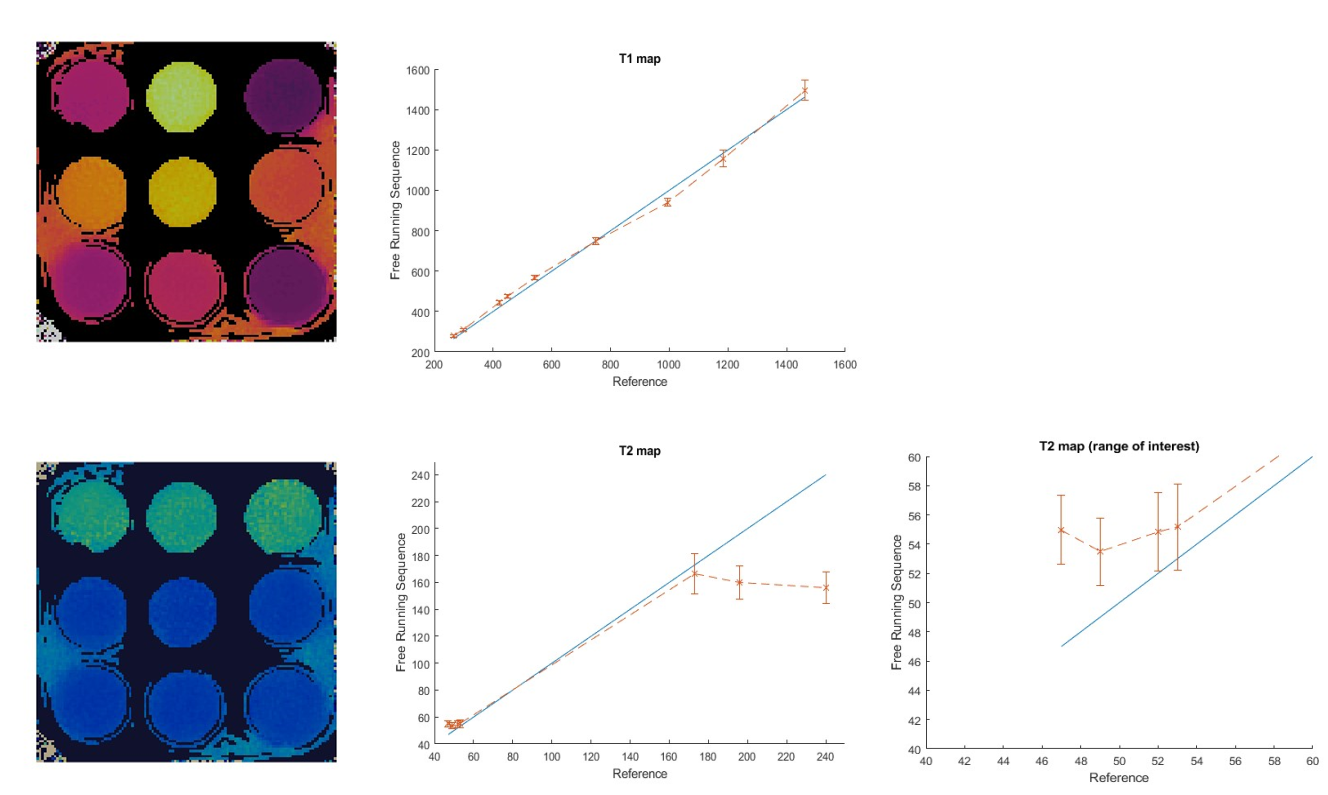
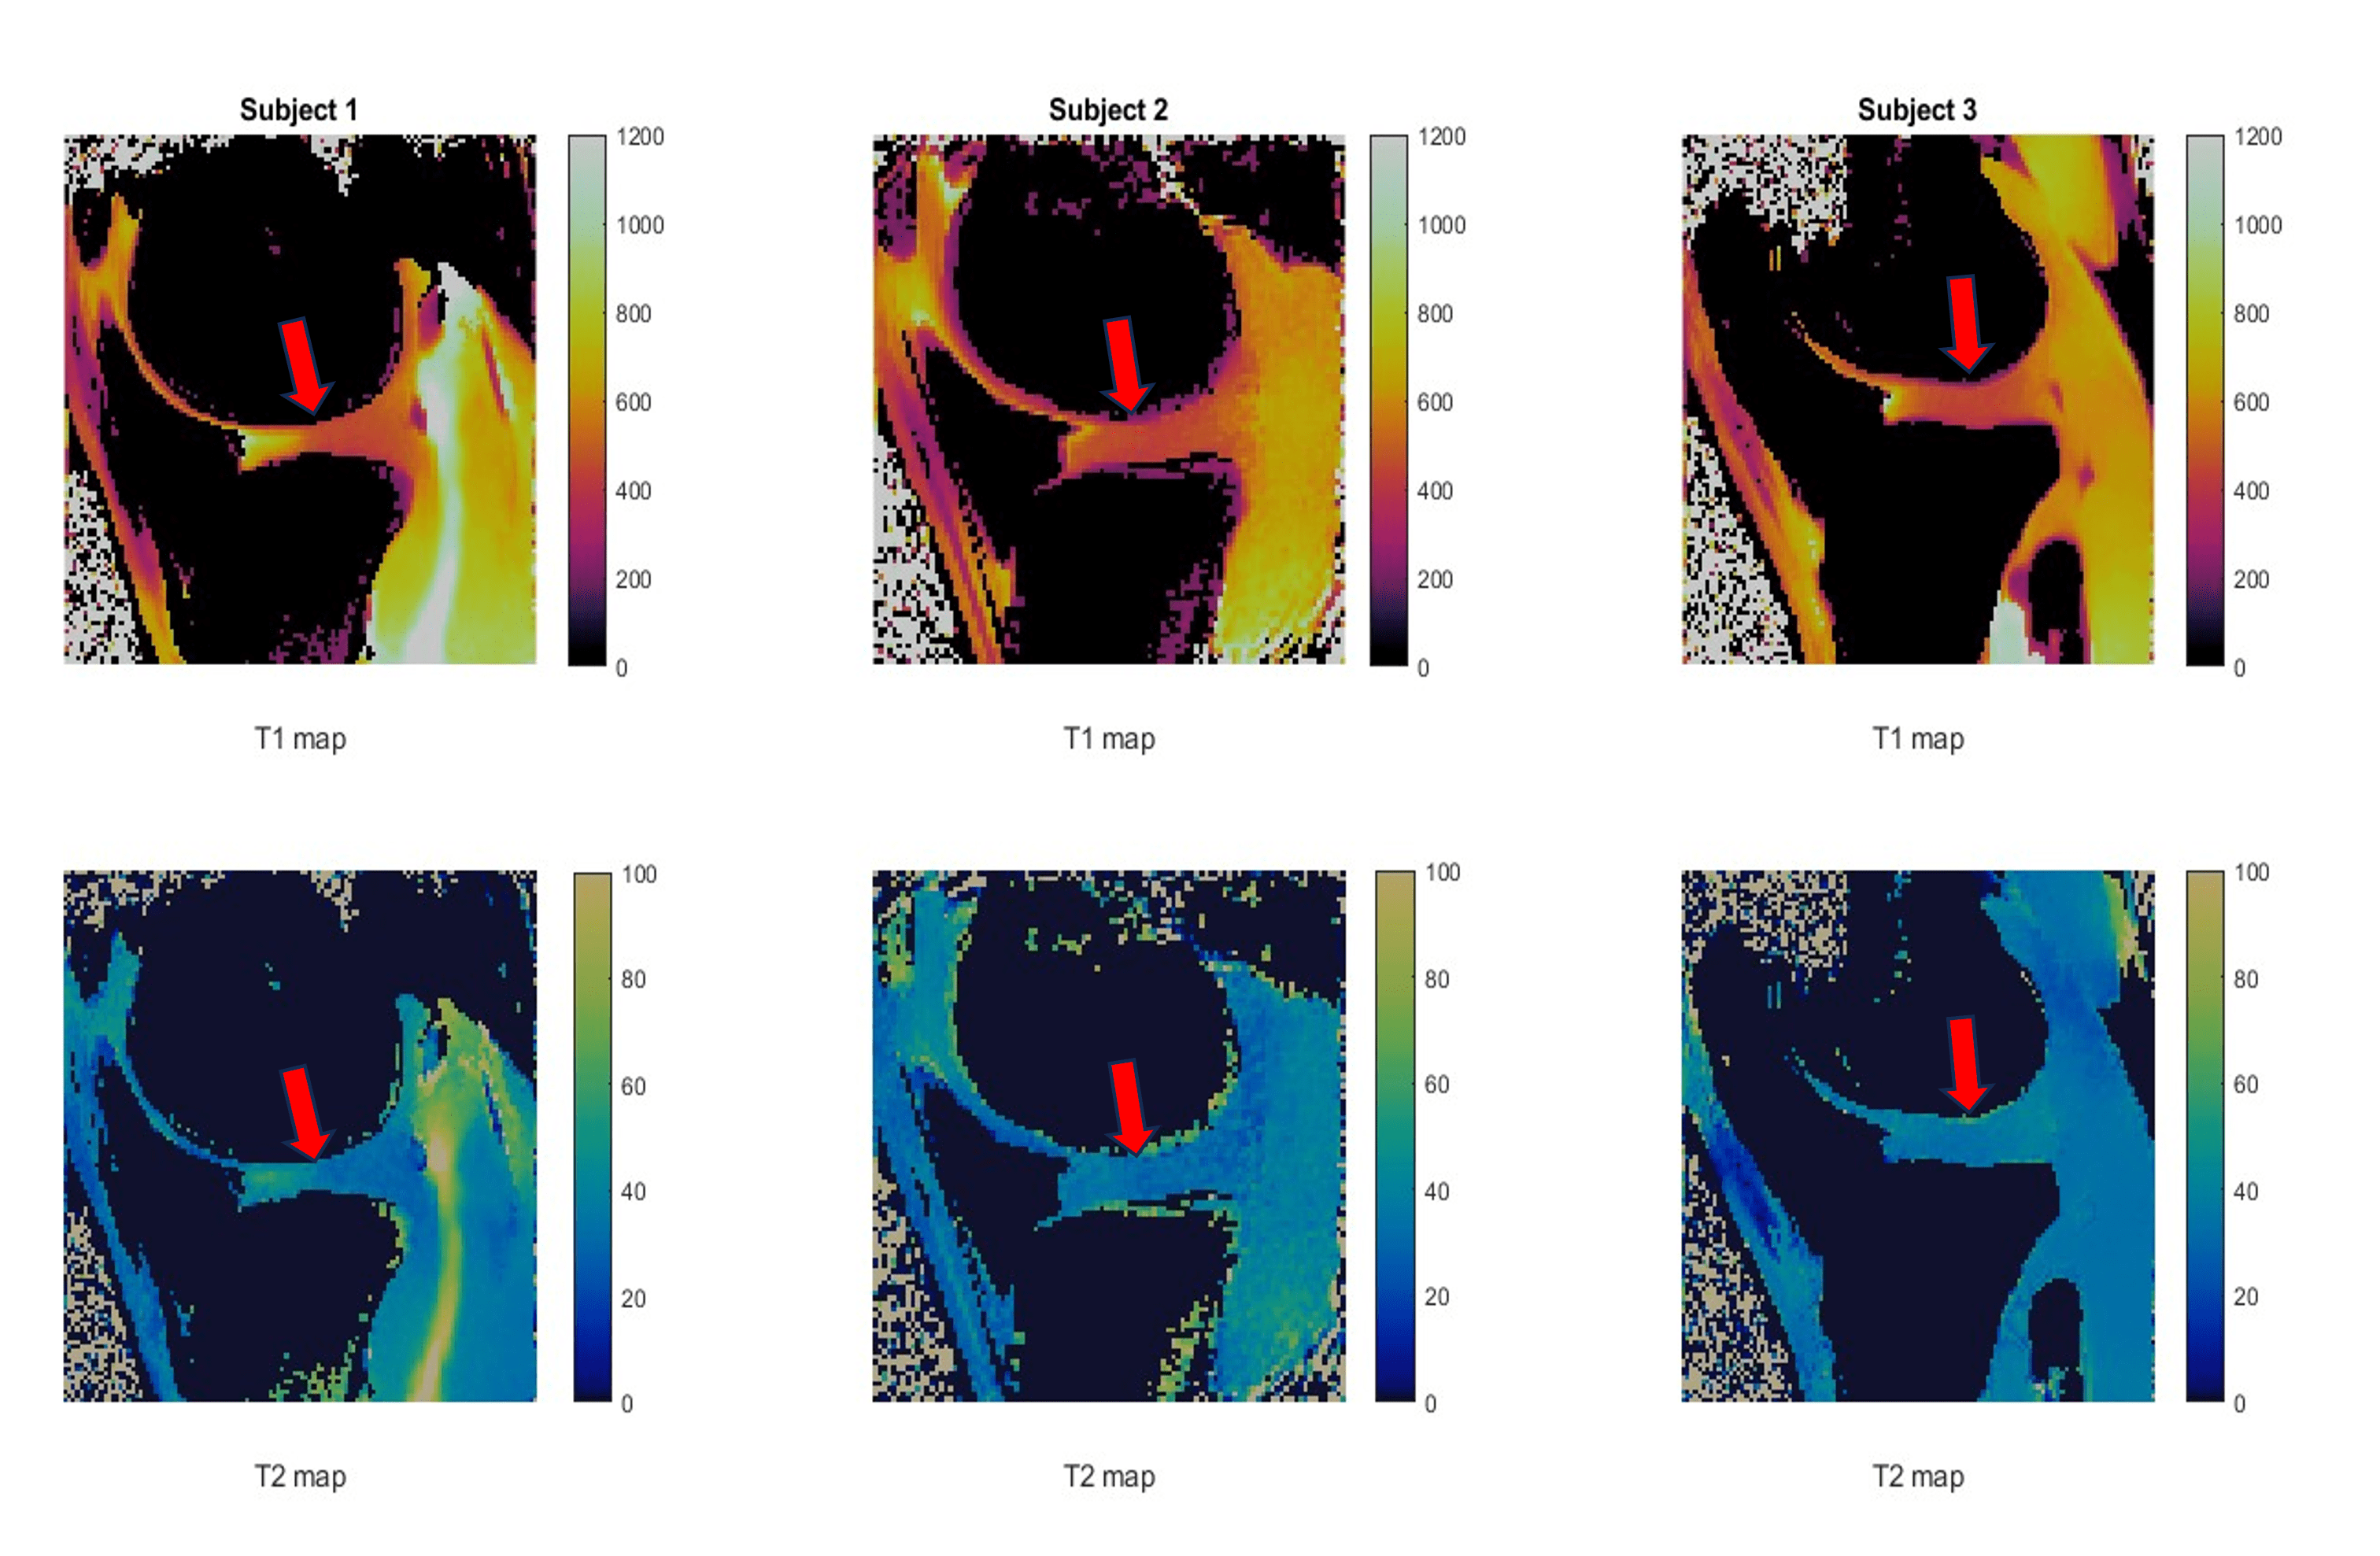
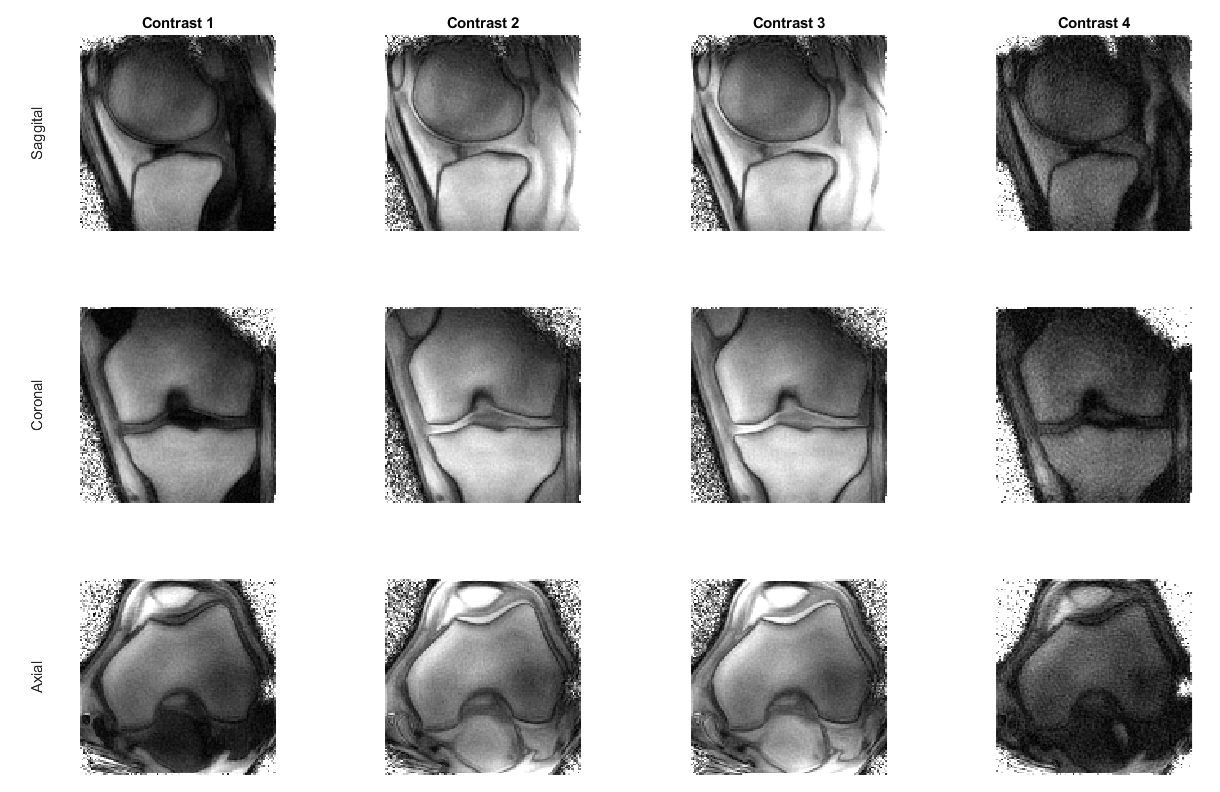
Phantom: A standardized phantom10 was used for testing the sequence. Reconstruction of T1-T2 maps with the proposed sequence compared to spin-echo references are shown in Figure 3, with correlation maps. The T1 maps obtained with the proposed sequence are in good agreement with the reference, for all ranges of testing. T2 values are in good agreement with the reference in the range of interest (50ms) while slightly overestimating lower values. For long values of T2 (over 170ms), the maps are underestimated as expected due to the T2 preparations employed.Subjects: Joint T1-T2 maps for three healthy subjects are shown in Figure 4. Values in the articular cartilage were T1=480±42ms, T2=32±4ms for subject 1, T1=460±48ms, T2=36±4ms in subject 2 and T1=473±33ms, T2=37±3ms in subject 3. No comparison with references were performed as currently no reference T1-T2 values for knee cartilage have been reported at 0.55T, but will be considered in further studies. 30 anatomical contrast images were obtained from the same acquisition and are shown in Figure 5 for one subject.
Conclusion
In this study we demonstrate the feasibility of a novel isotropic free-running 3D-radial joint T1-T2 mapping sequence with co-registered anatomical images for the evaluation of articular cartilage of the knee with a resolution of 1mm3 at 0.55T. Phantom results are in good agreement with references for the range of interest, and in-vivo images show promising results with consistent values between subjects. Further steps will attempt to improve SNR, include water-fat separation and evaluate the proposed approach in more healthy subjects and patients.Acknowledgements
The authors acknowledge financial support from: (1) BHF RG/20/1/34802 (2) EPSRC EP/V044087/1 (3) ANID Millennium Institute iHEALTH, ICN2021_004; Fondecyt 1210637 and 1210638; Fondequip Mayor EQY210003; Basal Funding, IMPACT, FB210024 and (6) the Technical University of Munich – Institute for Advanced Study.References
1. Mobasheri, A., & Batt, M. E. (2016). An update on the pathophysiology of osteoarthritis. Annals of physical and rehabilitation medicine, 59(5-6), 333-339. https://doi.org/10.1016/j.rehab.2016.07.004
2. Mittal, S., Pradhan, G., Singh, S., & Batra, R. (2019). T1 and T2 mapping of articular cartilage and menisci in early osteoarthritis of the knee using 3-Tesla magnetic resonance imaging. Polish Journal of Radiology. https://doi.org/10.5114/pjr.2019.91375
3. Schmidt, I., Haag, N., Shahzadi, I., Frohwein, L. J., Schneider, C. M., Niehoff, J. H., Kroeger, J. R., Borggrefe, J., & Moenninghoff, C. (2023). Diagnostic image quality of a Low-Field (0.55T) knee MRI protocol using deep learning image reconstruction compared with a standard (1.5T) knee MRI protocol. Journal of Clinical Medicine, 12(5), 1916. https://doi.org/10.3390/jcm12051916
4. Donners, R., Vosshenrich, J., Gutzeit, A., Bach, M., Schlicht, F., Obmann, M. M., Harder, D., & Breit, H. (2023). New-Generation 0.55 T MRI of the Knee—Initial clinical experience and comparison with 3 T MRI. Investigative Radiology. https://doi.org/10.1097/rli.0000000000001016
5. Qi H, Bustin A, Cruz G, Jaubert O, Chen H, Botnar RM, Prieto C. Free-running simultaneous myocardial T1/T2 mapping and cine imaging with 3D whole-heart coverage and isotropic spatial resolution. Magn Reson Imaging. 2019 Nov; 63:159-169.
6. Layton, K. J., Kroboth, S., Jia, F., Littin, S., Yu, H., Leupold, J., Nielsen, J. F., Stöcker, T., & Zaitsev, M. (2016). PulSeQ: a rapid and hardware-independent pulse sequence prototyping framework. Magnetic Resonance in Medicine, 77(4), 1544-1552. https://doi.org/10.1002/mrm.26235
7. McGivney DF, Pierre E, Ma D, Jiang Y, Saybasili H, Gulani V, Griswold MA. SVD compression for magnetic resonance fingerprinting in the time domain. IEEE Trans Med Imaging. 2014 Dec;33(12):2311-22.
8. Bustin A, Lima da Cruz G, Jaubert O, Lopez K, Botnar RM, Prieto C. High-dimensionality undersampled patch-based reconstruction (HD-PROST) for accelerated multi-contrast MRI. Magn Reson Med. 2019 Jun;81(6):3705-3719.
9. Kellman P, Arai AE, McVeigh ER, Aletras AH. Phase-sensitive inversion recovery for detecting myocardial infarction using gadolinium-delayed hyperenhancement. Magn Reson Med. 2002 Feb;47(2):372-83.
10. Captur G, Gatehouse P, Keenan KE, Heslinga FG, Bruehl R, Prothmann M, Graves MJ, Eames RJ, Torlasco C, Benedetti G, Donovan J, Ittermann B, Boubertakh R, Bathgate A, Royet C, Pang W, Nezafat R, Salerno M, Kellman P, Moon JC. A medical device-grade T1 and ECV phantom for global T1 mapping quality assurance-the T1 Mapping and ECV Standardization in cardiovascular magnetic resonance (T1MES) program. J Cardiovasc Magn Reson. 2016 Sep 22;18(1):58. doi: 10.1186/s12968-016-0280-z. PMID: 27660042; PMCID: PMC5034411.
Figures