4552
Predicting post-hepatectomy liver failure with whole-liver histogram analysis on T1 maps of gadoxetic acid-enhanced MRI1Zhongshan Hospital of Fudan University, Shanghai, China, 2Siemens Shenzhen Magnetic Resonance Ltd., Shenzhen, China, 3Siemens Heathineers AG., Erlangen, Germany
Synopsis
Keywords: Quantitative Imaging, Liver, MRI, gadoxetic acid, hepatic insufficiency, indocyanine green
Motivation: Current clinical modalities still have several limitations for accurately predicting post-hepatectomy liver failure (PHLF).
Goal(s): To explore more effective non-invasive tools to quantitatively predict PHLF.
Approach: The performances of the hematological tests, the indocyanine green (ICG) clearance test and the newly-based albumin-bilirubin (ALBI) scoring system for predicting PHLF were compared with that of whole-liver histogram analysis on gadoxetic acid-enhanced T1 maps.
Results: Whole-liver histogram analysis on gadoxetic acid-enhanced T1 maps had a better performance than the ICG clearance test and ALBI scoring system. It also showed potential for stratifying preoperative liver function.
Impact: The histogram parameters extracted from whole-liver regions of interest (ROI) on gadoxetic acid-enhanced T1 maps were proved to be effective and non-invasive tools for assessing liver function. Further accurate liver function assessment based on sectional histogram analysis is promising.
Introduction
This study aimed to explore the potential of whole-liver histogram analysis on gadoxetic acid-enhanced T1 maps for predicting post-hepatectomy liver failure (PHLF) in patients who underwent partial hepatectomy and to compare with the indocyanine green (ICG) clearance test and the newly-based albumin-bilirubin (ALBI) scoring system.Methods
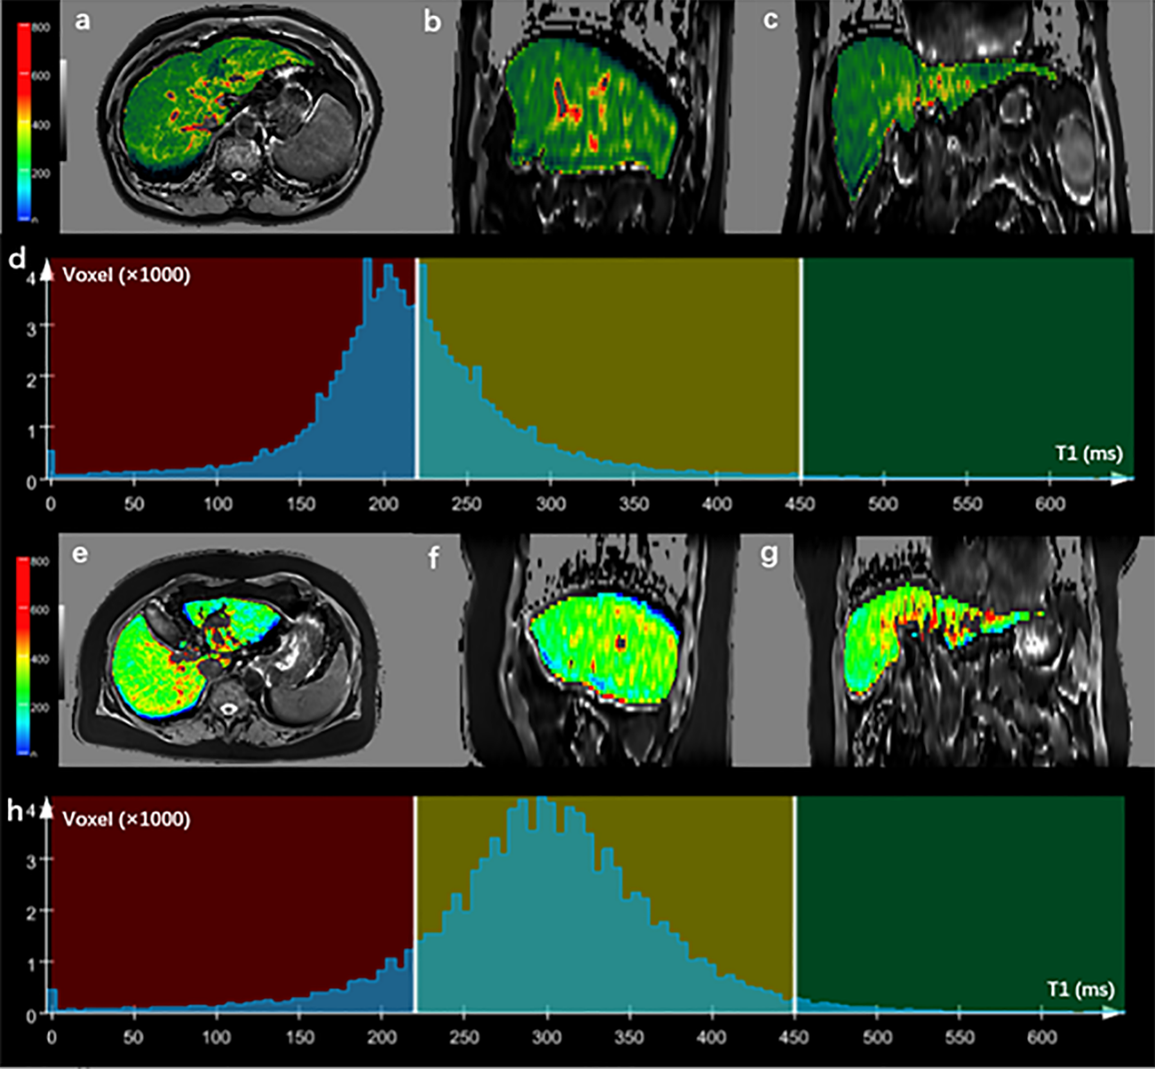
101 consecutive patients who underwent gadoxetic acid-enhanced MRI examinations on a 1.5T MRI scanner (MAGNETOM Aera, Siemens Healthineers, Erlangen, Germany) were retrospectively collected. The inclusion criteria were as follows: 1) underwent liver resection; 2) underwent gadoxetic acid-enhanced MRI including T1 mapping within four weeks before the surgery; 3) had ICG clearance test and an albumin and bilirubin test before the surgery; and 4) had an international normalized ratio (INR) and bilirubin examination on or after postoperative day five. The exclusion criteria were: 1) patients who had undergone non-resection treatment; 2) patients whose images had severe respiratory motion artifacts. 37 patients were enrolled. T1 mapping was performed before and 20 minutes (hepatobiliary phase, HBP) after a bolus injection of gadoxetic acid (Primovist: Bayer Schering Pharma, Berlin, Germany) using a volumetric interpolated breath-hold examination (VIBE) sequence with flip-angles of 2° and 12°. Other parameters of T1 mapping were as follows: repetition time/echo time, 4.36 msec/1.93 msec, matrix, 288 × 216, field of view, 380 × 285 mm, 22.4 cm slab thickness with an interpolated 4.0-mm slice thickness, and bandwidth, 400 Hz/pixel. In addition, a parallel imaging technique (acceleration factor of 2) was performed with generalized auto-calibrating partially parallel acquisition (GRAPPA). Quantitative T1 maps were automatically reconstructed on a voxel-by-voxel basis after data acquisition by the MapIt processing tool (Siemens Healthcare, Erlangen, Germany). Whole-liver histogram analysis of T1 maps on pre-contrast (T1pre) and HBP (T1HBP) were performed using the research application MR Multiparametric Analysis software (Siemens Healthcare) (Figure 1). The differences between patients with and without PHLF were compared for univariate analysis. A multivariate binary logistic regression analysis was used to identify independent predictors for PHLF. Pearson or Spearman analysis was used to evaluate the correlation of histogram analysis-extracted parameters of the T1 map to the ICG test and ALBI scoring system. The diagnostic performance of each parameter was tested via receiver operating characteristic (ROC) analysis. The DeLong test [1] was used to compare the area under the curve (AUC) for diagnostic accuracy. P < 0.05 was considered statistically significant.Results
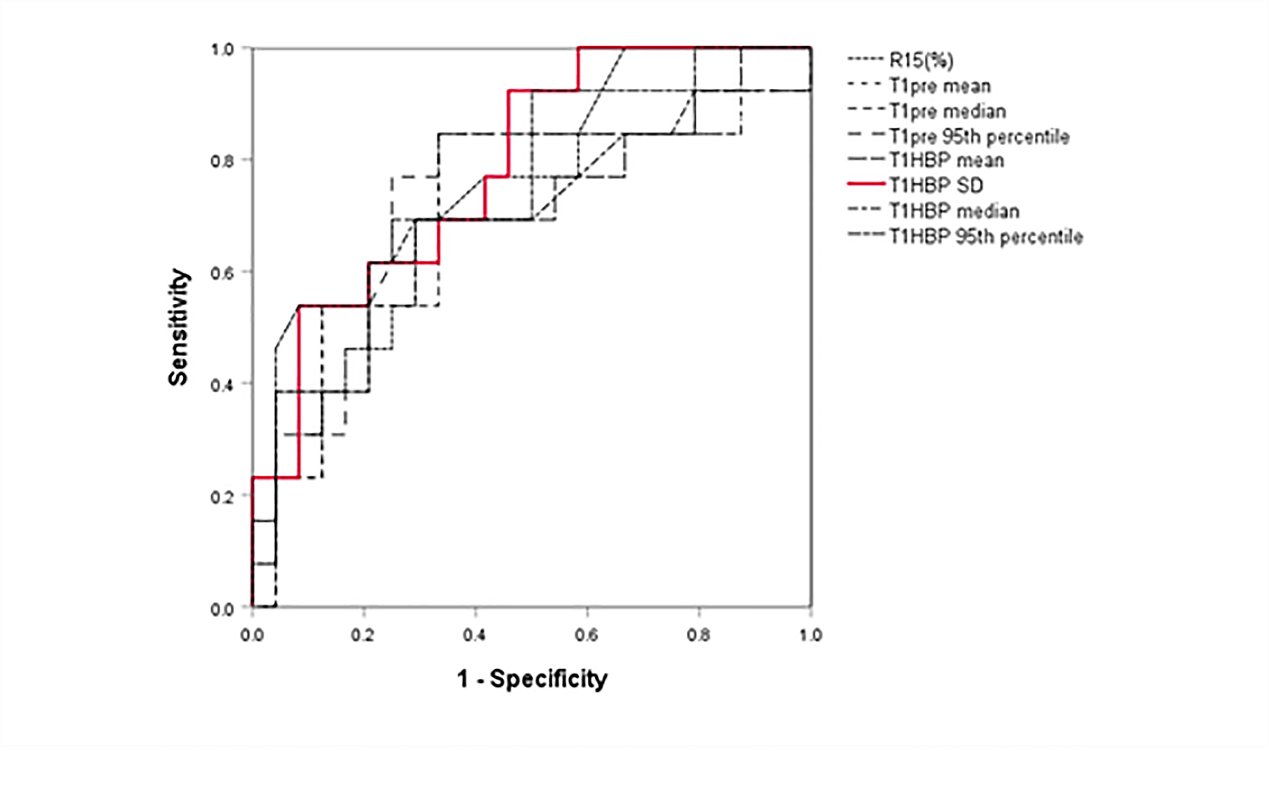
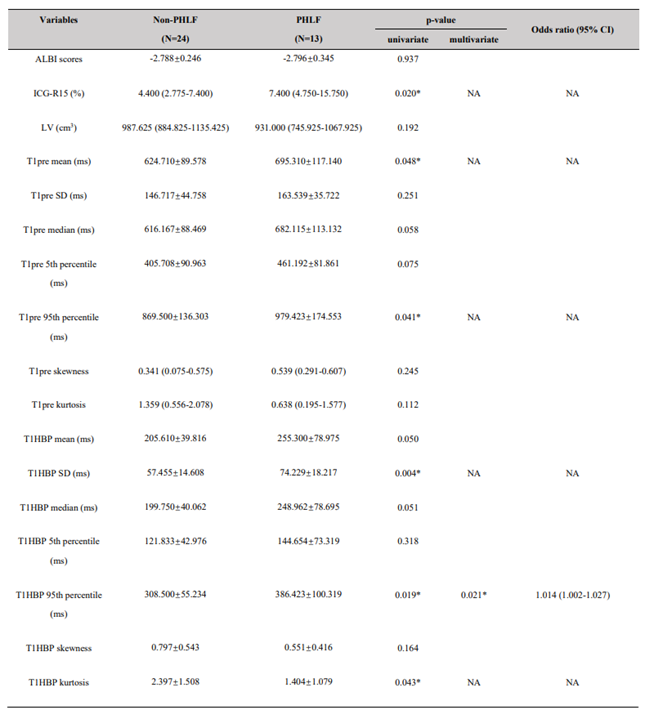
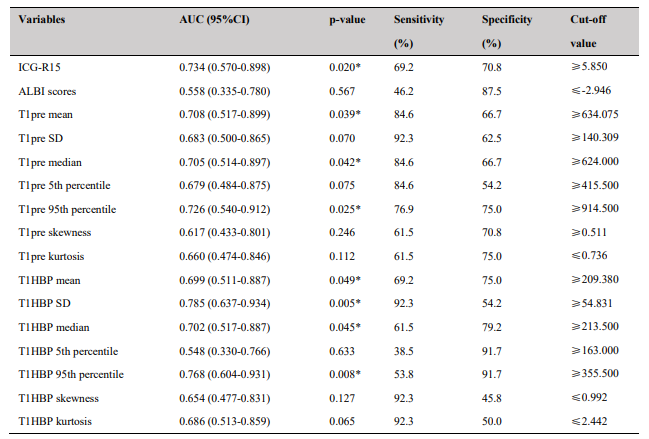
35.1% (13/37) of patients developed PHLF. T1pre mean, T1pre 95th percentile, T1HBP SD, T1HBP 95th percentile, T1HBP kurtosis, and ICG-R15 showed statistically significant differences between the PHLF and non-PHLF groups (all p < 0.05), whereas the ALBI scores showed no statistically significant differences between the two groups (p = 0.937) (Table 1). T1HBP SD showed the best diagnostic performance with an AUC of 0.785 (Figure 2 and Table 2). Multivariate analysis showed that a higher T1HBP 95th percentile was the independent predictor for PHLF (p < 0.05; OR = 1.014) (Table1). In addition, T1HBP mean and T1HBP median showed the best significant correlation to the ICG test and ALBI scoring systems.Discussion
Gadoxetic acid-enhanced MRI is routinely used to evaluate the hepatic function of patients with focal liver lesions before hepatectomy. The process of the histogram analysis, based on the automatic liver segmentation provided by the MR Multiparametric Analysis software was easier to implement and understand than the higher-order texture analysis methods. We also found that the AUCs of T1HBP SD and T1HBP 95th percentile were more significant than those of ICG-R15 and ALBI scores. Higher T1HBP 95th percentile was the independent predictor for PHLF. It demonstrated the superiority of the histogram analysis based on gadoxetic acid-enhanced T1 mapping over the ICG clearance test and ALBI scoring system in differentiating the PHLF risks. The results showed that T1HBP mean, T1HBP median, and T1HBP 95th percentile were significantly correlated with the ICG clearance test (Rho: 0.758 - 0.818, P < 0.0001), which suggested the potential of histogram parameters for preoperative liver function stratification.Conclusion
Whole-liver histogram analysis on the gadoxetic acid-enhanced T1 maps is a potential candidate for preoperative prediction and risk stratification of PHLF, which outperformed the ICG clearance test and ALBI scoring system.Acknowledgements
We greatly appreciate the support from the National Science Foundation for Young Scientists of China (Grant No. 81701682) and Shanghai Municipal Key Clinical Specialty (shslczdzk03202).References
1. Elizabeth R. DeLong, D.M.D., and and D.L. Clarke-Pearson, Comparing the Areas Under Two or More Correlated Receiver Operating Characteristic Curves: A Nonparametric Approach. Biometrics, 1988. 44: p. 837-845.Figures