4550
Influence of temporal resolution in determining pharmacokinetic parameters from CAIPIRINHA-Dixon-TWIST-VIBE DCE-MRI for breast lesions1Radiology, Fudan University Shanghai Cancer Center, Shanghai, China, 2Oncology, Shanghai Medical College, Fudan University, Shanghai, China, 3MR Applications Development, Siemens Shenzhen Magnetic Resonance Ltd., Shenzhen, China, 4MR Application Predevelopment, Siemens Healthineers AG, Erlangen, Germany
Synopsis
Keywords: Quantitative Imaging, Breast
Motivation: The quantitative parameters from dynamic contrast-enhanced (DCE) MRI can improve the diagnosis in characterizing breast cancer.
Goal(s): However, the influence of temporal resolution in determining pharmacokinetic parameters is still unclear.
Approach: In this study, we aimed to evaluate influence of scan temporal resolution on pharmacokinetic parameters and performance in diagnosing breast cancer.
Results: The results demonstrated that as temporal resolution decreases, Ktrans, kep, and ve increase, and there were no significant differences in AUCs in diagnosing breast cancer for any of the parameters.
Impact: This study transforms breast cancer diagnosis by validating the influence of temporal resolution in determining pharmacokinetic parameters. It encourages exploration into broader adaptations, aiming to provide the accurate pharmacokinetic quantitative parameters in the diagnosing cancer and assessing prognosis across multi-institutions.
Keywords
breast cancer, CAIPIRINHA-Dixon-TWIST-VIBE, dynamic contrast-enhanced MRI, population-based AIF, pharmacokinetic parametersIntroduction
The dynamic contrast-enhanced (DCE) pharmacokinetic compartment model measures capillary permeability and leakage space, which shows benefit in diagnosing breast cancer1. Recently, CAIPIRINHA-Dixon-TWIST-VIBE (CDTV) with a high acceleration factor and k-space view-sharing technique has been used in ultrafast DCE-MRI, and this technique can improve temporal resolution with preserved spatial resolution in breast imaging2. However, the influence of scan temporal resolution on pharmacokinetic parameters, is still unclear. In this study, we aimed to evaluate scan temporal resolution on pharmacokinetic parameters and the diagnostic accuracies of breast cancer.Methods
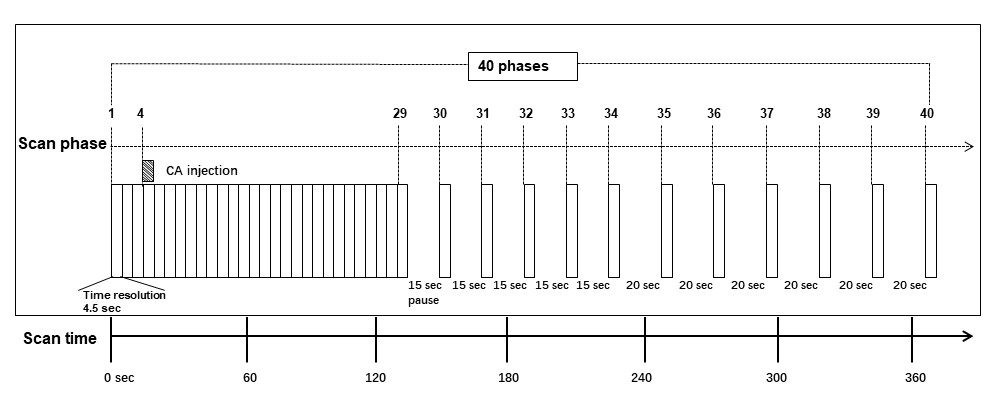
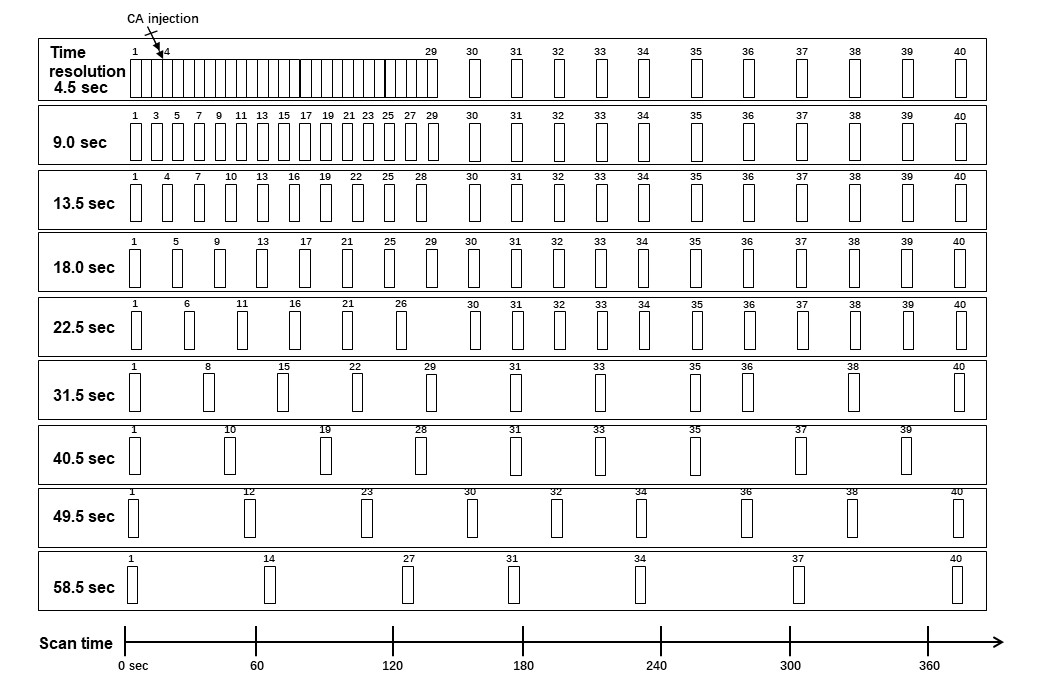
In this study, we prospectively included 89 women (mean age, 50 years; age range, 22-76 years) with 97 lesions (76 malignant, 21 benign) between October 2019 and February 2020 from our site. Diagnosis was confirmed by either ultrasound-guided core biopsy (n = 18) or surgical resection (n = 79). Breast MRI examinations were performed using a MAGNETOM Skyra 3.0 T MRI scanner (Siemens Healthineers, Erlangen, Germany). CDTV-DCE consisted of B1 mapping, T1 mappinge, and multiple-phase dynamic scan with CDTV sequence. The dynamic scan acquisition was performed with the following parameters: 3D Dixon VIBE sequence; TR/TE = 4.10/1.24, 2.47 ms; FA =13°; FOV = 360×360 mm2; matrix = 320×320; time-resolved angiography with interleaved stochastic trajectories (TWIST) region A/B = 20% / 25%; slice thickness = 2.1 mm; slice gap = 0 mm; number of slices = 64; acceleration factor = 4 (CAIPIRINHA); acquisition time = 6 min 23 s (40 phases, highest temporal resolution: 4.5 s/phase). CDTV dynamic scan acquisition was obtained three times before and 37 times after a rapid bolus of contrast agent (Figure 1).The CDTV data were subsequently down-sampled to temporal resolution in the range of 9.0 sec to 58.5 sec, using a strategy that takes sets of dynamic phases and discards the rest (Figure 2). The corresponding temporal resolution were 4.5 sec, 9.0 sec, 13.5 sec, 18.0 sec, 22.5 sec, 31.5 sec, 40.5 sec, 49.5 sec, and 58.5 sec. These DCE-derived pharmacokinetic parameters, including Ktrans, kep, and ve, were calculated based on the two-compartment Tofts model3, population-averaged arterial input function (AIF)4 and inline T1 mapping by using a research application software (MR DCE, Siemens Healthineers, Erlangen, Germany) . The Tofts model was solved by using a dictionary-based lookup method to fasten the calculation. The quantitative maps, as well as the 1-minute postcontrast images were imported to syngo.via software (Siemens Healthineers, Erlangen, Germany) for data analysis. The 2D ROIs were manually drawn in the slice with the largest extent of the lesion on the 1-minute postcontrast phase. The 2D ROIs were then propagated to the quantitative maps. The mean value of the parameters within the ROIs was automatically calculated and displayed. Paired t-test with Bonferroni correction, and ROC curves were used for statistical analysis.
Results
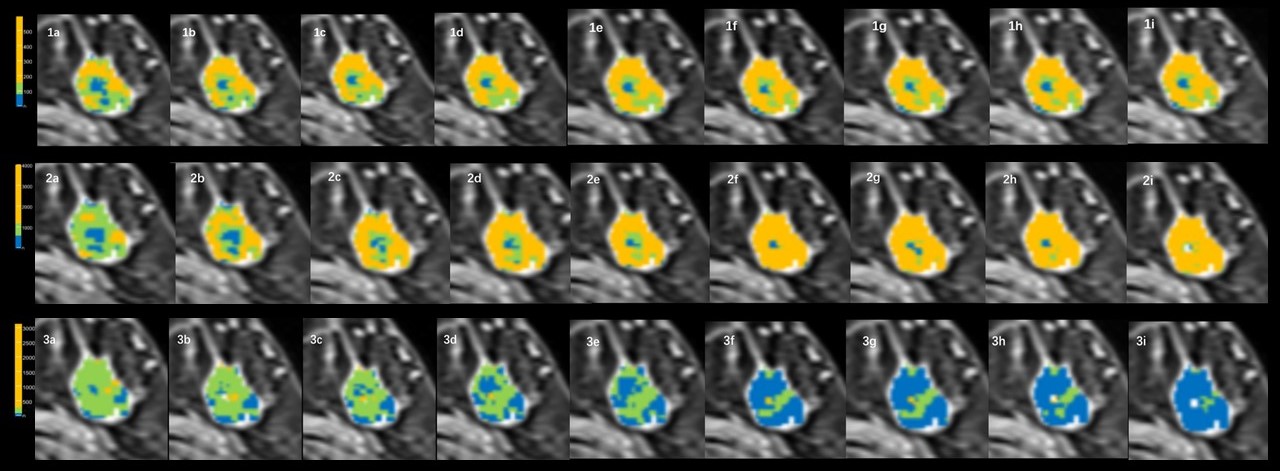
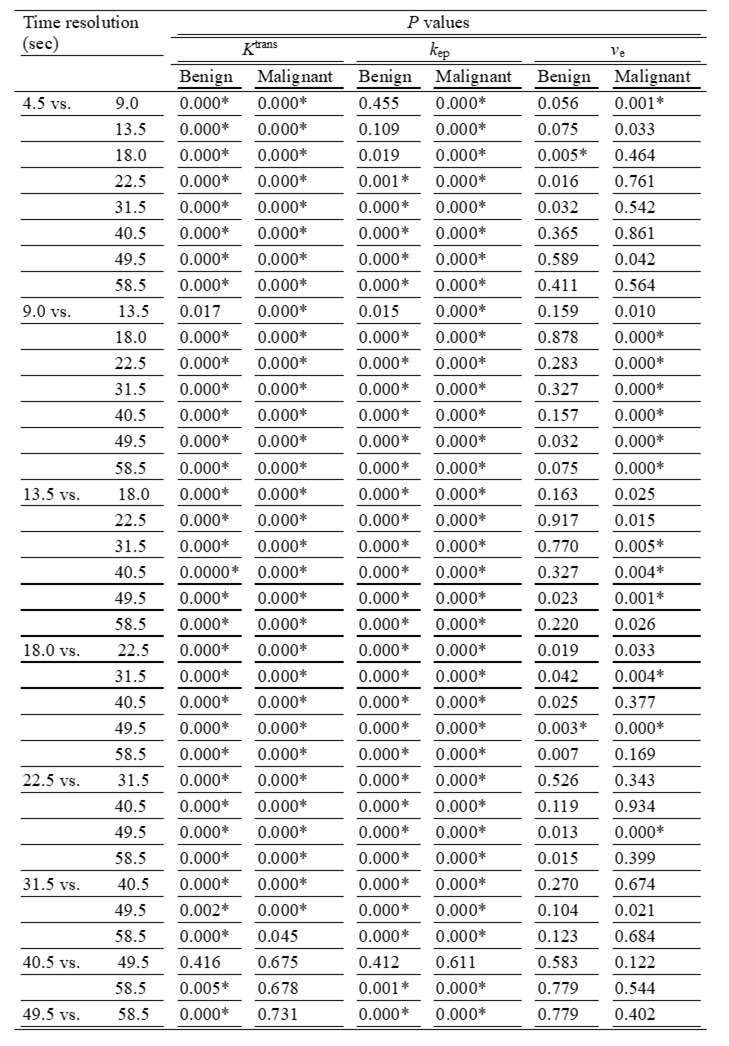
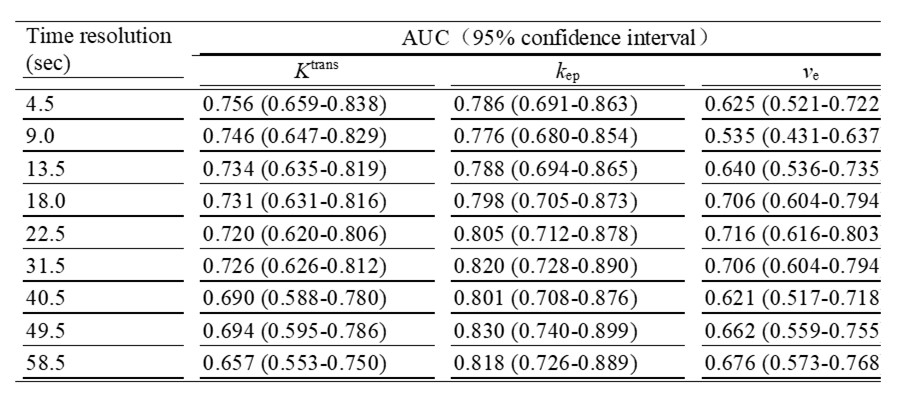
As temporal resolution decreased from 4.5 sec/phase, Ktrans, kep, and ve increased significantly in values. kep demonstrated a slight variation in AUC with decreasing temporal resolution, with AUC ranging from 0.776 to 0.830. For Ktrans, the AUC gradually decreased with decreasing temporal resolution, with the highest AUC value of 0.756 at 4.5 sec/phase and the lowest AUC value of 0.657 at 58.5 sec/phase. Regarding ve, the AUC varied in an irregular way with the highest AUC of 0.716 at 22.5 sec/phase and the lowest AUC of 0.535 at 9.0 sec/phase. There was no significant difference among AUC pairs for the nine sets of Ktrans, kep and ve (corrected P > 0.05). The AUCs for the different temporal resolution are shown in Table 2. Example parametric maps with different temporal resolution from one patient data set are demonstrated in figure 3.Discussion
The use of a population-based AIF reduces variability and improves reproducibility of DCE-MRI pharmacokinetic parameters3. Our results demonstrated as temporal resolution decreases, Ktrans, kep, and ve increase. We also demonstrated that there was no significant difference among AUC pairs for the nine sets of Ktrans, kep and ve. Thus, our results suggest that the temporal resolution should be kept the same in the multi-center studies performing pharmacokinetic analysis with population-based AIF.Conclusion
Our results showed that the scan temporal resolution has a significant impact on pharmacokinetic parameters, but the diagnostic ability may not be significantly affected. Further study with a larger sample size is required to validate our findings.Summary of Main Findings
This study showed that scan temporal resolution has a significant impact on pharmacokinetic parameters based on average population-based AIF from CDTV DCE-MRI. However, the use of pharmacokinetic parameters from different temporal resolution in characterizing breast lesions have similar performance.Acknowledgements
No.References
1. Rahmat K, Mumin NA, Hamid MTR, Hamid SA, Ng WL (2022) MRI Breast: Current Imaging Trends, Clinical Applications, and Future Research Directions. Curr Med Imaging 18:1347-1361
2. Sun K, Zhu H, Chai W et al (2020) Whole-lesion histogram and texture analyses of breast lesions on inline quantitative DCE mapping with CAIPIRINHA-Dixon-TWIST-VIBE. Eur Radiol 30:57-65
3. Parker GJ, Roberts C, Macdonald A et al (2006) Experimentally-derived functional form for a population-averaged high-temporal-resolution arterial input function for dynamic contrast-enhanced MRI. Magn Reson Med 56:993-1000
4. Fritz-Hansen T, Rostrup E, Larsson HB et al (1996) Measurement of the arterial concentration of Gd-DTPA using MRI: a step toward quantitative perfusion imaging. Magn Reson Med 36: 225-31.
Figures