4547
A Novel Renal 3D Saturation Recovery T1 Mapping readout by GRASE (3D-SR-GRASE)1School of Biomedical Engineering, Southern Medical University, Guangzhou, China, 2Guangdong Provincial Key Laboratory of Medical Image Processing, Southern Medical University, Guangzhou, China, 3Guangdong Provincial Engineering Laboratory for Medical Imaging and Diagnostic Technology, Southern Medical University, Guangzhou, China, 4Department of Rehabilitation Medicine, Zhujiang Hospital, Southern Medical University, Guangzhou, China, 5Medical Imaging Center, Nanfang Hospital, Southern Medical University, Guangzhou, China, 6Philips Healthcare, Guangzhou, China, 7Philips Healthcare, Shenzhen, China
Synopsis
Keywords: Quantitative Imaging, Quantitative Imaging
Motivation: Renal T1 mapping has been explored as a tool to visualize localized and diffuse renal diseases. 2D-MOLLI imaging have limited coverage, and 3D imaging are currently focused on cardiac imaging and with long acquisition time.
Goal(s): In this study, we aimed to propose a fast 3D T1 mapping sequence for kidney.
Approach: A saturate-recovery(SR) pulse, followed by 3D-GRASE readout, is used for T1 mapping. We also verified its effectiveness in T1 mapping for phantom and normal volunteers.
Results: The proposed sequence allows for 3D renal T1 imaging within two minutes and measured T1 value in phantom and volunteers were consensus with 2D-MOLLI.
Impact: This SR-GRASE sequence may provide a 3D fast clinical imaging technique for kidney.
Introduction
Renal T1 value is an important indicator for detection of renal fibrosis, acute kidney injury, and chronic kidney disease1. The recent consensus2 recommends 2D-MOLLI as renal T1 standard measurement, but it is single slice imaging and with low acquisition efficiency. Moreover, it is often affected by magnetic susceptibility artifacts in renal imaging. Giovanna et al3 proposed 3D SASHA sequence, which is difficult to satisfy the clinical needs due to long scanning time. This work aimed to develop a fast renal 3D T1 mapping technique, and investigated its accuracy of T1 quantification.Method
Sequence design: The proposed sequence (Fig. 1) consists of a non-selective SR pulse followed by GRASE readout sampling the SR-curve after saturation-time (TS). An B1-insensitive SR pulse utilizes a WET (water suppression enhanced T1 effects prepulse) composite saturation pulse4, which applied a four-pulse saturation train. Furthermore, a SPIR pulse is used for fat suppression.Ex-vivo experiment: The phantom contain mixture of agarose and (0.180,0.342,0.531,0.725 mM) NiCl25. All MRI data were scanned with a clinical 3.0T scanner (Ingenia, Philips Healthcare, Best, The Netherlands) and equipped with 32 channels torso coil.
In-vivo experiment: This study was approved by local Ethics Committee and informed consent was obtained from all volunteers. Three recruited volunteers (n=3) underwent MRI imaging using 2D-MOLLI and 3D-SR-GRASE sequence. Based on phantom experiments, the imaging parameters were set. The parameters of 3D-SR-GRASE were followed: nine sets of TS, ranging from 54ms to 3000ms6. TSE profile order: low-high, TSE Turbo direction: Z phase encoding, EPI direction: Y phase encoding, scan duration:94s. Scan parameters refer to Fig.2 for details. Data analysis: All MRI data were processed by MATLAB R2022b (The MathWorks, Natick, MA), MR images were de-noised by Non-Local Means(NLM) and registered by principal component analysis(PCA) using Elastix. Three-parametric exponential decay model was used to fit the T1 value. Renal cortex and medulla ROIs were outlined on the middle slice of the left kidney and right kidney.
Results
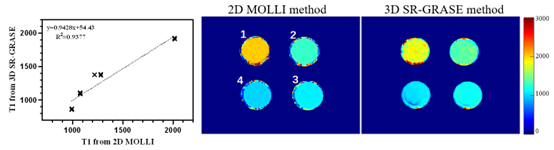
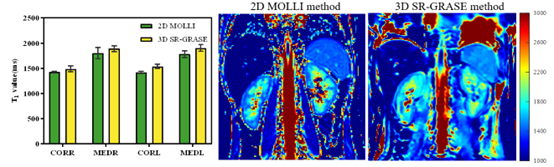
Ex-vivo: Figure 3 shows the T1 maps acquired by-2D MOLLI and 3D-SR-GRASE, and their quantification of T1 value. Compared with 2D-MOLLI, the 3D-SR-GRASE showed relative errors of -4.86%(vial 1)、9.33%(vial 2)、2.26%(vial 3)、-13.29%(vial 4) in T1 measurements.In-vivo: Figure 4 shows an example of the renal T1 maps generated by 2D MOLLI and 3D-SR-GRASE, respectively. The T1 values of cortex and medulla measured using 2D MOLLI were: 1419.5±18.37ms (left cortex), 1779.16±68.51ms (left medulla),1420.67±16.23ms (right cortex),1802.5±109.79ms (right medulla); the T1 values of human renal cortex and medulla measured using 3D-SR-GRASE were: 1535.33±42.19ms (left cortex), 1903±66.95ms (left medulla),1486.33±57.4ms (right cortex), 1891.67±58.82ms (right medulla). T1 values estimated by 2D-MOLLI and 3D-SR-GRASE showed strong correlation.
Discussion
This work showed that the proposed sequence is an accurate method for T1 measurement, and with great consistent with 2D-MOLLI sequence. The phantom experiments showed a relative 10% deviation and renal T1 values showed a great consistent with 2D-MOLLI. Due to use of SR pulses, no additional waiting time is required, and the acquisition efficiency is improved. However, 3D-SR-GRASE has a lower signal to noise (SNR) ratio than 2D-MOLLI.There is an underestimation of T1 in the 2D-MOLLI sequence, which may lead to inaccurate renal T1. Therefore, a sequence with higher precision needs to be used as a standard for further exploration. In addition, images fitting in this paper adopts three-parameter model, but the recovery process of magnetization may need to take into account the effects of T2 and T2*, which is worthy of further analysis.
Conclusion
The T1 values of the renal cortex and medulla obtained through the 3D-SR-GRASE are consistent with 2D-MOLLI, and imaging can be achieved within two minutes. This preliminary study suggested 3D-SR-GRASE has potential to become a clinically acceptable renal 3D T1 mapping technique.Acknowledgements
This study was supported by National Natural Science Foundation of China (U21A6005), Key-Area Research and Development Program of Guangdong Province (2018B030340001, 2018B030333001).References
1. Wolf M, de Boer A, Sharma K, et al. Magnetic resonance imaging T1-and T2-mapping to assess renal structure and function: a systematic review and statement paper[J]. Nephrology Dialysis Transplantation, 2018, 33(suppl_2): ii41-ii50.
2. Dekkers I A, de Boer A, Sharma K, et al. Consensus-based technical recommendations for clinical translation of renal T1 and T2 mapping MRI[J]. Magnetic Resonance Materials in Physics, Biology and Medicine, 2020, 33: 163-176.
3. Nordio G, Bustin A, Henningsson M, et al. 3D SASHA myocardial T1 mapping with high accuracy and improved precision[J]. Magnetic Resonance Materials in Physics, Biology and Medicine, 2019, 32: 281-289.
4. Morita K, Oda S, Utsunomiya D, et al. Saturation recovery myocardial T1 mapping with a composite radiofrequency pulse on a 3T MR imaging system[J]. Magnetic Resonance in Medical Sciences, 2018, 17(1): 35-41.
5. Captur G, Gatehouse P, Keenan K E, et al. A medical device-grade T1 and ECV phantom for global T1 mapping quality assurance—the T 1 Mapping and ECV Standardization in cardiovascular magnetic resonance (T1MES) program[J]. Journal of cardiovascular magnetic resonance, 2016, 18: 1-20.
6. Nordio G, Bustin A, Odille F, et al. Faster 3D saturation-recovery based myocardial T1 mapping using a reduced number of saturation points and denoising[J]. Plos one, 2020, 15(4): e0221071.
Figures
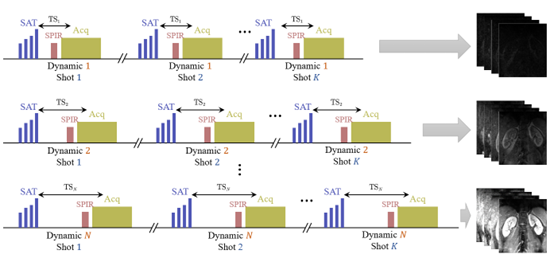
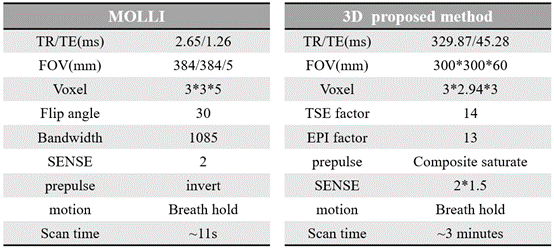
Figure 2. MR experiments scanning protocol