4546
Amide Proton Transfer Imaging Has added Value for Predicting Extraprostatic Extension in Prostate Cancer Patients1Department of Radiology, Nanxishan Hospital of Guangxi Zhuang Autonomous Region, Guilin, China, 2Philips Healthcare, Guangzhou, China, 3Philips Healthcare, Beijing, China
Synopsis
Keywords: Quantitative Imaging, Cancer
Motivation: Multi-parametric MRI is the most favorable imaging technique for local staging of PCa. Creating a combined model using these parameters would be desirable to improve the assessment of EPE.
Goal(s): To verify the diagnostic efficiency of tumor size, LCC, ADC, APT, and their combined models for predicting EPE.
Approach: The difference of tumor size, LCC, ADC and APT value between groups were compared. The ROC analysis was used for EPE prediction.
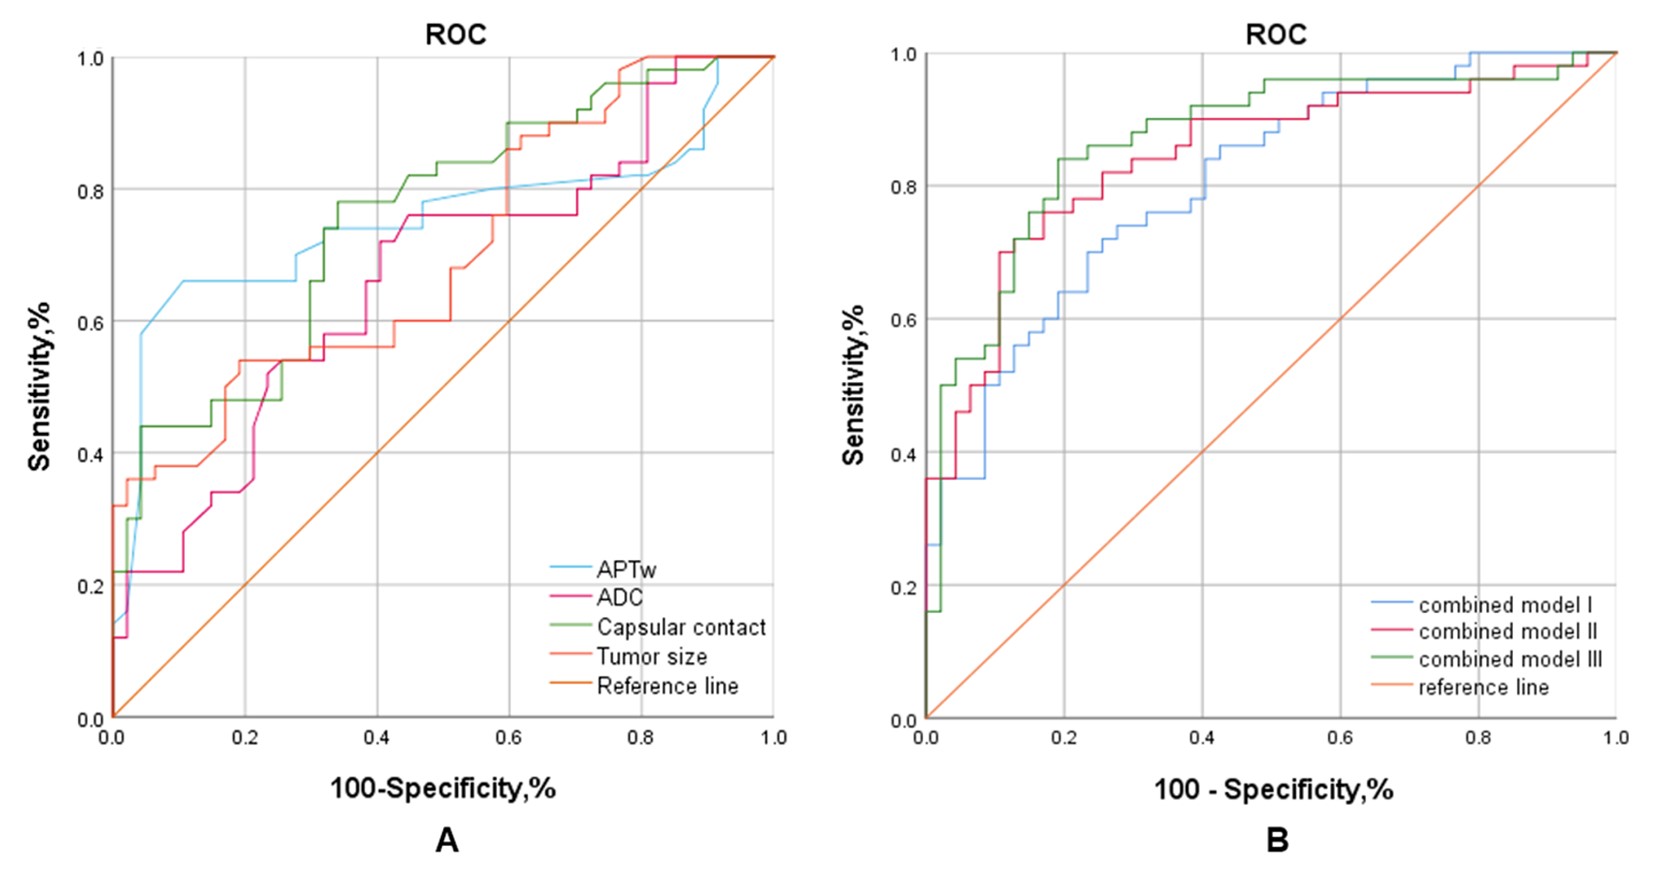
Results: APT, ADC, tumor size and the LCC were independent predictors of EPE. The AUC of model III (APT +ADC+LCC+tumor size) were 0.869.
Impact: These findings hold crucial clinical significance in the selection of appropriate therapeutic strategies for clinical cases of prostate cancer.
Introduction
Prostate cancer (PCa) is the most common malignant tumor in men [1].Extraprostatic extension (EPE) is a critical pathological feature of PCa that presents a challenge for PCa treatment. The patients with EPE have higher positive margin rates and are prone to biochemical recurrence [2]. Therefore, preoperative diagnosis of EPE is a vital factor, which directly affects the treatment and prognosis of patients [2]. Multi-parametric MRI (mp-MRI) is the most favorable imaging technique for local staging of PCa [3]. While tumor size and the length of capsular contact (LCC) reflect the morphological information of PCa, ADC and APT imaging techniques reflect differentiation and cell proliferation information of the PCa tissue. Given that these parameters reflect distinct information related to prostate cancer, creating a combined model using these parameters would be desirable to improve the assessment of EPE. Therefore, the objective of this study is to verify the diagnostic efficiency of tumor size, LCC, ADC, APT, and their combined models for predicting EPE.Methods
Forty-seven tumor organ confined patients (age, 64.16±9.18 years) and fifty EPE patients (age, 61.51±8.82 years) were enrolled in this study(Figure 1). All patients were pathologically confirmed PCa, underwent multi-parametric MRI scanning on a 3.0 MR system (Ingenia 3.0 CX; Philips Healthcare, Best, The Netherlands) with a 16-channel phased-array body coil.) and radical prostatectomy. The dominant lesion was defined as a mass-like region with decreased T2 signal and ADC. For each dominant lesion, a region of interest (ROI) was set in three consecutive layers, maintaining a distance from the lesion's edge to avoid volume effect (Figure 2). The difference of tumor size, LCC, ADC and APT value between groups were compared. Binary logistic regression was used to select the predictors. Factors with P<0.05 were used as the input variables for the receiver operator characteristic (ROC) curve analysis. The ROC analysis was performed to assess the diagnostic performance of each model based on different parameters for predicting EPE. The diagnostic efficacy of combined models was also analyzed. p value < 0.05 was considered statistically significantResults
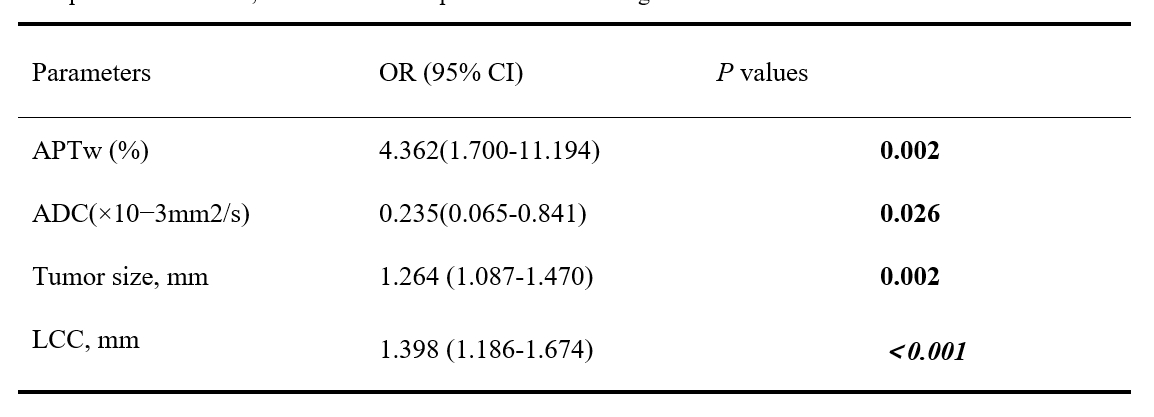
APT, ADC, tumor size and the LCC were independent predictors of EPE (Table 1). The area under the curve (AUC) of APT, ADC, tumor size and the LCC were 0.752, 0.665, 0.700 and 0.756, respectively (Figure 3A). The AUC of model I (ADC+LCC+tumor size), model II (APT+LCC+tumor size), and model III (APT +ADC+LCC+tumor size) were 0.803, 0.845 and 0.869, respectively (Figure 3B). The cutoff value of APT, ADC, tumor size and the LCC were 3.65%, 0.97×10⁻³mm2/s, 17.30mm and 10.78mm, respectively. The sensitivity/specificity of APT, ADC, tumor size and the LCC were 76%/89.4.0%, 80%/59.6%, 54%/78.9%, 72%/66%, respectively. The sensitivity/specificity of model I, Model II and Model III were 74%/72.3%, 82%/72.5% and 84%/80.9%, respectively.Discussion & Conclusion
High sensitivity is required when selecting optimal patients choosing candidates for radical prostatectomy. On the other hand, high specificity could be favored when there is a need to guard against overtreatment [4]. Consequently, we believe that based on our study's findings, APT imaging and its combined model would provide additional value in accurately assessing EPE. More importantly, the combination model balanced the sensitivity and specificity. These findings have important clinical implications in the selection of appropriate management strategies for clinical PCa.Acknowledgements
The
authors thank Department of Urology and Pathology of our hospital for their
help and discussion.
References
1. Siegel RL, Miller KD, Jemal A. Cancer statistics, 2019. CA Cancer J Clin. 2019 Jan;69(1):7-34.
2. Bill-Axelson A, Holmberg L, Garmo H, Taari K, Busch C, Nordling S, Häggman M, Andersson SO, Andrén O, Steineck G, Adami HO, Johansson JE. Radical Prostatectomy or Watchful Waiting in Prostate Cancer - 29-Year Follow-up. N Engl J Med. 2018 Dec 13;379(24):2319-2329.
3. Tay KJ, Gupta RT, Brown AF, Silverman RK, Polascik TJ. Defining the incremental utility of prostate multiparametric magnetic resonance imaging at standard and specialized read in predicting extracapsular extension of prostate cancer. European Radiology 2016; 70 (2): 211-213.
4. Woo S, Cho JY, Kim SY, Kim SH. Extracapsular extension in prostate cancer: added value of diffusion-weighted MRI in patients with equivocal findings on T2-weighted imaging. AJR Am J Roentgenol. 2015 Feb;204(2):W168-75.
Figures
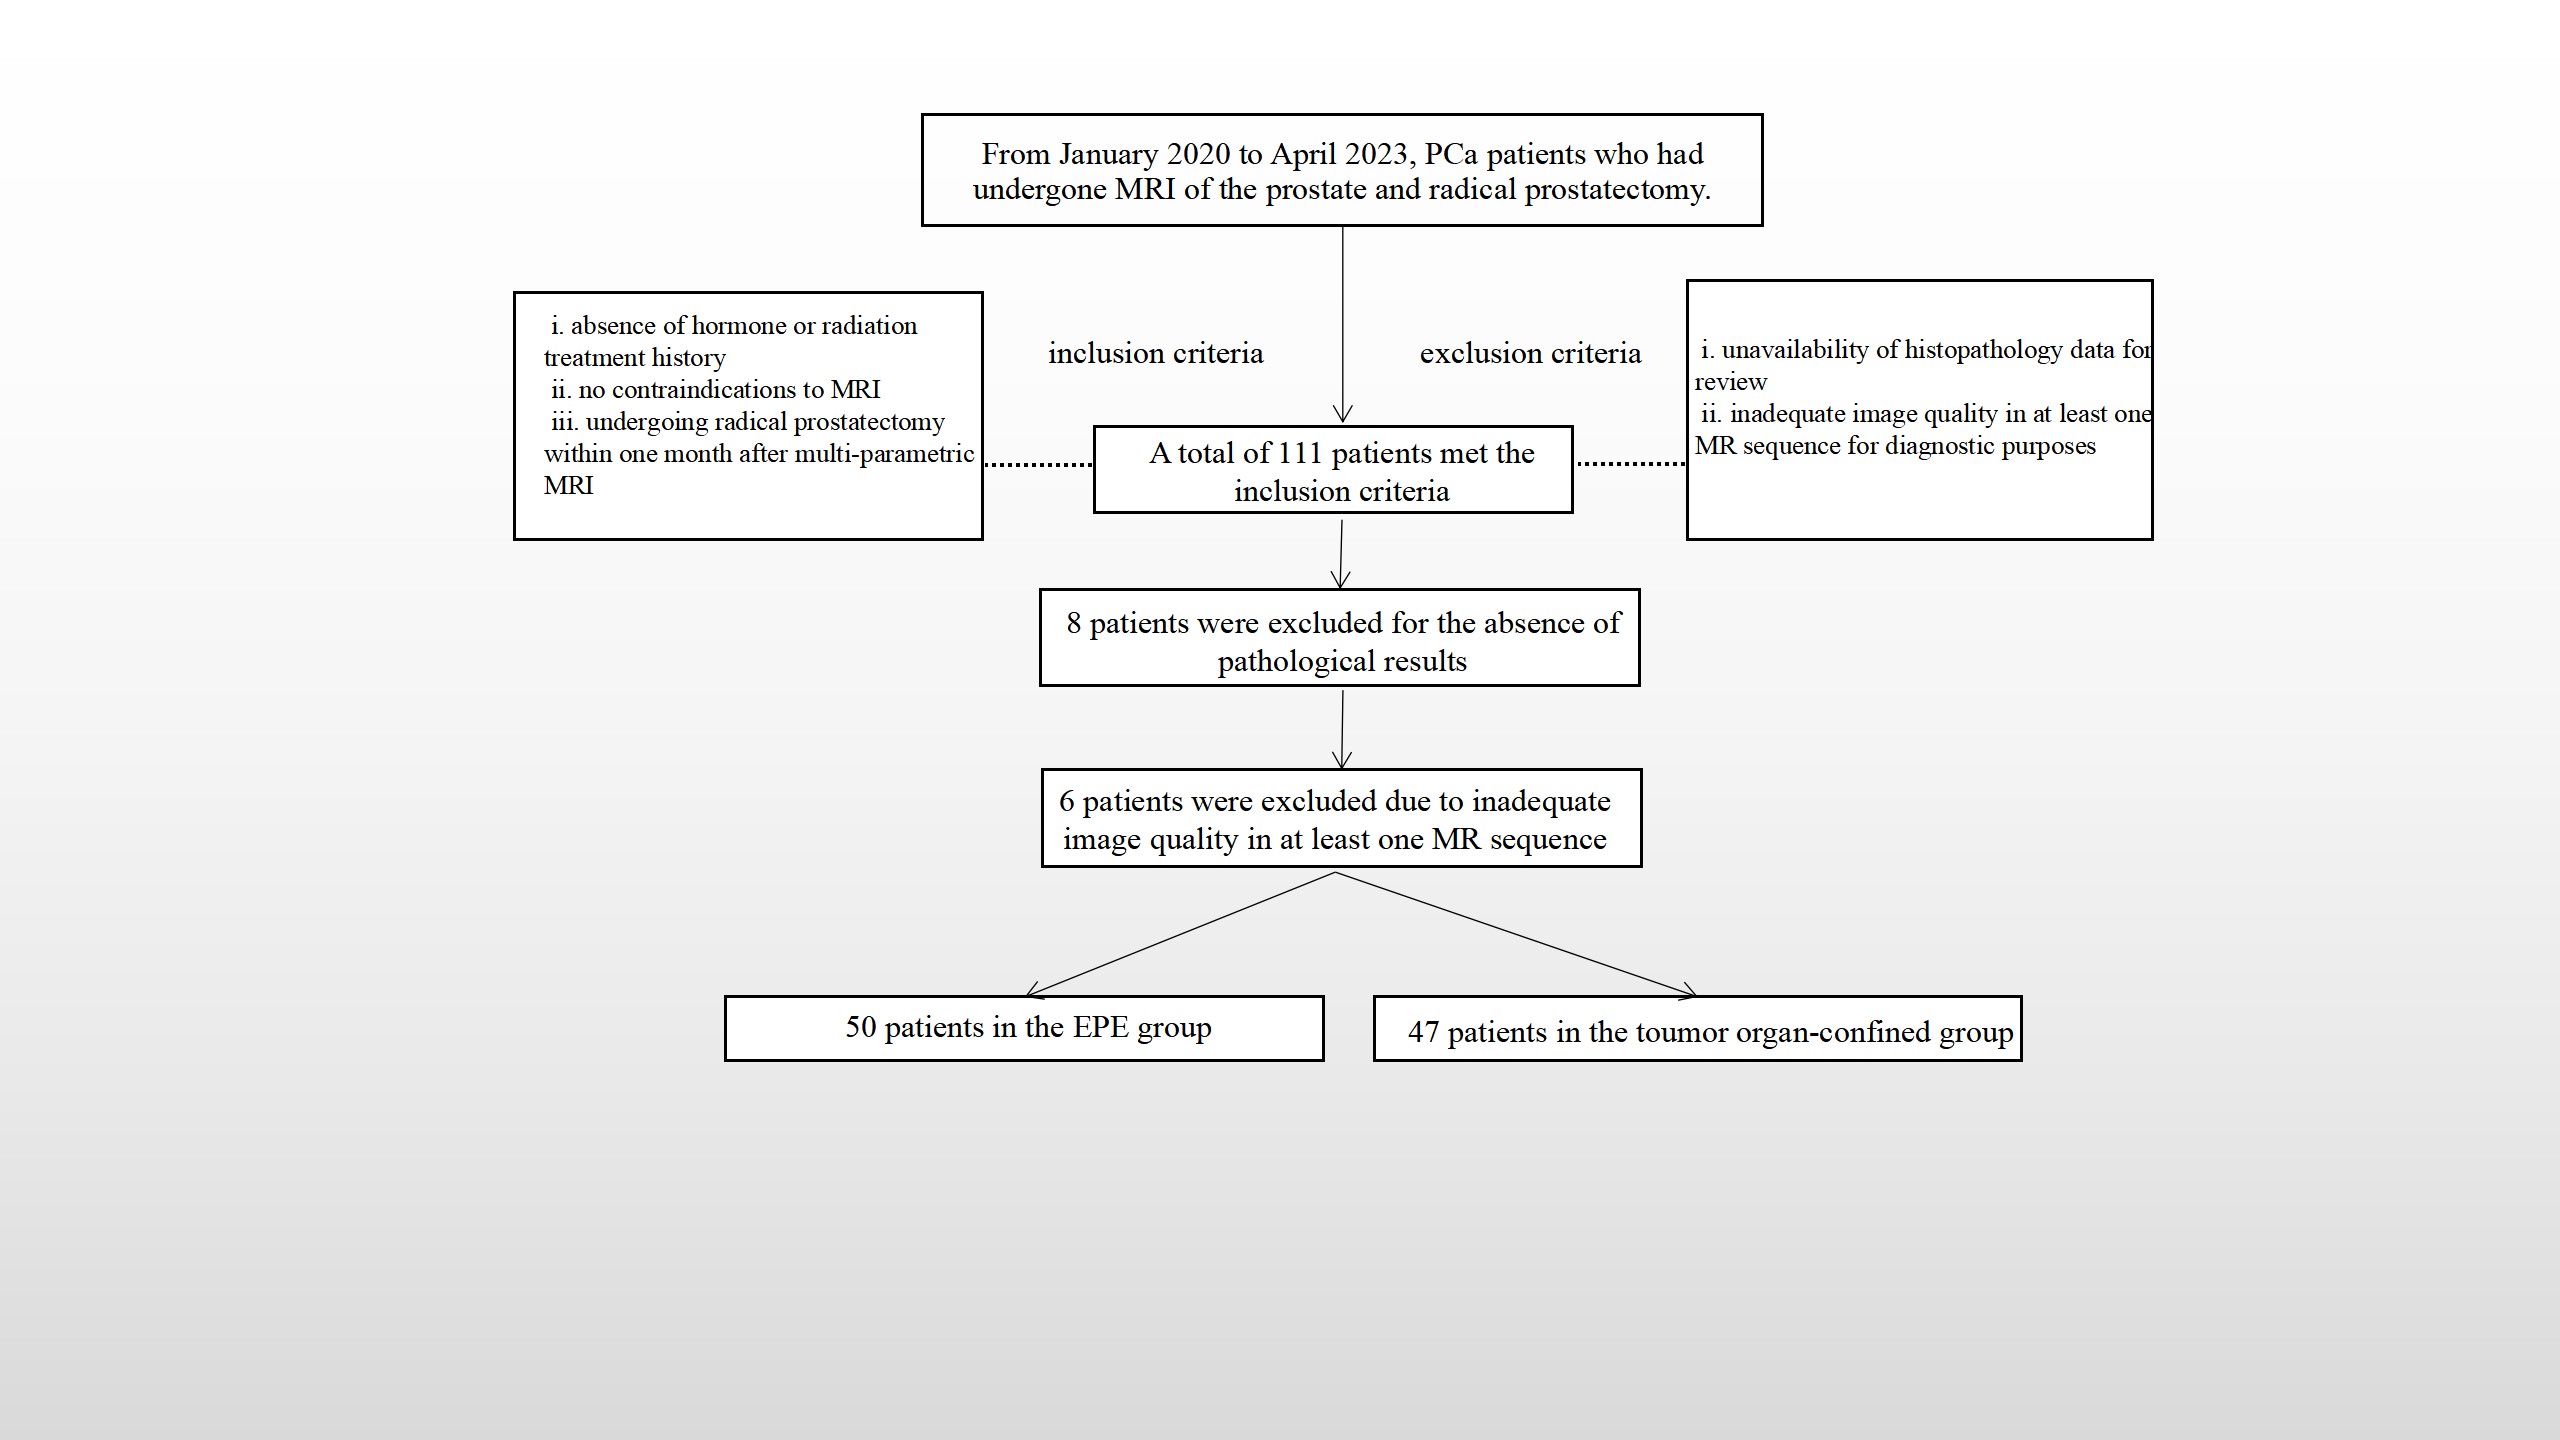
Figure 1. Flowchart of study participant selection.
MRI, magnetic resonance imaging; PCa, prostate cancer; EPE, Extraprostatic extension
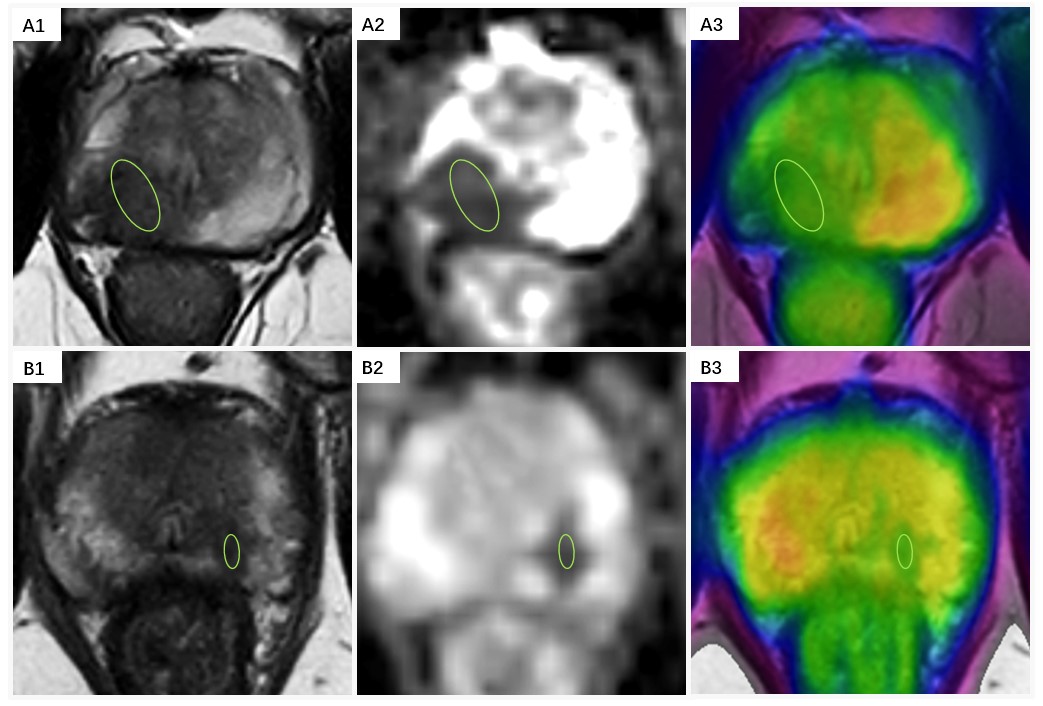
Figure 2. Indications of the definition of the ROIs for parameter analyses.
A: prostate cancer with EPE; A1,2: The lesion appeared hypointense on the T2-weighted image and the ADC map, ADC =0.92×10⁻³ mm2/s; A3: APT-weighted image with a T2WI overlay (APT =3.76%); B: prostate cancer confined within the organ: B1,2: The lesion appeared hypointense on the T2-weighted image and the ADC map, ADC =1.26×10⁻³mm2/s; A3: APT-weighted image with a T2WI overlay (APT =3.32%).